Progressively smaller glacier lake outburst floods despite worldwide growth in lake area
Main
Atmospheric warming has increased the rate of global glacier melt and forced most glaciers to retreat from their advanced positions1,2, creating ample space for glacier lakes to form and grow3,4,5,6,7. Maps derived from satellite images suggest that the global abundance, area and volume of glacier lakes grew by about 54%, 11% and 9%, respectively, between 1990 and 20208. In parts of High Mountain Asia, lake expansion has accelerated in recent decades6 following rapid increases in air temperature and accelerated rates of glacier mass loss2. Glacier lakes can trap rain and meltwater behind moraines, bedrock sills or glacier dams. Yet, these barriers can be unstable and release parts of the impounded water suddenly in glacier lake outburst floods (GLOFs)9,10. Depending on the size of the lake and the outflow rate, GLOF discharges can rise rapidly and sustain high water levels along proglacial channels for hours to days, with sediment-laden flood waves posing hazards to downstream communities11.
Prominent examples of catastrophic historic GLOFs in the twentieth and twenty-first centuries include the outburst of moraine-dammed Lake Palcacocha in the Peruvian Andes in 1941, which devastated the nearby city of Huaraz and claimed an estimated 1,800 lives12. In Alaska, some of the largest flood volumes and discharges reported in human history originated from ice-dammed lakes that formed and drained repeatedly, destroying bridges, roads and railways13,14. In southeast Tibet, villages and electrical facilities were destroyed twice within a decade when two moraine-dammed lakes failed in 2013 and 2020, respectively15. Even small GLOFs can cut communities off from supply routes for years as transportation and communication routes are difficult to rebuild in remote high-mountain areas16. Apart from destroying infrastructure, property and agricultural land, GLOFs can disturb ecosystems in mountain valleys and fjords for decades. For example, outbursts from moraine- and ice-dammed lakes in Chile wiped out many square kilometres of temperate rain forests, filling these river reaches with several metres of debris and temporally altering the temperature and biochemistry in fjords downstream11,12,13,14. Proglacial rivers can take months to years to evacuate GLOF-transported sediment from riverbeds and floodplains, with increased sediment yields abrading turbines, filling hydropower reservoirs, and reducing their efficiency and lifespan17.
In response to these social and environmental impacts, research has increasingly focused on tracking the location and area of glacier lakes from satellite images at increasing temporal and spatial resolution18. Lake area scales with lake depth and volume19, suggesting that the ongoing growth of lakes may produce larger GLOF volumes or discharges if their dams fail17,20,21. Growing lakes also offer a larger target area for mass movements such as landslides or avalanches from steep adjacent slopes that may cause displacement waves22. Consequently, an increase in lake area raises the overall hazard potential for GLOFs, even if the size and frequency of potential external triggers entering the lakes were to remain constant4. Therefore, lake area has become a key predictor in regional lake-stability assessments to identify lakes that are potentially prone to failure23,24,25,26,27 and has informed many local GLOF hazard and risk appraisals21,28,29,30,31,32,33. Mapping lake area from satellite imagery has lower relative uncertainties than any of its derivatives such as lake volume or potential peak discharge in the event of failure (Methods and Extended Data Fig. 1). Following our compilation of numerous previously published lake inventories18, we consider the pre-GLOF lake area, that is, the lake area immediately before outburst, as a proxy for GLOF hazard, thus offering a metric comparable to those widely used in flood hazard assessments.
However, despite years of monitoring lakes by remote sensing18, it remains unclear whether the overall increase in glacier lake area8 has also led to outbursts from successively larger lakes. Identifying regional trends in pre-GLOF lake areas is thus an essential step towards more detailed, local GLOF risk assessments34. However, existing GLOF databases are limited by their regional focus, inconsistent time spans and biases towards populated or more accessible regions with significant societal impacts35. In response, continuous remote sensing over the past three decades has offered an opportunity to update and standardize regional GLOF records, minimizing the reliance on selective eyewitness accounts. Repeat optical satellite imagery also aids in validating reported GLOFs and distinguishing them from other cryospheric mass flows such as debris flows, flash floods or rock–ice avalanches36. Thus, a regionally consistent GLOF database, including mapped lake areas before failure, would allow us to explore links and potential differences between regional lake expansion and pre-GLOF lake areas.
Results and discussion
Ice-dammed lakes as drivers of GLOF occurrence and size
We compiled and evaluated the most comprehensive available dataset of reported GLOFs worldwide18,37. This dataset enabled us to quantify changes in regional pre-GLOF lake areas between 1990 and 2023—a period of continuous satellite coverage—and to place them within the context of regional lake area changes. We focused on 1,686 reported outbursts from subaerial lakes dammed by glacier ice or moraines and bedrock in 13 glacierized mountain regions outside polar regions in northwest North America, South America, Europe and High Mountain Asia (Fig. 1). For each reported GLOF, we manually mapped the lake area before the reported date of failure from satellite images (Methods).
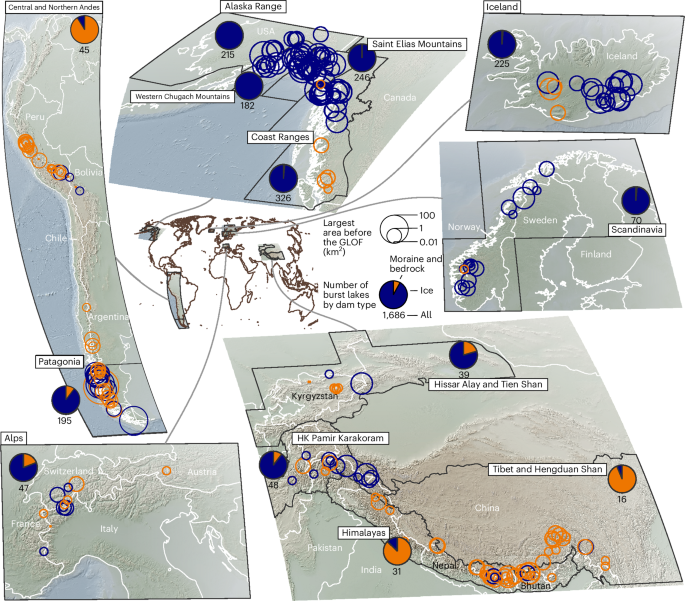
Global overview (centre) of the 13 study regions surrounded by higher-resolution maps of these areas. The open circles show lake areas before outbursts that occurred between 1990 and 2023. We chose the largest of all lake areas in the case of repeated outbursts from the same lake. The pie charts distinguish ice-dammed lakes (ice-dammed and supraglacial) from moraine- and bedrock-dammed lakes, with the total number of burst lakes in each region indicated below the charts; the legend shows the ratio across all regions. The dark grey outlines of the study regions represent (partly dissolved) O2 polygons from the RGI V6.0 (https://nsidc.org/data/nsidc-0770/versions/6). Country (white) and continental (brown) boundaries are from the online ArcGIS Hub hosted by Esri Data and Maps (https://hub.arcgis.com/). Background maps show shaded reliefs of the 2022 ETOPO Global Relief Model (https://www.ncei.noaa.gov/products/etopo-global-relief-model). Maps created using QGIS V3.22.6 (https://www.qgis.org/). HK, Hindu Kush.
We found that ice-dammed lakes were the main source of GLOFs, accounting for 92% (n = 1,550) of all reported events (Fig. 1). This high proportion is due to the repeated filling of, and outbursts from, these lakes: 127 ice-dammed lakes burst out at least twice and 61 lakes more than 10 times during the study period. Ice-dammed lakes have caused almost all of the reported outburst floods in northwest North America, Iceland and Scandinavia. In contrast, only a handful of moraine-dammed lakes have failed twice or more because the escaping water irrevocably erodes or destroys the dams, reducing the chance of similarly large subsequent outbursts. Only seven regions have had more than five reported GLOFs from moraine- and bedrock-dammed lakes during our study period. Three regions alone, the Central and Northern Andes, the Himalayas and Patagonia, accounted for 70% of all reported failures of this dam type. The regional rate of GLOF reporting thus hinges heavily on the abundance of ice-dam failures: if averaged across all study regions, the annual number of reported ice-dam failures is approximately ten times higher than that of moraine-dam failures (Fig. 2a).
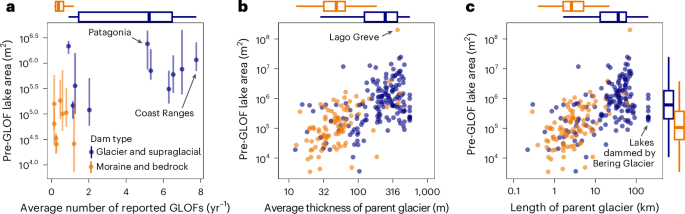
a, Average number of reported GLOFs per year in the 13 study regions versus regional pre-GLOF lake area. Points represent the median and lines span the 25th to 75th percentiles of pre-GLOF lake areas in regions that had more than five GLOFs per dam type (n = 1,671). Patagonia is the region with the largest pre-GLOF lake area and the Coast Ranges had the highest reporting rate. b, Estimated average thickness of parent glaciers39 versus pre-GLOF lake area. For lakes with repeated outbursts, we show only the largest pre-GLOF lake area per site (n = 255). c, Length of the parent glacier40 versus pre-GLOF lake area (n = 255). The marginal boxplots show the median (thick line), interquartile range (box) and 1.5 times the interquartile range (whiskers) for a given sample, distinguished by dam type. The colour code in a also relates to b and c.
Our data show a diverging relationship between the number of lakes by dam type and the corresponding number of reported outbursts. While a similar number of moraine- and bedrock-dammed lakes (n = 128) and ice-dammed lakes (n = 172) failed between 1990 and 2023, the latter were far less abundant. For instance, in northwest North America, only 10% (n = 60) of all glacier lakes were dammed by ice as of 20185; all of them had burst at least once and half of them more than ten times since 1990. By contrast, only six lakes of the remaining 90% moraine- and bedrock-dammed lakes in northwest North America had burst out. Similarly, only 9% (n = 39) of all lakes in Scandinavia were dammed by ice as of 20187, but half of them also had burst at least once during our study period. In contrast, regions with abundant moraine- and bedrock-dammed lakes had a low rate of failure. In Patagonia and High Mountain Asia, 92% (n = 2,931)3 and 98% (n = 26,633)28 of all glacier lakes are dammed by moraines and bedrock, respectively. Yet, only 0.7% and 0.2%, respectively, of these lakes had reported outbursts between 1990 and 2023.
Ice-dammed lakes also dominate the size distribution of lakes with reported GLOFs: the areas of ice-dammed lakes before the outburst (({0.71}_{-0.45}^{+1.39}) km2, median and interquartile range) were about ten times larger than those of moraine- or bedrock-dammed lakes (({0.08}_{-0.05}^{+0.15}) km2) that failed between 1990 and 2023. The areas of ice-dammed lakes before failure in Patagonia have been the largest worldwide, exceeding the pre-GLOF size of moraine- and bedrock-dammed lakes in other regions by one to two orders of magnitude (Fig. 2a). In this region, some large ice-dammed GLOFs had gone unnoticed, including those from Lago Bernardo, which has burst at least 16 times since 2001, with each pre-GLOF lake area exceeding 15 km2. Patagonia also had the largest reported GLOF from Lago Greve (203 km2 before dam break), where Glaciar Pio XI thickened and caused the ice-dammed lake to spill over a lateral moraine barrier32. This lake area was 120 times greater than that of South Lhonak Lake38 (India), which burst out in 2023 and is the largest moraine-dam failure in our database.
We infer that ice-dammed lakes produce more and larger outburst floods than moraine- and bedrock-dammed lakes. The size of the parent glacier provides important clues for identifying locations where ice-dammed lakes have formed and failed. Overall, only the top 1% longest and thickest of the 143,000 glaciers in our study regions have dammed lakes that drained rapidly during our study period. Glaciers that impounded burst ice-dammed lakes were thicker (({249}_{-122}^{+140}) m, median and interquartile range)39 and longer (({36}_{-23}^{+20}) km)40 than glaciers associated with moraine- and bedrock-dammed lakes (Fig. 2b,c). These lakes lie at the margins of much thinner (({48}_{-16}^{+17}) m) and shorter (({2.5}_{-0.9}^{+2.6}) km) glaciers, likely indicating enhanced glacier mass loss and retreat after advances, providing more accommodation space for lakes. The thickest ice dams are nourished by ice fields, such as the Bering Glacier, the largest glacier in northwest North America (Fig. 2c). Such ice dams can be thick enough to impound multiple lakes, each exceeding the area of most burst moraine- and bedrock-dammed lakes in our inventory.
No increasing trend in pre-GLOF lake areas since 1990
Thus, to estimate historical trends in pre-GLOF lake area, it is vital to differentiate between dam types and regions. We used hierarchical robust linear regression models to determine whether the pre-GLOF lake areas of ice-dammed and moraine- and bedrock-dammed lakes changed credibly (that is, 95% of the posterior probability mass of the regression slope excludes zero) in our 13 study regions between 1990 and 2023 (Methods). Our model structure accounts for correlations in regression parameters between groups, resulting in more accurate parameter estimates, especially in regions with few reported GLOFs. The models share information between regions and individual lakes, such that we can distinguish trends in pre-GLOF lake areas at global (highest), regional (intermediate) and local (lowest) levels.
If averaged across all of the study regions, the pre-GLOF area of burst ice-dammed lakes decreased credibly by a quarter from ({0.74}_{-0.34}^{+0.66}) km2 (median and 95% posterior highest density interval (HDI)) in 1990 to ({0.57}_{-0.26}^{+0.47}) km2 in 2023 (Fig. 3a). Iceland and the Coast Ranges (northwest North America) showed negative trends and were largely responsible for this overall decline, with all other regions showing inconclusive trends (Fig. 3b,c and Extended Data Fig. 2a). The hierarchical model for ice-dam failures also estimated trends for 96 lakes that had had at least five outbursts each. The signs of these trends aligned with the global and regional pattern: in 30% of cases (29 out of 96), the lake area before the GLOF decreased and it remained unchanged in 62% of cases. Only seven ice-dammed lakes were credibly and increasingly larger before each outburst (Extended Data Fig. 3).
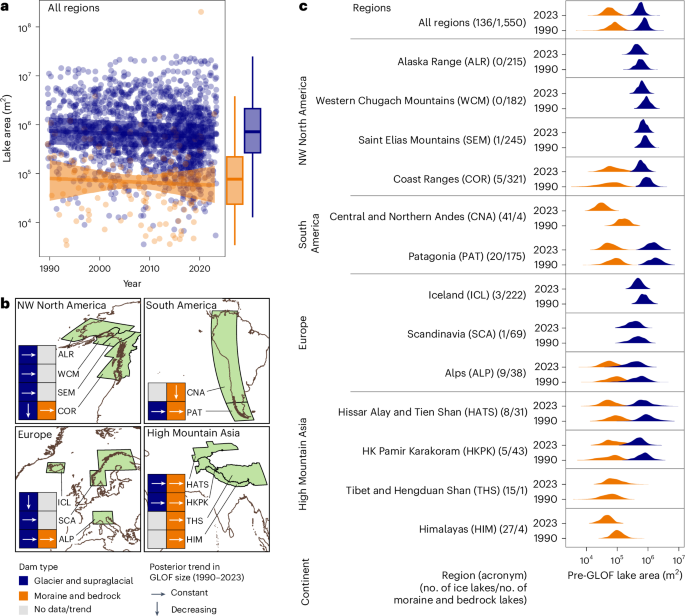
a, Trends in pre-GLOF lake areas for ice-dam failures (blue) and moraine- and bedrock-dam failures (orange) across all regions. The lines represent the median and the shades are the 95% HDI of the posterior trend. The boxplots show the median (thick horizontal line), the interquartile range (box) and 1.5 times the interquartile range (whiskers) of pre-GLOF lake areas, distinguished by dam type. b, Summary by continent of regional trends in pre-GLOF lake areas for ice-dammed lakes and moraine- and bedrock-dammed lakes. The directions of the arrows show whether the posterior trend in pre-GLOF lake areas was credibly negative or unchanged. Grey boxes are regions without estimated trends, when a region had less than five GLOFs from a given dam type. NW, northwest. The regional abbreviations are defined in c. c, Posterior distributions of pre-GLOF lake areas in 2023 and 1990 in each region for the two dam types. The numbers in parentheses show the sample size of ice-dammed and moraine- and bedrock-dammed lakes, respectively.
Similarly, from 1990 to 2023, the pre-GLOF areas of moraine- or bedrock-dammed lakes remained unchanged globally and even decreased in the Central and Northern Andes (Fig. 3a,b). None of the other regions showed credible trends in pre-GLOF lake area, regardless of how much lakes have grown in past decades8. Even the largest GLOFs from moraine-dammed lakes (pre-GLOF lake area >1 km2) in the past 10 years, all involving major damage15,38,41, failed to produce a positive trend in pre-GLOF lake area as equally large lakes had burst in the 1990s and early 2000s42,43,44. The marginal posterior distributions of burst moraine- and bedrock-dammed lake areas in 1990 and 2023 are broader than those of ice-dammed lakes, reflecting the imbalance of dam types in the data (Fig. 3c and Extended Data Fig. 2b). Nevertheless, their sizes before the GLOF are consistently smaller by approximately one order of magnitude compared with ice-dammed lakes.
Limited control of lake growth on pre-GLOF lake area
We compared these trends in pre-GLOF lake area with a global glacier lake inventory8 generated for the years 1990 to 2020. This inventory also distinguishes between ice-dammed and all other glacier-fed lakes, broadly referring to our class of moraine- and bedrock-dammed lakes. Across our study regions, we found that 15,059 new glacier lakes (+69.2%) formed between 1990 (n = 21,771) and 2020 (n = 36,830; Fig. 4a). Similarly, the total lake area grew by 1,505 km2 or +0.7% yr−1 in this period (Fig. 4b). Importantly, the formation and growth of lakes occur at opposite ends of the lake frequency–size distribution. While most of the increase in lake abundance (99.2%) involved small lakes <1 km2, 70% of the gain in lake area occurred at a few hundreds of large lakes >1 km2 (Fig. 4b). Regionally, we found that all regions had positive growth rates, with the lowest in Scandinavia (+0.32% yr−1) and the highest in Iceland (+3.93% yr−1; Extended Data Fig. 5). Yet, the growing amount of meltwater stored particularly in large glacier lakes had little impact on pre-GLOF lake area: only 23% of all lakes were >1 km2 when they failed. By contrast, rapidly drained lakes cover the mid-lake size distribution (Fig. 4c), which likely reflects the limited impact, and thus limited reporting of GLOFs from small lakes. Only 3.8% of all lakes >1 km2 had at least one outburst in our study period (Fig. 4c), suggesting that both lake size and growth are unsuitable proxies for trends in pre-GLOF lake area.
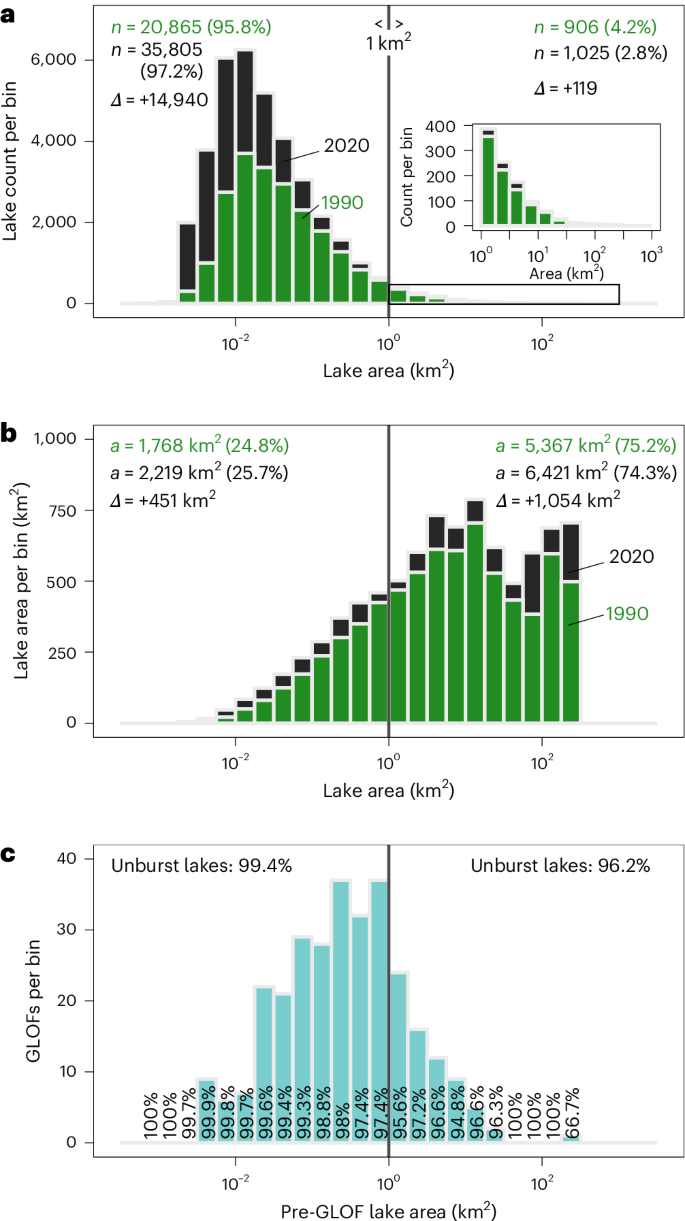
a, Histogram showing the number (n) of mapped lakes in 1990 and 2020 with a given lake area (data from ref. 8). Inset: enlargement of the histogram for lake areas >1 km2. b, Histogram showing the total lake areas (a) in 1990 and 2020. Green (black) numbers refer to data in 1990 (2020). Δ represents the difference between 1990 and 2020. c, Histogram showing the distribution of reported GLOFs with mapped pre-GLOF lake areas. The numbers overlaying the bars show the percentage of all lakes per bin that did not have a reported outburst in our study period. In a–c, bin sizes encompass a quarter of an order of magnitude in lake area. The vertical lines distinguish small (1 km2) and large (>1 km2) lakes.
Given the differing trends in pre-GLOF areas between dam types, we also needed to distinguish temporal changes in ice-dammed lake areas from moraine- and bedrock-dammed lake areas. Accordingly, the area of moraine- and bedrock-dammed lakes in northwest North America grew by 42% (+491 km2) between 1984–1988 and 2016–20195. Meanwhile, ice-dammed lakes shrank by 24% (−28 km2)5. In High Mountain Asia, the area covered by moraine- and bedrock-dammed lakes increased by 7% (+123 km2), while ice-dammed lakes decreased by 6% (−1.5 km2) between 1990 and 201526. Glacier-fed lakes in Iceland grew by 135%, while ice-dammed lakes almost disappeared (−93%) between 1990 and 20208. Thus, the global decline in ice-dam failures is consistent with the regional decrease in ice-dammed lake areas. The lakes shrank as the dams of their parent glacier thinned, reducing the storage capacity of lake basins45. Indeed, when we grouped the lakes based on their trend in outburst flood size, we noticed that lakes with decreasing areas had higher rates of dam thinning (Extended Data Fig. 4). However, lateral expansion or displacement of lakes46, changes in the subglacial drainage network47 or glacier surges48 can maintain regional trends in pre-GLOF lake area even in periods of widespread glacier melt2.
In contrast, the pre-GLOF areas of moraine- and bedrock-dammed lakes have remained largely unchanged despite overall trends in lake expansion8. Hence, the proportion of total glacier lake area that has led to GLOFs has decreased for these types of dam in recent decades. This observation supports findings from the Himalayas, where moraine-dammed lakes were equally prone to failure regardless of how much they grew before the outburst49. One possible explanation for the negative trend in pre-GLOF lake area is that the least stable moraine-dammed lakes tend to fail soon after they form because their unconsolidated dams are unable to impound increasing meltwater volumes10. When we used the difference in pre- and post-GLOF lake area as a proxy for GLOF volume, we found that the size of moraine- and bedrock-dam failures has declined since 1990 (Extended Data Fig. 6a). Moreover, lakes rarely drain completely as their areas grow: on average, burst moraine- and bedrock-dammed lakes >1 km2 retain about half of their pre-GLOF size (Extended Data Fig. 6b). One explanation for this observation is that the base of these large lakes can sit in bedrock depressions, where the shear stress required to erode the dam during floods is far higher than for weaker moraine material50. As peak discharges drop rapidly after flood onset, the energy available for bedrock incision diminishes. In these settings, even high-impact external triggers such as ice avalanches and landslides or rapid lake-level rises from precipitation or glacier melt are unlikely to fully breach the barrier of these lakes51,52. Displacement waves from mass movements, by contrast, may only drain a small fraction of the lake water, often leaving the dam intact. In the Tropical Andes, the largest historical GLOFs (in terms of released volume) originated from moraine-dammed lakes between the 1930s and the 1950s, when the lakes were still in contact with their receding parent glaciers and prone to ice avalanches4. With ongoing deglaciation, most recent GLOFs in this region have come from partially breached bedrock-dammed lakes at higher elevations, where space for the lake to grow is limited4. Thus, pre-GLOF lake areas have decreased in this region due to smaller lake volumes and more resistant barriers to incision following external triggers53. Nevertheless, the hazard potential for future outbursts persists as 83% of all moraine- and bedrock-dammed lakes that had a documented outburst breached partially and could be prone to future outbursts.
Limits to increasing pre-GLOF lake areas
The stability of pre-GLOF lake areas is striking, particularly during a period of growing lake sizes8 and heightened research interest in GLOFs35,54. The shift towards outbursts from progressively smaller lakes raises the question of whether larger lakes have become more resistant to failure. Large lakes (>1 km2) have raised considerable concerns in previous risk assessments24,27,28,31 as they accommodate most meltwater (Fig. 4b) and pose the highest GLOF hazard potential in terms of the maximum lake area that could possibly drain. Understanding the factors that might confer stability to these large lakes is thus key to explain the trend towards smaller dam failures. To this end, we investigated the relative importance of measurable key controls10,21,24 for large lakes that have not burst yet. Specifically, we assessed the material of the dam, trends in lake growth, connection to the parent glacier, outlet channel geometry and human measures at 969 large glacier lakes (>1 km2) with no reported GLOF as of 20208 (Fig. 5) (Methods).
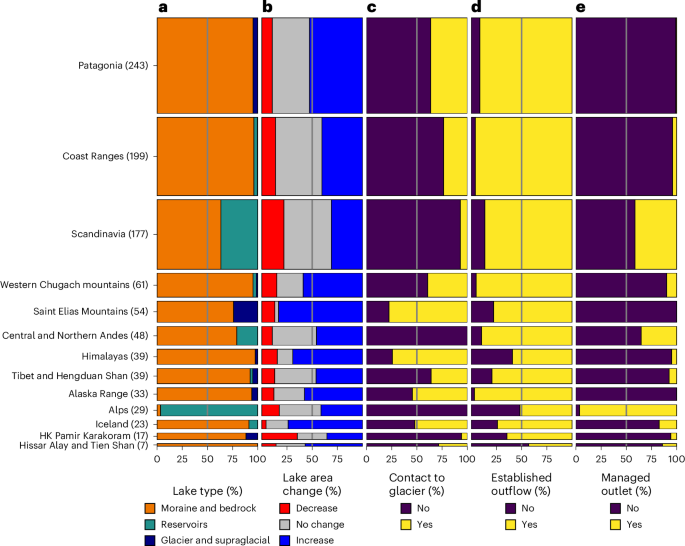
Key factors that might confer stability to large glacier lakes that have not yet burst were investigated. a, Dam type, including artificial dams (reservoirs). b, Lakes classified according to whether their areas decreased, did not change or increased between 1990 and 2023. c, Lakes with or without contact with the parent glacier. d, Lakes with or without established outflow channels. e, Lakes with or without managed outlets for mitigation measures or hydropower production. The heights of the bars are scaled to the present-day number of unburst lakes larger than 1 km2 according to ref. 8. The sample sizes for each region are given in parentheses.
We found that 85% of all large ‘unburst’ glacier lakes worldwide are currently dammed by moraines or bedrock (Fig. 5a). Of the remaining lakes, more are artificially dammed reservoirs (12%) than ice-dammed lakes (3%). Patagonia hosts more than a quarter of all large lakes today and thus has the largest regional GLOF hazard potential, that is, the largest cumulative lake area that could possibly drain. However, only 5% of the large lakes in Patagonia had experienced outbursts in our study period.
Yet, globally, half (51%) of all unburst lakes >1 km2 today did not grow credibly in our study period, and 14% even shrank (Fig. 5b). Most moraine-dammed lakes connected to their parent glaciers today are found in the Himalayas and the Saint Elias Mountains, and half of these lakes have been growing in recent decades; yet, only two growing lakes >1 km2 in the Himalayas have experienced outbursts since 199038,43. However, lake growth may come to a halt if the parent glaciers recede out of their overdeepened basins into steeper terrain10. Globally, 70% of all lakes >1 km2 have already detached from their parent glaciers (Fig. 5c). A growing distance to the glacier might make these lakes less prone to falling ice impacting lakes and causing displacement waves4. Such waves have frequently triggered GLOFs by overtopping the lakes and breaching their dams, causing about half of all reported moraine-dam failures in the Cordillera Blanca53 and up to 90% of all cases in High Mountain Asia52. Almost all large lakes in widely deglaciated mountain regions, such as Scandinavia, the European Alps, and the Central and Northern Andes, are detached from their parent glaciers today (Fig. 5c). Landslides and rock avalanches from adjacent debuttressed hillslopes might also trigger GLOFs22, although less than a dozen landslide-triggered GLOFs have been reported globally since 1990. Lakes can be resilient even against ground shaking and landslides generated during earthquakes: only two earthquakes are known to have triggered GLOFs globally during our study period. In the Northern Andes, only one earthquake has been reported to have triggered GLOFs since 1900. Overall, seismic activity remains a speculative trigger for GLOFs55.
Our visual analysis of outlet channels further suggested that 87% of all large lakes have developed a natural, low-gradient outlet channel incised into moraine or bedrock dams56. These channels can be many metres wide, armoured with boulders and resistant to high outflow after intense rainfall events, snowmelt or displacement waves (Extended Data Fig. 7b). Human measures and management have increasingly helped to stabilize these outlets: 23%, 37% and 97% of all large lakes in the Northern and Central Andes, Scandinavia and the European Alps, respectively, are used for hydropower generation or freshwater production (Fig. 5a,e). Their constructed or reinforced dams help to maintain a constant lake level to prevent uncontrolled drainage, leaving only smaller lakes to fail and contribute to some of the lowest pre-GLOF lake areas in our study regions (Fig. 3c). Artificial dams and outlet channels seem to be more stable than naturally formed dams as there have been no recorded failures of large reservoirs close to glaciers during our study period. Some reservoirs even mitigate the impacts of upstream GLOFs and the excess water input from GLOFs has been beneficial for hydropower production57.
Where lakes have continued to grow after an outburst, engineering measures can reduce the impact of subsequent GLOFs. For example, when Lake Palcacocha (Peru) began to grow again after a GLOF in 1941, two concrete spillways were built to absorb potential splash waves and pumps were installed to lower the lake level58 (Extended Data Fig. 7c). Such measures cannot completely rule out the occurrence of future outbursts and a handful of GLOFs were triggered during the installation of mitigation structures4; however, in most cases, they can significantly reduce their runout, inundation extent and flow depth59.
Implications for GLOF hazard and risk management
In summary, we found only a few credible and exclusively negative trends in pre-GLOF lake area between 1990 and 2023. While atmospheric warming, glacier retreat and lake growth constitute an emblematic cryospheric hazard cascade58,60, we found no evidence that this process chain has translated into GLOFs from larger lakes during our study period. A trend towards outbursts from smaller lakes supports conceptual models that propose lag times between atmospheric warming, glacier retreat, lake formation and failure4,60. However, as glacier lakes detach from their parent glaciers, they may become less prone to failure as the distance between the source and the impact area of ice avalanches increases61. Lake growth might even increase the resilience against landslide impacts as impulse waves attenuate on lakes, possibly making dam overtopping for a given landslide size less likely4. How long-term changes in slope stability, possibly related to thawing permafrost, affect the size of lake outbursts is still a largely unexplored question22. GLOF activity might have been different before our study period and subject to differing trends in the future for reasons that await closer examination60. Similarly, the lake size prone to future GLOFs is difficult to estimate as models need to reconcile rates of projected glacier retreat with the exposure, size and damming mechanism of glacier lakes62. For example, hundreds of proglacial lakes may form in the Alps if glaciers disappear completely; however, only a few lakes would exceed 1 km2 in size63,64,65. Moreover, sedimentation could reduce their storage capacity by more than a third in this century65. In contrast, the hazard potential in Alaska5 and the Himalayas28 is still likely to increase because large new lakes will form alongside their receding parent glaciers. The Karakoram could also accommodate hundreds of ice-dammed lakes orders of magnitudes larger, at least for some decades in the twenty-first century before their dams eventually melt away66. This region could become a temporary hotspot of future GLOF activity should these ice-dammed lakes burst at similarly high rates to current ones67. Early and systematic identification of future large ice-dammed lakes is imperative for this region to timely implement mitigation measures and prevent damage to infrastructure and loss of life67.
In this regard, we stress the importance of robust baseline data and hierarchical Bayesian models to quantify trends in pre-GLOF lake areas, including their uncertainties, objectively. These models naturally accommodate updates as new data become available and as our knowledge of the underlying processes and parameters improves. Thus, our appraisal forms a desired compromise between subjective expert beliefs on trends in pre-GLOF lake area, GLOF hazard and consistently compiled data. Future work might integrate local lake bathymetry into our model, such that lake areas can be better scaled to, and compared with, flood volumes and peak discharges, some of the most widely used metrics in outburst flood hydrology50,56,68. The pre-GLOF lake area is a readily available proxy for the maximum volume of the GLOF and can therefore serve as a metric for the worst case of complete lake drainage, an important scenario in hazard assessment69. However, our data show that partial drainage is more common, especially among larger lakes. Recent work suggests that lake and flood volumes can only be estimated from lake area alone under certain geometric assumptions70, improving empirical scaling relationships that have order-of-magnitude errors19 (Extended Data Fig. 1). Such work will help to better determine the effective flood volume in the event of failure while accounting for other factors such as the geometry of the dam or the size and energy of potential triggers. Once these data are available, hydrodynamic models will be necessary to simulate GLOF impacts under different channel geometries, flow hydraulics, and sediment transport rates and entrainment71.
One of the greatest concerns over future GLOF impacts is the many hundreds of hydroelectric dams operating, under construction or planned along glacier-fed rivers, mainly clustered in the Himalayas and the Karakoram17,34. Without implementing engineering measures, GLOFs will threaten this infrastructure in the future28. Our regional appraisal provides a starting point for more targeted risk assessments at the basin and local scale. Ice-dam failures, the historic drivers of regional GLOF rates and size, have rarely entered such appraisals and need better recognition in local hazard zonation, given that their hydrodynamic properties differ from those of overtopping moraine dams68. We recommend conducting case-by-case simulations to assess the exposure and vulnerability of hydropower facilities and other critical infrastructure along the likely flow paths of future outbursts34. Future hazard appraisals should focus on catchments in regions that are subject to accommodate some of the highest GLOF hazard potential, such as northwest North America, Patagonia and the Karakoram. Notwithstanding the commensurate impacts from large lake failures, we encourage engineers, policymakers and stakeholders also to consider, in particular, small lakes when planning, designing, constructing and managing infrastructure in catchments with glacier lakes. Remediation work in Peru, Switzerland and Kazakhstan point the way forward as recent lake management has increasingly targeted small lakes to artificially lower their water levels, particularly those close to human settlements72,73,74.
Methods
Updating a global GLOF database
We focused on subaerial lakes on top or at the margins of glaciers within a maximum distance of 5 km from glaciers mapped in the Randolph Glacier Inventory (RGI) V6.0 (ref. 40). These lakes can be dammed by moraines, bedrock sills or the glacier, either laterally (ice-dammed) or on the glacier surface (supraglacial). These water bodies are, unlike subglacial lakes, recognizable in the optical satellite images of the Landsat, Sentinel-2, RapidEye and Planet missions. We excluded all other glacier-fed lakes, such as lakes dammed by landslides, englacial water pockets and lakes below glaciers, including those formed by geothermal activity8. We acknowledge that GLOFs have resulted from melting ice on top of active volcanoes or the rapid drainage of englacial water bodies, particularly in Iceland75 and the European Alps76. However, estimating the size of both subglacial and subaerial lakes using a single consistent approach is not possible because optical satellite imagery cannot detect lakes below glacier surfaces. Detecting subglacial lakes requires fieldwork77 or airborne radar surveys78; however, this was not feasible for the scale of our study area and the study period.
We focused on 13 major glaciated mountain regions that host most of the contemporary ice volume outside polar regions78. These regions adhere to the O2 boundaries from RGI V6.0 (ref. 40); some regions with few reported GLOFs were merged into larger regions. We initially extracted 2,316 GLOFs that occurred between 1990 and 2023 from a global database of reported historic GLOFs37. This database is a collection of GLOFs described in peer-reviewed publications, official reports from governments and authorities, regional and local inventories, and conference abstracts, as well as news and social media content, including videos, blog posts, web articles and newspaper articles. Since the publication of this database in July 2023, more previously unknown GLOFs, particularly in Norway and Alaska, have been reported, which we have incorporated following the proposed reporting protocol described in ref. 37. In addition, we report 567 cases detected through satellite image comparison that have not been previously reported. We exclusively considered GLOFs that have a documented date (at least the year of occurrence) or a time interval of failure, coordinates of the source lake and at least one reference. We note that there is no standard definition of GLOFs with regard to their magnitude, impact intensity or drainage duration. Our catalogue therefore includes all cases where the decrease in lake area and the associated drop in lake level imply volumes and discharges that are high enough to locally raise river levels and potentially cause structural damage or ecological disturbance downstream.
We then validated all reported cases by searching for independent evidence in images of the Landsat (available since 1984), RapidEye (2009–2020), Sentinel-2 (since 2016) and Planet (since 2016) missions. We chose our study period to be completely covered by several overlapping satellite missions that offer high temporal repeat rates between 1 (Planet) and ~16 days (Landsat). In 27% (n = 632) of the previously reported cases, we could not see any traces of GLOFs in satellite images in terms of a fully or partially drained lake or sediment deposition downstream.
There are several possible reasons for this missing evidence. In the coastal mountain ranges of Alaska, Patagonia and Norway as well as monsoon-affected regions in the Himalayas, lakes can be veiled by clouds for months or even years, so that changes in lake size are impossible to detect in optical satellite images. Radar sensors such as Sentinel-1 can penetrate clouds, but data have been available for less than a decade. Ice cover and shadows cast from adjacent mountains onto lakes are another challenge for mapping GLOFs, especially in winter when sun angles and luminosity are low. In Patagonia, the Landsat record has a gap between 1989 and 1997, which widens the detection intervals between the last image before and the first image after a GLOF. In High Mountain Asia, other forms of mass movements such as debris flows or flash floods are often confused with GLOFs79. The Tien Shan Mountains in Kazakhstan and Kyrgyzstan have a rich history of debris flows originating from proglacial moraine complexes without a permanent lake72,80,81, similar to mass flows from water-saturated moraines in the European Alps82. In the Karakoram, we found that some reported outburst floods originated from internal water pockets rather than subaerial lakes83.
The resolution of satellite images might also play a role in the detection of GLOFs. Emmer et al.53 found geomorphic evidence for many dozens of potentially unrecorded outbursts, particularly from very small lakes (<10,000 m2) in the Peruvian Andes. They used GeoEye and WorldView images (pixel resolution <0.5 m), taken mostly only after the event. Therefore, no comparison with the situation before the alleged GLOF is possible. We were unable to find convincing traces for 37 events even when using high-resolution Planet imagery with daily repeat rates. In Alaska, a recent analysis by Rick et al.84 found more than 700 previously unreported GLOFs during our study period using videos composed of Landsat and Sentinel-2 images. We could not verify more than 100 cases in the time window (last image before and first image after drainage) given in that study. However, we added another 220 GLOFs in this region that were not included in this database, but similarly showed a rapid lake drainage in paired satellite images. In the Southern Andes, we filled our inventory with 153 previously unrecorded GLOFs from 17 different ice- and moraine-dammed lakes.
In a few cases, hydrometric stations can track the draining of ice-dammed lakes at hourly resolution and may record several distinct meltwater pulses over a few days or weeks. Examples include lakes dammed by the Mendenhall Glacier in Alaska46 or Koppangsbreen in Norway85. Under unfavourable weather conditions, we could use only one image at the beginning and one at the end of the outburst cycle. In summary, our GLOF detection window, that is, the interval between the last image before and the first image after lake drainage, spans ({32}_{-16}^{+31}) days (median, 25th and 75th percentiles). In 12% of all cases, the observation window was longer than half a year. When GLOFs occur in late autumn or winter, Landsat images are often unavailable due to the low solar elevation, so we had to rely on better conditions in the following year.
To summarize, our validated database comprises reported outbursts from 124 moraine-dammed and 13 bedrock-dammed lakes, as well 1,538 ice-dammed and 12 supraglacial lake failures (Figs. 1 and 2a). This is the largest global sample of reported GLOFs. A previous study by Carrivick and Tweed86 recorded 349 GLOFs between 1990 and 2015, including an unknown number of sub- and englacial lake outbursts. Our updated inventory records 1,106 GLOFs in this period, exceeding their reported GLOF count threefold. It is important to acknowledge that our inventory, although the largest of its kind, is only a sample of the entire population of GLOFs that have occurred during our study period. As for any other natural hazard, a ‘complete’ inventory of GLOFs will remain an unattainable goal. Unless monitored and publicized directly by local residents or scientists, remote sensing, like other hydrological87 or seismological88 methods, will have limits below which GLOFs of particularly low intensity can be detected. In light of such potential biases, it seems plausible that there was no increase in pre-GLOF lake areas during our study period: a positive trend in pre-GLOF lake area would need a systematic omission of smaller GLOFs from our database over time, which is unlikely given the improved resolution and repeat rates of the satellite missions that we describe below.
Mapping burst glacier lakes
We manually mapped the boundaries of all drained lakes using the last available image before and, if available, the first image after the GLOF. We drew on 1,938 Landsat images from three different generations (Thematic Mapper, Enhanced Thematic Mapper and Operational Land Imager, all having 30 m pixel resolution), 412 RapidEye images (6.5 m), 181 Sentinel-2 images (10 m) and 716 Planet images (3 m). To minimize map distortions, we digitized the outlines of the lakes in the local Universal Transverse Mercator projection using QGIS 3.22 software and calculated their areas. The lake area before the outburst is usually easier to determine than the post-GLOF lake area because drained lakes are often covered with icebergs. In these cases, it remains unclear whether there is still water beneath the ice in images following the outburst. We therefore quality-coded the lakes based on a high (78% of all cases) or low (22%) confidence in the mapped lake contour.
We acknowledge that glacier lakes could have grown or shrunk between the last available image and the reported date of the outburst. Lakes may also have partially refilled before the first post-outburst image. Therefore, both the lake area before, and the loss in lake area during, the outburst are always minima. Our digitized lake outlines also contain unavoidable errors because the electromagnetic spectrum within the image bands mixes at the transition from water to land, leading to uncertainties in the mapping. The relative error, that is, a potential under- or overestimation, of the lake area depends on the pixel size, so a higher sensor resolution (for example, for Planet images) results in a smaller relative error of the lake area. In addition, the expected relative errors in lake area also decrease exponentially with increasing lake area for a fixed sensor resolution. A study that mapped lakes from Landsat imagery (30 m pixel resolution)89 found that the relative errors were 7% and 5% for a lake size of 0.5 km2 and 1 km2, respectively. In total, 60% of the lake areas that we mapped from Landsat images were >0.5 km2; 41% of all GLOFs were also mapped from imagery with higher resolution, and thus with lower relative errors in lake area, than Landsat.
Manually digitized lake areas may provide a more consistent indicator of GLOF magnitude than flood volumes or peak discharges derived from empirical scaling relationships. Flood volumes (n = 265) and peak discharges (n = 190) both span about two orders of magnitude for a given lake area before the GLOF (Extended Data Fig. 1a,b). However, only 40% of all lakes in our database drained fully, which may explain some of this variation. Therefore, using the loss in lake area as a predictor may be more appropriate for estimating flood volume or peak discharge. However, the variance in a regression model was not reduced when we instead used the loss in lake area as a predictor of peak discharge or flood volume (Extended Data Fig. 1c,d). One explanation for this scatter could be that other common indicators of flood magnitude also have large, yet unreported, errors. For instance, stream gauges record GLOF discharges at different distances from the flood source. Flood volumes also depend on the sampling interval of the gauging station to integrate over the entire amount of discharge with time. To enhance our work on pre-GLOF lake areas, future work might overlay our mapped lake areas with high-resolution digital elevation models (DEMs) that depict the lake when it is empty. This approach could help to estimate the volume of glacier lakes. Another solution would be to perform bathymetric depth soundings for glacier lakes that have refilled since drainage. However, both approaches are not possible given the extent of our study regions and the number of lakes involved.
Bayesian hierarchical modelling
We used Bayesian hierarchical modelling to include multiple geographical levels in our dataset when estimating trends in pre-GLOF lake area with time. Hierarchical models can handle groups nested within each other and explicitly model their correlation while accommodating variable sample sizes across groups90. This is achieved by specifying joint prior distributions for hyperparameters on both the population level (that is, all data) and the group level (that is, the study regions and individual lakes with repeat outbursts). Hence, groups with fewer data learn from others with more data through the different levels of the hierarchical model, allowing parameter estimates for data-sparse groups to be ‘shrunk’ towards the estimate of the population level91.
We used two separate hierarchical regression models, one for ice-dammed and supraglacial lakes, and one for moraine- and bedrock-dammed lakes. In both cases, we stratified the global sample (that is, the population) according to K regions having five or more reported GLOFs. As ice-dammed lakes can burst repeatedly, we included another hierarchical level in this model for J = {1 … 96} lakes having five or more outbursts. We thus also obtained trends in pre-GLOF lake area for individual ice-dammed lakes, conditioned on the global, regional and local trends in pre-GLOF lake areas.
We specified a Student’s t-distributed likelihood to quantify the probability of observing the data given the parameters of the hierarchical regression model. Using a Student’s t-distribution is beneficial as it is less sensitive to outliers than other distributions such as the normal (Gaussian) distribution91. This is achieved by thicker tails, such that outliers have less influence on the overall shape of the distribution. This robustness produces more reliable estimates, especially when dealing with lakes with very large or small areas before the outburst. The Student’s t-distribution, as parameterized in the software package brms in R (ref. 92), has a mean μ, a positive scale parameter γ and ν degrees of freedom. We modelled the conditional distributions of the area before the GLOF y dependent on year t for supraglacial and ice-dammed lakes as
and for moraine- and bedrock-dammed lakes as
where τ is the likelihood function, yi is the lake area before the GLOF in year ti having n observations. Each observation is part of a region k and, for the case of ice-dam failures, of lake j. The parameters α and β are the intercepts and slopes, respectively, that model a potential linear trend of the mean μ during the study period. We log10-transformed our response variable as the pre-GLOF lake sizes span several orders of magnitude, resulting in high variance between groups. In addition, we standardized the input data (log10y and t) to a mean of 0 and a standard deviation of 1 to improve the approximation of the posterior distribution of the model parameters in brms.
Obtaining these posterior distributions required us to define prior distributions for each (hyper)parameter, which are multiplied by the specified likelihood function. Given the sparse previous quantitative work on trends in pre-GLOF lake area, we set robust, albeit weakly informed, Student’s t-distributed priors on α, β and γ using a mean of 0, variance of 2 and three degrees of freedom. We used a Gamma-distributed prior Γ(2, 0.1) for the degrees of freedom ν with a lower bound of 1, the default prior in brms.
In addition, the hierarchical model framework demands priors on the standard deviations that characterize the uncertainty and variability in the model parameters. The group-level standard deviations ({sigma }_{{alpha }_{k}}) and ({sigma }_{{beta }_{k}}), and in the case of ice-dammed lakes additionally ({sigma }_{{alpha }_{kj}}), ({sigma }_{{beta }_{kj}}), capture this variability by indicating how much the intercepts and slopes deviate from the mean across groups. By contrast, the residual standard deviations show how much the response variable varies around the predictions made by the model on population level (σp), regional level (σr) and, for ice-dammed lakes, also local level (σl). These three parameters measure the amount of unexplained variation in the data that is not explained by the predictor (t) and the group-specific effects. All priors on the standard deviations (({sigma }_{{alpha }_{k}}), ({sigma }_{{beta }_{k}}), ({sigma }_{{alpha }_{kj}}), ({sigma }_{{beta }_{kj}}), σp, σr and σl) follow a half-Student’s t-distribution using a mean of 0.5, variance of 2 and three degrees of freedom. Note that all priors refer to standardized data.
Finally, we obtained the joint posterior distribution for ice-dammed lakes as
and for moraine- and bedrock-dammed lakes as
We used a Hamiltonian sampling algorithm implemented in brms (ref. 91) to approximate the posterior distributions of all model parameters using four parallel Monte Carlo chains with 1,000 warm-up and 3,000 post-warm-up draws each. In both models, the Gelman–Rubin potential scale reduction factor (hat{R}) achieved a value of 1.0, indicating that the Markov chains have converged. After sampling, we re-transformed the parameters to the original scale and determined the posterior trends in lake areas before GLOFs on global (Fig. 3a), regional (Fig. 3c and Extended Data Fig. 2) and local (Extended Data Fig. 3) levels. All posterior distributions are described by their median and an HDI that spans 95% of the central portion of the distribution with the highest probability density (Fig. 3c). We deemed posterior distributions credibly positive or negative if 95% of the probability mass is above or below zero, respectively.
Estimating regional changes in lake size
We compared the change in burst lake areas with the annual change in total lake area in each region. To this end, we compiled all glacier lakes in our study regions from a recent global lake inventory8 generated for the years 1990 and 2020. In this study, all lake outlines were mapped by hand from Landsat and Sentinel-2 images to minimize errors that are frequently present in automated mapping appraisals. We selected all lakes that were within a distance of 5 km from glaciers mapped in RGI V6.0 and assigned each lake to one of our 13 study regions. We obtained the total lake number and area for the two time steps per region, and subsequently derived the total lake area change (km2) and the average rate of change in total lake area per year (% yr−1) in the elapsed time period.
Determining key controls on pre-GLOF lake area for large lakes
From the global glacier lake inventory8, we selected all glacier-fed and ice-dammed lakes (n = 969) that were larger than 1 km2 as of 2020. We then visually assessed five features of each large lake using high-resolution Bing aerial imagery, available via the QuickMapSevices plugin in QGIS V3.22, or satellite imagery in Google Earth Pro V7.3.6.9750 and Planet Explorer.
We distinguished between the two main dam types (ice-dammed and supraglacial lakes versus moraine- and bedrock-dammed lakes) and, in addition, reservoirs for hydropower or freshwater production (Fig. 5a). Many glacier lake inventories include such artificial reservoirs because they can be fed by glacier meltwater and, in some cases, are still in contact with glaciers (Extended Data Fig. 7a). They can be distinguished in satellite imagery by their curved or straight dams composed of earth-, rock- or concrete-fill materials, as well as by bathtub-like rings along the lake margin created by changing water levels. In the same vein, we checked whether the outflow channel is managed through engineered structures such as dykes, open cuts, reinforced paved or concrete dams, or a tunnel through bedrock that leaves the lake at a lower elevation (Fig. 5e and Extended Data Fig. 7a). These remedial measures have been successfully implemented at many glacier lakes in Peru, Switzerland and Norway for flood protection and to locally reduce the GLOF hazard57,73,74 (Extended Data Fig. 7c).
We also used the latest satellite images to estimate whether a lake is currently in contact with a parent glacier (Fig. 5c). Outlines in the RGI, which can be several decades old40, were not suitable for revealing current ice–water interactions. Incidentally, the term ‘glacier contact’ does not refer to the dam itself (every ice-dammed lake would otherwise be a glacier-contact lake). Instead, ‘glacier contact’ describes the case when another side of the lake (apart from the dam) has direct contact with a glacier, which enables further growth of the glacier lake.
For each large lake, we also selected the lake outline in 1990 mapped in ref. 8 to determine how much the lake area changed during our study period. In Fig. 5b, we classify lakes as growing if the lake grew by more than 2.5%, constant if the change in lake area was between −2.5% and 2.5%, and decreasing if the lake area shrank by more than −2.5% between 1990 and 2020.
Another sign of limited lake growth potential is whether a lake has an established outlet (Fig. 5d). We considered outlets to be established if the outflowing stream is deeply incised into the adjoining topography. We observed that streams leaving a lake at low gradients can be many tens of metres wide (Extended Data Fig. 7b), while channels with steeper gradients are often armoured with car-sized boulders, likely remnants of moraine material. In many cases, satellite images even showed run-off in winter, indicating perennial water flow in the outflow channel.
Reporting summary
Further information on research design is available in the Nature Portfolio Reporting Summary linked to this article.

Responses