Quantifying unit ratios in semiconducting copolymers and effect of structural deviations on photovoltaic performance
Introduction
The power conversion efficiency (PCE) of organic photovoltaic (OPV) devices has recently reached 19%1,2, owing to the development of new electron donor and acceptor materials3,4,5. An effective molecular design for improving OPV performance is the coupling of two or more different π-conjugated units with electron donating (D) and electron accepting (A) properties6,7,8,9. For example, donor polymer PM6 has a D-A-D-A repeating structure in the polymer chains10, and molecular acceptor Y6 has a more complicated structure of A-DA′D-A with two different A units11. The molecular design strategy of using D and A units has the advantage that the material properties can be tuned predictably by changing the units. The highest occupied molecular orbital (HOMO) and lowest unoccupied molecular orbital (LUMO) energies can be modulated by the choice of D or A unit12. In addition, the light absorption range of the materials can be extended to long wavelength regions by tuning the electronic structures of the D and A units13.
Although molecular materials, such as Y6, have a defined structure and high purity to provide reproducible performance in OPVs, the semiconducting copolymers suffer from batch-to-batch variation and low reproducibility14. For example, OPVs with different batches of PM6 obtained by repeated synthesis showed a variation of PCE from 14% to 17% in combination with Y615,16. One possible cause of this variation is the different molecular weights across batches17,18,19,20, and another is the variation in the polymer main chain structure. When a side reaction, such as the coupling of the same unit (D-D or A-A)21,22,23, occurs during metal-catalyzed cross-coupling polymerization24,25,26, the D-A unit ratio can deviate from the ideal 1:1 ratio. Recently, non-alternating chain structures in certain copolymers have been observed directly using scanning tunneling microscopy (STM)27,28. These structural variations in semiconducting polymers can affect the electronic structure of the material and the OPV performance21,29. Several studies have reported decreased OPV performance associated with increased homocoupling defects in the donor polymers30. Therefore, a detailed investigation of molecular structure in semiconducting polymers is crucial to understanding batch-to-batch variation and controlling the quality of copolymers as semiconducting materials31.
Several experimental techniques have been used to quantitatively evaluate the molecular structure of semiconducting copolymers. High-temperature NMR has enabled structural analysis of π-conjugated polymers29,32,33,34,35; however, the quantitative accuracy of this method strongly depends on the chemical structure and molecular weight of the polymers36. Although matrix-assisted laser desorption/ionization time-of-flight mass spectrometry (MALDI-TOF-MS) is a powerful tool for detecting the presence of homocoupling in polymers qualitatively22,37, the quantitative accuracy is low. When homocoupling changes the electronic structure of the polymer chain, the homocoupling can be detected by light absorption measurements, but it is difficult to quantify its concentration21. STM enables direct visualization and quantification of structural defects27,28, but its applicability and limitations require further investigation. Each of these methods offers distinct advantages and limitations, with varying effectiveness depending on the polymer type. Combining different analytical methods provides deeper insight into copolymer structures; thus, a wider choice of experimental techniques is desired.
In this study, we demonstrate the quantitative structural analysis of semiconducting copolymers using X-ray photoelectron spectroscopy (XPS) and introduce it as a useful analytical method for examining polymer chain structures. Applications of XPS to semiconducting copolymers have been limited to monitoring polymer degradation38 or estimating the ratio of electron donor and acceptor materials in a mixed film39. To the best of our knowledge, there is no standard method to guarantee the quantification accuracy in XPS for semiconducting polymers. To solve this problem, we propose a new methodology that uses small molecular acceptors as standard materials to confirm the quantitative accuracy of XPS. This calibration method improves the quantification accuracy of the atomic concentration, allowing the evaluation of small variations in unit ratios in the polymer chains. We measure the unit ratios in commercially available high-performance copolymers widely used in OPV research. We also discuss the effect of the ratio on OPV performance and the electronic structure of the polymers by comparing the results of different copolymer batches.
Results and Discussion
Standard materials for XPS analysis of organic semiconductors
In XPS measurements, relative sensitivity factors (RSFs) for each atom are used to convert the number of photoelectrons into atomic concentration because the photoelectron emission yield and the detectivity of the analyzer depend on the target atoms40. Therefore, the accuracy of XPS quantification depends on the accuracy of the RSFs. However, the generic RSFs for the spectrometer may not be optimal for the quantification of organic semiconductors. To calibrate the RSFs for the targeted copolymers, we proposed using Y6 and BTP-eC9 (Fig. 1), which are high-performance electron acceptors in OPVs41, as standard materials. There are three reasons for this choice: they contain C, F, N, O, S, and Cl, which are the major constituents of most organic semiconducting materials; highly purified Y6 and BTP-eC9 are commercially available; and thin, uniform films of these acceptors can be prepared by spin-coating.
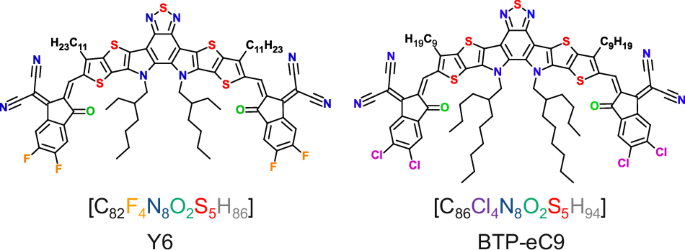
Molecular structures of Y6 and BTP-eC9.
Supplementary Figs. S1 and S2 show the XPS spectra of Y6 and BTP-eC9 pristine films measured under the optimized conditions described in the Experimental section. The absolute errors for each atom from the stoichiometry in the chemical formula were less than 1% with the generic RSFs (Supplementary Tables S2 and S3). Based on these results, the RSFs of each atom were calibrated to increase the accuracy of the following quantitative analysis of the π-conjugated molecules.
Evaluation of atomic concentrations with calibrated RSFs
To confirm the applicability of the calibrated RSFs, we measured the atomic concentrations of a homopolymer, P3HT, and a non-fullerene acceptor (NFA), IT-4F. Table 1 shows the concentrations evaluated with the calibrated RSFs (XPS spectra are shown in Supplementary Figs. S3 and S4). P3HT contained high concentrations of C and S, which were almost perfectly quantified (absolute error <0.1%). For IT-4F, although the atomic concentrations of N, O, F, and S were <4%, the XPS with corrected RSF evaluated them accurately with an absolute error below 0.2%. We compared the absolute error with the generic RSFs and the calibrated RSFs in Supplementary Tables S4 and S5. For both materials, the calibrated RSFs reduced the errors at each atom, indicating that calibration of RSFs with Y6 and BTP-eC9 standards led to higher-accuracy quantitative analysis of other π-conjugated polymers and molecules.
Evaluation of the mixing ratios of the two standard materials
Before quantifying the unit ratio in copolymers, we tested the mixed film of Y6 and BTP-eC9 to determine how small differences in the mixing ratio of the two components could be distinguished. We prepared mixed films of Y6 and BTP-eC9 by spin-coating chloroform solutions with different mixing ratios (spin-coating conditions are summarized in Supplementary Table S1). The XPS spectra are shown in Supplementary Fig. S5.
To quantify the Y6 ratio from the atomic concentration measured by XPS, we calculated the root mean square of the absolute error (RMSE) between the atomic concentrations measured by XPS and the calculated concentrations as
where N is the number of atoms analyzed, concmeasured is the atomic concentration determined by XPS, and conccalc is the theoretical atomic concentration calculated for each Y6 ratio in the film. The theoretical atomic concentrations in the mixed film are calculated as Y6[C82F4N8O2S5]x + BTP-eC9[C86Cl4N8O2S5](1−x), varying from x = 1 (Y6 pristine film) to x = 0 (BTP-eC9 pristine film). Using the concentrations of all atoms rather than selected atoms, such as F and Cl, helps minimize errors in the following estimation of molecular ratios (see more detail in Supplementary Fig. S17). We defined the molecular ratio evaluated by XPS as the point where the RMSE reaches a minimum (indicated by arrows in Fig. 2a). The Y6 ratios in the mixed solution and those evaluated by XPS showed good linearity with a slope of unity, indicating that XPS accurately evaluates the Y6 ratio (Fig. 2b). This analysis can distinguish a mixing ratio difference of about 1% between two components, which is sufficient accuracy for investigating the unit ratios in copolymers.
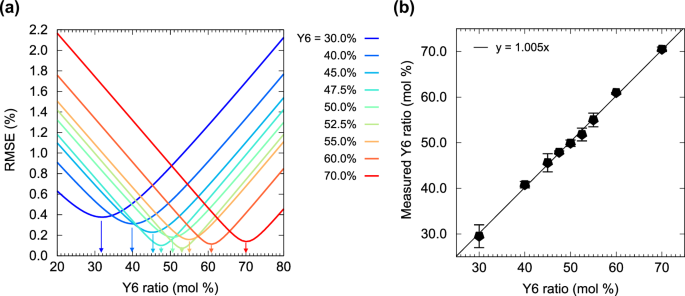
a RMSE between the stoichiometric concentration and the XPS values plotted against the Y6 ratio in the mixed thin films. The bottom of the parabolic curve (indicated by arrows) is the point at which the measured and calculated atomic concentrations are in the best agreement. We define this error minimum point as the ratio evaluated by XPS. b Y6 ratio evaluated by XPS plotted against that in the mixed thin films. The linear relationship between these values indicates that the evaluation of the mixing ratio by XPS is accurate.
Evaluation of monomer unit ratio in copolymers
With the accurate XPS quantification method in hand, we evaluated the unit ratios in the other copolymers, PM6 and D18 (Fig. 3), which are widely used donor polymers for OPVs and are synthesized by a cross-coupling reaction10,42. PM6 and D18 have the same fluorinated D unit, benzodithiophene (BDT), and a different A unit of benzo-[1,2-c:4,5-c′]dithiophene-4,8-dione (BDD) for PM6 and dithieno[3′,2′:3,4;2″,3″:5,6]benzo[1,2-c][1,2,5]thiadiazole (DTBT) for D18. PM6 was purchased from three different suppliers. We prepared pristine thin films of these polymers and evaluated the monomer unit ratios in the polymer chains by using XPS.
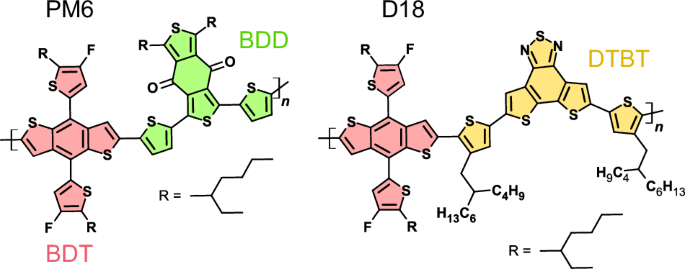
Molecular structures of PM6 and D18 copolymers.
Supplementary Fig. S6 shows the XPS spectra of PM6. The residual error curves plotted against the donor (BDT) unit ratio (Supplementary Fig. S7) showed that some batches differed slightly in the evaluated unit ratios (summarized in Supplementary Table S6) in each measurement. We calculated the average and standard deviation of the evaluation results (Table 2). The BDT unit ratios in PM6 were <50%. The different batches of PM6 had different BDT-BDD unit ratios. In contrast, the BDT unit ratio of D18 was close to the ideal 50% ratio.
The observed deviations in the unit ratios could be attributed to homocoupling defects in the main chain or the effects of symmetric end groups. End-capping reactions involving simple aromatic compounds, such as benzene or thiophene, are unlikely to significantly affect the unit ratio evaluations by XPS because these compounds lack key elements such as F and O. However, symmetric end groups (i.e., polymer chain terminated selectively by either BDT or BDD) can influence the unit ratios observed in XPS, depending on the chain length. To evaluate this, we calculated the impact of symmetric end groups on unit ratios. Figure 4 shows the calculated deviations in unit ratios resulting from the symmetric BDD terminal group. The x-axis represents the total number of units (e.g., A-D-A-D-A as five and A-D-A-D-A-D-A as seven), whereas the y-axis shows the deviation of the A unit ratio from 50%. These values were calculated under the assumption that all the chains have the same terminal group; thus, the values represent the upper limits of the deviation caused by the symmetric terminal group.
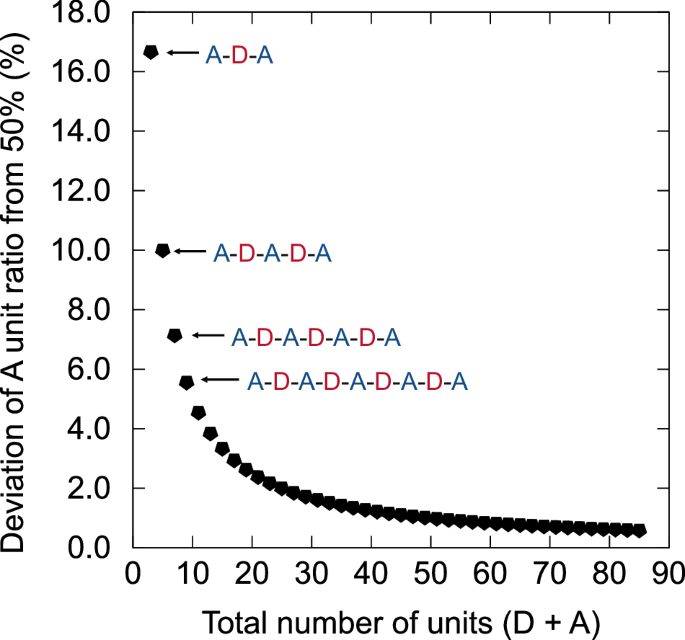
Deviation of the A unit ratio from 50% caused by the symmetrical acceptor terminal group plotted against the total number of units (D + A) in the chain.
For PM6, the mass of a single BDT-BDD repeating unit is 1220, and the number-average molecular weight (Mn) evaluated by size exclusion chromatography (SEC) of PM6-A and PM6-B was 2.1 × 10⁴ g/mol (Supplementary Fig. S8 and Table 2). This corresponds to approximately 34 units per chain, resulting in a BDD excess ratio of around 1.5% due to the symmetric terminal group. This value is smaller than the deviations observed in PM6-A (6.7%) and PM6-B (1.9%). PM6-C (1.3%) has a higher Mn of 3.1 × 10⁴ g/mol, corresponding to around 51 units per chain and a BDD excess ratio of 0.98%. However, considering the potential overestimation of Mn by SEC, as reported for semiflexible π-conjugated polymers27,43, the contribution of symmetric end groups to the unit ratio deviations cannot be completely ruled out. It is likely that the observed deviations in the unit ratios result from a combination of homocoupling defects and symmetric end groups. Complementary methods such as STM imaging should be considered to further elucidate the origin of these deviations.
Validation of unit ratio evaluation using intentionally ratio-altered PM6
To confirm the accuracy of unit ratio evaluation by XPS, we synthesized PM6 polymers with intentionally altered unit ratios deviating from 1:1. PM6 was synthesized using typical Migita–Kosugi–Stille cross-coupling of BDT-Sn and BDD-Br with a Pd(PPh3)4 catalyst10 (Fig. 5a, PM6-synth). Details of the PM6 synthesis are provided in Supporting Information. PM6 with the monomer feed ratio of 1:1 was also synthesized using the opposite monomer combination for the cross-coupling reaction (BDT-Br and BDD-Sn, named PM6-inver). To introduce excess BDD units, we substituted 10 mol% or 5 mol% of the BDT-Sn monomer with the BDD-Sn monomer (Fig. 5b), yielding polymers with an overall monomer unit ratio of BDT and BDD of 45.0:55.0 and 47.5:52.5, respectively, named PM6-BDD5.0% and PM6-BDD2.5%. Similarly, we synthesized PM6-BDT5.0% and PM6-BDT2.5% by substituting 10 mol% and 5 mol% of the BDD-Br monomer with the BDT-Br monomer (Fig. 5c). The molecular weight of these PM6 samples was comparable (Table 3 and Supplementary Fig. S9), suggesting minimal differences in the reactivity of these monomers.
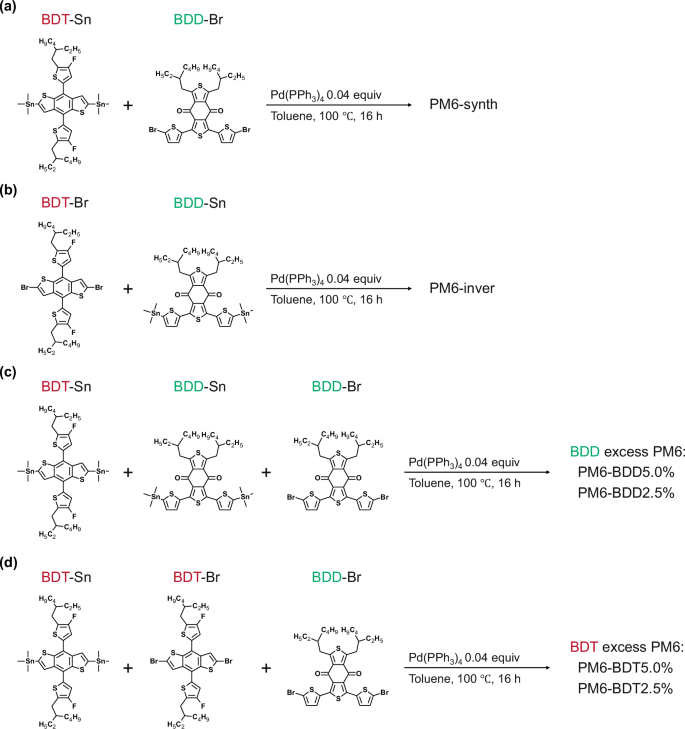
a PM6-synth, b PM6-inver, c PM6 with excess BDD unit, and d PM6 with excess BDT unit.
The unit ratios of these PM6 samples were evaluated by XPS. The results showed that the monomer feed ratio in molar and evaluated unit ratios were closely aligned, with deviations of less than 0.5% (Table 3, XPS spectra, RMSE curves, and unit ratios are in Supplementary Fig. S10 and Supplementary Table S8). The feed ratio of these brominated and stannylated monomers resulted in a nearly quantitative unit ratio deviation in the polymer chain, and XPS accurately detected the small deviation quantitatively. The NMR spectra of these copolymers in solution did not provide information on the unit ratios because of peak broadening (Supplementary Fig. S16), underscoring the utility of the XPS method.
The absorbance of these polymers was measured in chlorobenzene solution (See Supplementary Fig. S11 for details and discussion). As the deviation from the 1:1 unit ratio increased, the absorption onset wavelength shifted. PM6 with excess BDD units showed a red-shifted onset, whereas those with excess BDT units showed a blue-shifted onset. TD-DFT calculations of PM6 oligomers revealed a similar wavelength shift in the absorption peak corresponding to a transition from the ground state to S1, depending on the presence of BDT-BDT or BDD-BDD direct connection in the structures (Supplementary Fig. S11d). These slight changes in the absorption onset indicate that the deviations in unit ratios alter the electronic structure of the polymers.
Solar cells using PM6 with different unit ratios
We fabricated bulk heterojunction (BHJ) OPV devices using PM6 with L8BO as the acceptor (Fig. 6a). Figures 6b, c show the current density–voltage (J–V) characteristics under simulated AM1.5 (100 mW cm−2) sunlight irradiation. The thickness of the BHJ layers was about 100 nm. The device performance is summarized in Table 4. The deviation of the unit ratio in PM6 did not substantially change the film surface topology of the BHJ layers, as shown in the atomic force microscopy (AFM) topographic images (Supplementary Fig. S12).
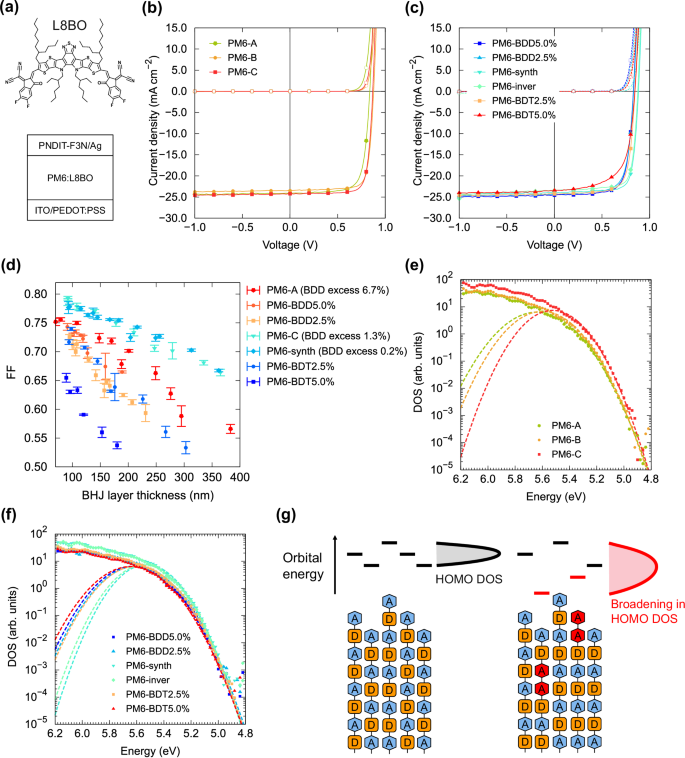
a Molecular structure of L8BO NFA and device structure of BHJ OPVs. b J–V characteristics of PM6 BHJ devices with different commercially available PM6 under AM1.5 100 mW/cm2 irradiation and dark. c J–V characteristics of synthesized PM6 with a deviation of the unit ratio. d FF of PM6 OPVs with different thicknesses. e HOMO DOS of PM6-A, B, and C pristine films determined by high-sensitivity PYS. The dashed lines represent Gaussian functions fitted to the DOS edge. f HOMO DOS of synthesized PM6 with different unit ratio deviations. g Schematics of the variation of the orbital energy of PM6 polymer chains with (red) and without (black) deviation of the unit ratios and the resulting shape of the HOMO DOS.
For the commercially purchased PM6 (PM6-A, B, and C), the samples with the larger BDD unit excess showed lower PCE, primarily due to a reduction in fill factor (FF) and open-circuit voltage (VOC). The external and internal quantum efficiency of these OPVs were nearly identical; consequently, the JSC values were also similar (Supplementary Fig. S13). Because the molecular weights of PM6 batches measured by SEC were similar (Supplementary Fig. S8 and Table 2), the molecular weight difference did not account for the PCE variations. Synthesized PM6 samples with altered unit ratios showed the same trend of deviation from a 1:1 ratio causing low FF and VOC, consistent with previous works discussing the reduction of OPV performance by homocoupling defects; OPV devices using PM6:Y644, DTS(FBBTh2)2:PC71BM31, PDTSQxff:PC71BM30, and PDPPTPT:PC71BM21 showed decreased FF and VOC with higher homocoupling concentrations.
The effect of unit ratio deviation on FF was more pronounced in thicker BHJ layers (Fig. 6d). When the active layer thickness was varied between 80 and 400 nm, the FF of OPVs showed a monotonic decrease with increasing thickness, likely due to insufficient charge transport in thick BHJ films. Notably, PM6-synth and PM6-C, which had smaller unit ratio deviations, showed high FF in thin films and maintained higher FF with increasing thickness compared with other films. In contrast, other PM6 samples with larger deviations showed more substantial FF decreases in thicker films. These findings suggest that deviation in unit ratios impairs the charge transport properties of the mixed BHJ films, leading to diminished performance in thicker films.
Finally, we used high-sensitivity photoemission yield spectroscopy (PYS) to evaluate the electronic structure of these polymers45,46, focusing on FF and VOC from an energetics perspective. Figure 6e, f show the HOMO density of states (DOS) of the pristine PM6 films on a semi-logarithmic scale (linear spectra are shown in Supplementary Fig. S14). The dashed lines represent Gaussian fits to the DOS edge. We defined the energy of the HOMO (EHOMO) as EPT − 2σ, where EPT is the peak energy and σ the variance of the fitted Gaussian. EHOMO and DOS width σ are listed in Table 4. PM6-synth and PM6-C, with smaller unit ratio deviations, had narrower HOMO DOS widths, whereas the DOS widths broadened with increasing deviation in other PM6 samples. Structural variation in the polymer chains can add variability to the electronic structure, leading to a broader overall HOMO DOS (Fig. 6g), which impedes hole transport in the polymer45, thereby reducing FF47.
EHOMO of PM6 with a deviating unit ratio was slightly deeper than that of PM6-synth or PM6-C; thus, energetics would predict an increase in VOC with greater deviation. However, our results showed the opposite; PM6 samples with unit ratio deviations exhibited lower VOC. Additionally, VOC for PM6 samples with unit ratio deviations depended on BHJ layer thickness (Supplementary Fig. S15a). Simple energetics based on EHOMO do not explain the thickness-dependent VOC; thus, charge carrier recombination kinetics must be considered. The dark ideality factors (nid) of OPVs using PM6 with smaller unit ratio deviations (PM6-synth and PM6-C) were lower than those in other samples, indicating that recombination was suppressed more effectively in these cells (Supplementary Fig. S15b). Therefore, unit ratio deviations and the resulting broadened DOS likely hinder charge transport and reduce charge density near open-circuit conditions, leading to decreases in both FF and VOC.
Conclusions
We quantified the ratio of D and A units in copolymers using XPS, achieving improved quantification accuracy through calibrating relative sensitivity factors with Y6 and BTP-eC9 as standards. Our analysis revealed that the commercially available PM6 samples exhibit deviations from the ideal 1:1 unit ratio, which may contribute to batch-to-batch variations in OPV performance. These unit ratio deviations are related to energetic disorder in the semiconducting polymers, affecting the charge collection process in OPVs. Although this XPS method requires specific atoms in each unit, it offers valuable insights into the structural characteristics of polymer chains. Furthermore, integrating XPS with other complementary techniques, such as NMR, STM, and MALDI-TOF MS, will enable a more comprehensive analysis of polymer chains, deepening our understanding of semiconducting polymers.
Methods
Materials
Commercially available PM6 samples were purchased from 1-Material, Ossila, and Solarmer. D18 was purchased from Derthon. PM6 was also synthesized in-house according to the procedure detailed in the Supporting Information. The materials were used as received, except for PM6-C, which was reprecipitated by passing it through a 0.45 μm PTFE filter before use to remove undissolved particles. Regioregular P3HT was purchased from Rieke Metals (RMI-001EE, Mn = 2.3 × 10⁴ g/mol, polydispersity index 2.2, which was determined by the high-temperature SEC).
XPS measurement
XPS was performed on a photoelectron spectroscopy system (PHI 5000 Versa Probe II, ULVAC-PHI). Monochromated Al Kα (1486.6 eV) radiation with an operating power of 25 W was used for all XPS measurements. The diameter of the analyzed area was 100 μm. A pass energy of 46.95 eV and energy steps of 0.050 eV were used for measuring each atomic element. The take-off angle was 45° to the sample substrate. The sample films were spin-coated on a glass indium tin oxide (ITO) substrate coated with a 35 nm PEDOT:PSS layer. The recorded signals were accumulated twice for the C 1 s and S 2p spectra and eight times for other elements. Twelve points were measured, and the spectra were averaged. Averaging many spectra obtained in a short X-ray irradiation time at different measurement points was a better method than accumulating spectra at the same point over a long time. A long measurement time ( ~ 2 h) damaged the sample, thereby changing the shape of the XPS spectra. Thus, we finished the measurement in each position within 20 min. The background levels were determined by the Shirley method48,49, and the signal areas for each atom were calculated numerically.
Fabrication of OPV devices
A glass substrate with a 50 nm patterned ITO electrode was cleaned by sequential ultrasonic cleaning in detergent solution, water, 2-propanol, and acetone, followed by O2 plasma treatment. A 50 nm Au supporting electrode was formed at the edge of the ITO pattern to reduce the series resistance. The ITO surface was covered with an approximately 35-nm-thick PEDOT:PSS (AI 4083) buffer layer. After drying at 150 °C, the substrates were transferred to an N2-filled glove box, and the BHJ layer was spin-coated onto the PEDOT layer. The spin-coating conditions of the BHJ layers are summarized in Supplementary Table S1. After thermal annealing at 100 °C for 10 min, 0.5 mg/mL PNDIT-F3N solution in 2,2,2-trifluoroethanol was spin-coated (1500 rpm) onto the BHJ layer. Ag electrodes (100 nm) were deposited by thermal evaporation through a metal mask under a high vacuum ( ~ 10−4 Pa). All samples were encapsulated with a glass cap and UV-curable resin in a dry N2-filled glove box.
J–V characteristics
The J–V characteristics of the devices were measured under simulated solar illumination (AM 1.5, 100 mW/cm2) from a solar simulator with a 150 W Xe lamp (PEC-L11, Peccell Technologies). The light intensity was calibrated using a standard silicon solar cell (BS520, Bunkoh-Keiki). The active area of each device was defined using an 8.9 mm2 metal mask.
EQE measurements
The EQE of each device was measured using monochromatic light (SM-250F, Bunkoh-Keiki). The light intensity was calibrated using standard Si (S1337-1010BQ, Bunkoh-Keiki) and InGaAs (G12180-050A, Bunkoh-Keiki) photodetectors.
Optical simulation
Optical simulations of the BHJ OPV devices were performed using custom code written in Python based on the previously reported transfer matrix model50,51. The optical constant of Ag was taken from the data sheets. The optical constants of the glass substrate, ITO, PEDOT:PSS, PNDIT-F3N, and BHJ layer were evaluated by VASE and used for the simulations. The light absorption in the BHJ layer was numerically calculated and used to evaluate the IQE spectra.
AFM
AFM images were obtained using a scanning probe microscope (5400, Agilent Technologies) in tapping mode.
VASE measurements
Ellipsometry measurements were performed using a spectroscopic ellipsometer (RC2, J.A. Woollam). Thin films of organic materials were deposited on a quartz substrate. The reflected spectra at angles from 45° to 75°, the transmittance at normal incidence of the films, and the transmitted spectra at angles from 0° to 50° were measured and used for analysis with the biaxial anisotropic model. Gaussian functions were used to model each oscillation, and it was assumed that the width and energy of the Gaussian were the same in the in-plane and out-of-plane directions (only the intensity of the oscillation differed in these directions).
Light absorption measurements
The light absorption in chlorobenzene solution was measured using a UV-Vis spectrophotometer (V-670, JASCO). A quartz cell with a 10 mm light path was used.
PYS measurements
PYS was performed with a photoemission yield spectrometer (AC-2, Riken Keiki) equipped with a monochromated D2 lamp in air. The experimental setup and the procedure for the DOS evaluation were the same as those described in our previous work45,46. The yield spectrum was subjected to Savitzky–Golay filtering before differentiation to eliminate the influence of noise.
High-temperature SEC measurements
SEC measurement was performed with a high-temperature gel permeation chromatography system (HLC-8321GPC/HT, TOSOH) with o-dichlorobenzene as the eluent at 140 °C. The flow rate and injected volume were 1.0 mL/min and 300 μL, respectively. The molar mass was calibrated using polystyrene standards.


Responses