Real-time observation of coherent spin wave handedness

Introduction
Antiferromagnets, distinguished from ferromagnets by an alternating ordering of opposite spins, hold significant promise in magnonics1,2,3,4, offering higher operating frequencies and resistance to stray fields5,6,7,8,9,10,11. The dual-handedness inherent in antiferromagnetic (AFM) magnonics5,6,7,8 stands in contrast to the inherently right-handed nature of ferromagnets12,13. The dual-handed characteristic of AFM magnon modes has recently attracted attention, especially for its potential to offer novel functionalities in spintronics devices. For instance, the AFM magnons in hematite systems represent recent advances in this field14,15,16. Each magnon mode, characterized by unique handedness, can carry distinct spin angular momenta, thereby facilitating spin-selective transport properties17,18.
There are two possible routes toward AFM spin waves with handedness: (i) by using AFMs with net magnetic moment M = 0 and angular momentum L = 0 or (ii) by adopting ferrimagnets with net M ≠ 0 but angular momentum L = 0. However, direct probing of the dual-handedness of the AFM spin waves remains a formidable challenge. This is mainly due to their energy degeneracy13 and high-frequency characteristics, complicating both the observation and analysis. Applying an external magnetic field splits these chiral AFM spin waves into two non-degenerate energies19. Nonetheless, the intrinsic nature of these spin waves can also be affected by external magnetic fields, necessitating a non-destructive probe for the electrodynamic signals induced by spin waves. Moreover, the majority of research on AFM magnons has been confined to indirect approaches, such as electrical measurements and relatively low-frequency spin dynamics. This has resulted in limitations and ambiguities in addressing the fundamentals of high-frequency AFM spin waves.
Light-magnon coupling results in the emission of an electromagnetic field by spin waves, and its real-time monitoring provides insights into spin wave dynamics in a non-destructive manner20,21,22,23,24,25. Spin waves, which are collective motions of spins on the lattice that can be excited by several means including light, particularly AFM spin waves coupled with terahertz (THz) light. This light-induced excitation is naturally succeeded by a relaxation process, accompanied by the emission of a THz electromagnetic field. The electric field component of the time-varying magnon emission, in the coherent state, is captured by a THz detector with a time delay stage. The detected THz magnon emission signal directly mirrors the dynamic precession of the spin wave, facilitating real-time monitoring.
Results
As depicted in Fig. 1, the key advantage is the access to the time domain, allowing for the direct differentiation of handedness based on the winding direction in the temporal magnon emission profiles. The magnon emission signal, ETHz,emission (t), is proportional to ∂2M(t)/∂t2 so that ETHz,emission (t) ∝ –sin (ωmagt) when M (t) ∝ sin (ωmagt). Therefore, the emission of +sin(ωmagt) for the right-handed spin wave and that of –sin (ωmagt) for the left-handed spin wave in the coherent state. The principle works better for ferrimagnets with net M ≠ 0 but L = 0, rather than for antiferromagnets with net M = 0 (refs. 26,27,28). Although energetics cannot distinguish right and left-handedness due to the degeneracy that cannot be unfolded without the application of an external magnetic field, the Fourier counterpart (i.e., temporal access) proves remarkably sensitive to the winding direction of spin wave precession, thus clearly differentiating handedness. Crucially, the phase information of spin precession in the time domain makes the intrinsic handedness of AFM spin waves distinctly observable, marking a sharp contrast to previous works that primarily focused on magnon spectral intensity in the frequency domain.

a, b Distinguishable magnon handedness through magnon emission signal in time-domain. Schematics of right-handed (χ = +1) magnon and left-handed (χ = –1) magnon (left panels) show the precession of magnetic moments (black arrows). The handedness (χ) is defined by precession direction: +ωmagt (red arrow) for the right-handed magnon while –ωmagt (blue arrow) for the right-handed magnon. Here, H0, ωmag, and t are the equilibrium magnetization direction, angular frequency of magnon mode, and time. The resulting magnon emission signal, which is a measurable quantity, provides information on magnon handedness (right panels). c In comparison, the magnon handedness is non-separable in the frequency domain due to their energy degeneracy. Only without applying the external magnetic field, the chiral magnons cannot be separable in energy.
Additional advantages of time-domain experiments are outlined below. First, real-time observation allows us to observe the coherence dynamics of the spin wave. Second, the dynamic processes of THz electric field absorption and emission are temporally separable (Fig. 2a). Through control of the time delay, magnon absorption and magnon emission are exclusively measured, allowing for a direct comparison of both absorption and emission spectra. Third, apart from the detection of magnon emission signals, spectral analysis via Fourier transform of the time-domain signal facilitates the precise determination of critical temperatures (Fig. 2c). The exploration of magnon handedness is impossible without a clear identification of the angular momentum compensation temperature, emphasizing the value of time-domain detection of magnon handedness. Fourth, the recursive process of Fourier transformation and correction, followed by inverse Fourier transformation, eliminates inevitable background effects (Fig. 3). These advantages collaboratively enable the accurate, reliable, and reproducible acquisition of magnon emission signals and magnon handedness (Fig. 4).
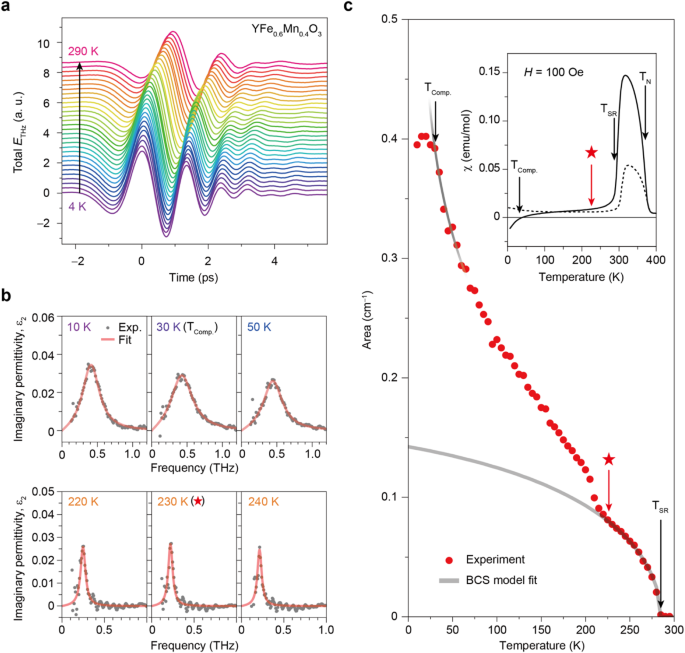
a Total ETHz, time signals of YFe0.6Mn0.4O3 with temperature variation from 4 K to 290 K. b Temperature-dependent imaginary permittivity (ε2) of magnon mode. The experimental data (gray circles) are fitted by the Lorentz model (red lines). TComp. is a magnetic compensation temperature where net M = 0 and ★ ~230 K is another critical temperature later revealed as angular momentum compensation temperature. c The integration area of ε2 spectra. The integration area and magnetic susceptibility show three critical temperatures: Spin reorientation temperature (TSR), Magnetic compensation temperature (TComp.) and new transition temperature (★ ~230 K).
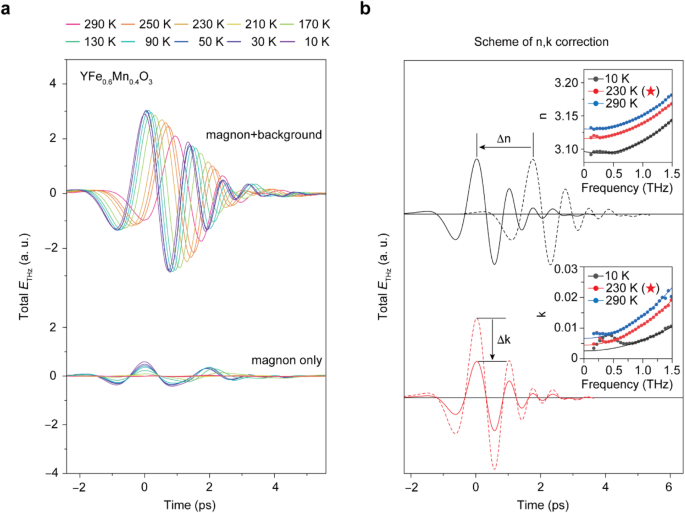
a Original and background-corrected terehertz time signals over temperatures from 290 K to 10 K for YFe0.6Mn0.4O3. b Principle for correcting the time-domain signal. The difference in the refractive index (inset) at distinct temperatures should be corrected to precisely acquire the electrodynamics of magnon including time zero, periodicity, and amplitude. The phase (or time position) is shifted by a refractive index difference (Δn) and the amplitude is reduced by an extinction coefficient difference (Δk).
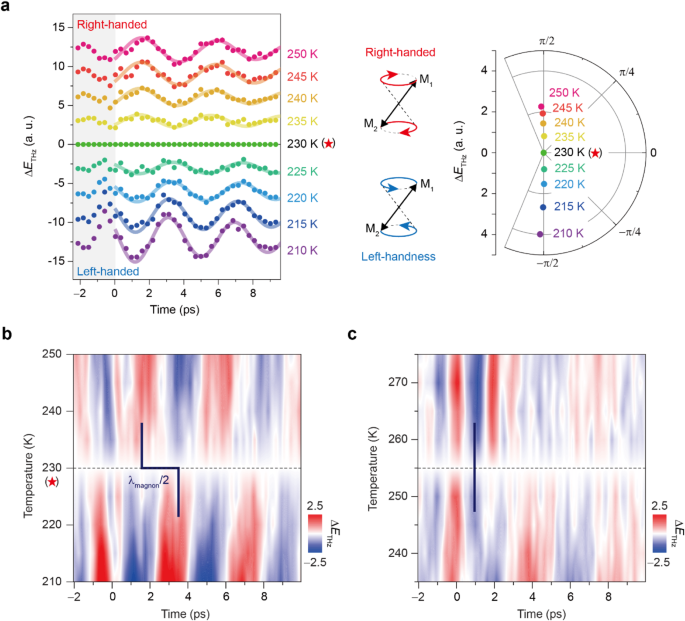
a Magnon emission signal at various temperatures including angular momentum compensation temperature (★ = 230 K). ΔETHz is a relative signal at the temperature subtracted by the signal at ★ = 230 K. Polar plot of ΔETHz in the right panel. The radius is the amplitude of ΔETHz and the angle is the phase of ΔETHz. The opposite phase of π/2 and –π/2 presents the opposite handedness of magnon. b Mapping image of temperature-dependent ΔETHz subtracted by the signal at ★ = 230 K. Magnon handedness flips across ★ = 230 K and the phase change corresponds to λmagnon/2. c Mapping image of temperature-dependent ΔETHz subtracted by the signal at another temperature T = 255 K, showing no handedness flip.
Orthoferrite YFeO3, a canted antiferromagnet (AFM) below Néel temperature of TN = 645 K, transitions to a ferrimagnet at low temperatures when doped with Mn3+ (refs. 29,30,31,32). The distinct magnetic moments of Fe3+ (MFe ~5.92 μB, where μB is Bohr magneton) and Mn3+ (MMn ~4.89 μB) result in zero net magnetization at a specific temperature (TComp.), a phenomenon known as magnetic compensation. Between TN and TComp., angular momentum compensation temperature (★) is present for Mn-doped YFeO3 (YFe0.6Mn0.4O3), providing a suitable playground to explore chiral spin waves in the AFM state. This material offers dual-handedness at angular momentum compensation temperature and handedness reversal from right- to left-handedness across the angular momentum compensation temperature. The strategy for preparing the material system is largely similar to recent works5,6,7,26,27,28 (see Supplementary Information Fig. S1 and Table S1 for the details of our sample preparation).
Note that the parent compound YFeO3, a canted AFM due to Dzyaloshinskii-Moriya interaction33,34, has two characteristic spin waves of a canted AFM, called quasi-AFM and quasi-ferromagnetic modes in the THz spectral range23,24,25. However, YFe0.6Mn0.4O3 below spin re-orientation temperature (TSR) becomes collinear AFM from canted AFM but with two distinct magnetic moments, providing only a ferrimagnetic spin wave that becomes an AFM spin wave at angular momentum compensation temperature (★). We mention that during the excitation of spin waves, no external magnetic field is applied, and consequently, the magnetic moment is not saturated.
Through THz spectral analysis, we distinctly identify the critical temperatures of YFe0.6Mn0.4O3. Initially, we record the transmitted total THz time signal (Total ETHz) of YFe0.6Mn0.4O3 while cooling from 290 K to 4 K (Fig. 2a). The pulsed THz signals progressively shift to earlier time positions with decreasing temperature, indicating a reduction in refractive index (n). Upon Fourier transforming Total ETHz, we obtain the complex transmittance T = ∣T∣eiΦ where ∣T∣ is the transmission amplitude and Φ is the transmission phase. We then calculate the complex permittivity through algebraic relationships. To illustrate THz magnon absorption, we extract the imaginary part of the dielectric constant (ε2) and fit the magnon peak with a Lorentz model (Fig. 2b, see Supplementary Information Table S2 for fitting parameters). The magnetic field dependence validates that the THz absorption peak is attributed to the magnon. (Supplementary Information Fig. S2).
Subsequently, we plot the spectral weight (area) of the absorption peak, proportional to magnon density in Fig. 2c. Its temperature dependence reveals three critical temperatures. The spin reorientation temperature (TSR) is determined by Bardeen-Cooper-Schrieffer (BCS)-type model fitting, showing consistency with our magnetic susceptibility data (χ, inset of Fig. 2c). Note that the magnetic transition adheres to the BCS-type model as well as the power law in mean-field theory (area ∝ (1 – T/Tc)β), providing the magnetic transition temperatures. However, we opt for the BCS model to delineate the spectral area across the temperature range, inclusive of the saturation value. We further extract the magnetic compensation temperature (TComp.) from the spectral analysis, where the area becomes deviated from the trend (black line in Fig. 2c), and the value is more or less the same as TComp. from magnetic susceptibility where χ = 0. Such consistent results with the literature demonstrate the reliability of the spectral analysis for assigning the magnetic phases of this material35,36.
Interestingly, an unknown critical temperature (★) around 230 K, later identified as the angular momentum compensation temperature, displays a significant increase in spectral weight, signifying a sudden rise in magnon density. This criticality is also evident in the increase at around ★ in the magnon coherence time (Supplementary Information Fig. S3), extracted from the broadening parameter of the Lorentzian model fitting. The accurate determination of ★ ~230 K is crucial for tracking the handedness of spin waves, which has been extremely challenging due to the lack of time-domain accessibility.
Up to this point, we have presented the absorption of the incident THz field by spin waves, exclusively detectable through our time-domain measurements. To accurately capture the subsequent emission by spin waves, we must establish the electrodynamic parameters of spin waves, including time zero, and the period and amplitude of the magnon emission. Care must be taken during the extraction of the spin wave signal, as the refractive index (n) and extinction coefficient (k) have the potential to distort the electrodynamic parameters of spin waves. However, this subtle problem can be effectively addressed by compensating for the background n and k.
As seen in Fig. 3a, the transmitted THz time signal comprises both the magnon emission signal with the direct transmission signal at the early time. We calculate the optical constants n and k, as shown in the inset of Fig. 3b, by Fourier-transforming the direct transmission signal. This is achieved by excluding the magnon emission signal through a proper windowing process (or apodization process). The background n and k values are fitted in the frequency domain using a second-order polynomial function and then subtracted from the entire spectra. Subsequently, we obtain the magnon emission signal without the background signal in the time domain through the inverse FFT process (see Supplementary Information Fig. S4 for a direct comparison of the magnon emission signal with the background signal). This FFT and IFFT recursion process allows us to correct the artifact time delay and peak reduction. Presenting the characteristic absorption and emission of spin waves without background effects (the bottom of Fig. 3a) is again difficult without introducing time-domain experiments.
Following this thorough analysis, we now possess the pure emission signal of spin waves in YFe0.6Mn0.4O3. The results lead to an intriguing conclusion: the emission spectrum is nearly compensated at ★ ~230 K (Supplementary Information Fig. S5), indicating a balanced population of right- and left-handed spin waves. This scenario differs from the dominance of right-handed (left-handed) spin waves at T > ★ (T < ★). Building on this observation, we can explore the electrodynamics of spin waves in the time domain with ΔETHz that is obtained by subtracting the magnon emission signal at various T from that at ★ ~230 K for clarity.
The time-domain coherent magnon emissions are observed at various T ranging from 210 K to 250 K, including the angular momentum compensation temperature (★ ~230 K) (Fig. 4a). The coherent magnon emission signal exhibits a periodic (~4 ps) oscillation over time, aligning consistently with its frequency in the spectrum (Fig. 2b). This oscillation stems from the precession of the spin wave excited at quantized magnon energy by the incident THz field, causing the emission signal to be delayed in time relative to the excitation time (at 0 ps where the transmission signal reaches a peak). Given that the THz wave typically has a duration of approximately 1−2 ps, the signal for magnon emission begins around −2 ps, originating from the pulse tail during the early stage. Upon examining the dynamics at different temperatures, we observe that the oscillation signals are well established after 3 ps and can be adequately described by a single-damped oscillator model (solid lines in Fig. 4a, see Supplementary Information Table S3 for fitting parameters). However, before 3 ps, the emission signal appears to slightly deviate from the oscillator model fitting, suggesting a time delay in the transient dynamics of magnon, occurring after excitation and before precession.
Importantly, we observe a reversal of magnon handedness across the angular momentum compensation temperature (★ ~230 K), demonstrating the chiral AFM spin waves in magnets. The ΔETHz signals, obtained by subtracting the magnon emission signal at T from that at ★ ~230 K, clearly exhibit a phase flip. It is noteworthy that the ΔETHz signal is consistently periodic over time, and its intensity gradually increases as the temperature deviates from ★ ~230 K, validating that this analysis is physically meaningful. Above ★ ~230 K, the magnon emission signals follow a counterclockwise rotation initiated from the right x-axis and therefore set by right-handed magnon by convention in Fig. 1a. In contrast, below ★ ~230 K, the magnon emission signals follow clockwise rotation and therefore set by left-handed magnon, revealing the time-reversal counterpart of right-handed magnon. Since the magnetic compensation temperature is far away from ★ ~230 K, this phase flip in ΔETHz must be relevant to the angular momentum compensation, as expected.
To clarify the handedness of the magnon, we present ΔETHz with phase information in a polar coordinate (right panel in Fig. 4a). In this representation, the radius is the amplitude of ΔETHz while the angle reflects the phase of ΔETHz. Above ★ ~230 K, the phase of the magnon is close to +π/2, while below ★ ~230 K, the phase suddenly flips to –π/2. The step-like change of phases indicates a sudden flip in angular momentum. In terms of amplitude, ΔETHz gradually increases as the temperature differs from ★ ~230 K, which is consistent with the V-shaped emission spectrum with a minimum value at ★ ~230 K (Supplementary Information Fig. S5). Without the external magnetic field, this observation of chiral spin waves can be a noticeable achievement in the relevant field.
Figure 4b displays the mapping image for the temperature-dependent ΔETHz subtracted from the signal at ★ ~230 K (dashed line in Fig. 4b), in comparison with that subtracted from the signal at another temperature, specifically at 255 K (dashed line in Fig. 4c). The phase of ΔETHz (represented by red color for a positive sign and blue color for a negative sign) directly captures the reversal of magnon handedness. In ΔETHz subtracted from the signal at ★ ~230 K, π phase difference between them is identified. The time positions of maximum signals are different approximately with 2 ps, which is exactly matched with a half wavelength of the magnon (λ/2) (Fig. 4b). While, in ΔETHz subtracted from the signal at 255 K, there is no change of phase at around time (~4 ps) of the maximum signal (Fig. 4c). Additionally, the emission profiles show a significant change in the oscillation frequency. This physically nonsensical result implies that the temperature of 255 K is not the angular momentum compensation temperature, and the incorrect subtraction leads to interference due to the mixing of right- and left-handed magnon emission signals.
In addition to accessing handedness in the time domain, observing chiral spin waves in AFM frequencies (i.e., the THz regime) could provide insights into AFM magnonics. Furthermore, evidence for the AFM nature of the chiral spin waves can be found in the continuous transition of magnon emission, along with the phase transition from (canted) AFM to ferrimagnetic states, as shown in Fig. 5a. The corresponding phase diagram of YFe0.6Mn0.4O3 is summarized in Fig. 5b in terms of the spin wave. Although not shown here, we also verify the angular momentum compensation temperature and handedness flip across temperatures in other Mn-doped YFeO3, namely, YFe0.8Mn0.2O3 and YFe0.7Mn0.3O3.
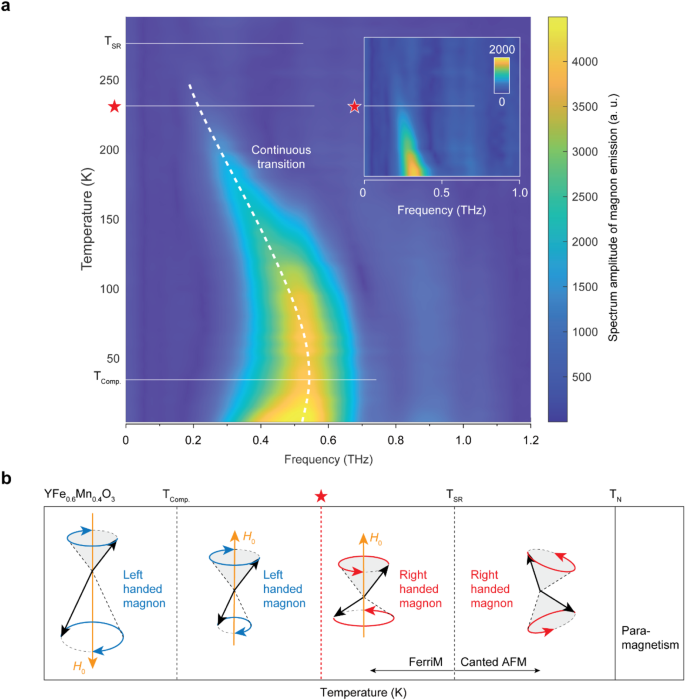
a Magnon emission spectra with temperature variation from 290 K to 4 K. The magnon mode frequency (white dashed line) shows the continuous change over the temperatures covering spin reorientation (TSR), angular momentum compensation (★ = 230 K), and magnetic compensation (TComp.). Inset presents the magnified image near ★ = 230 K. b Schematic phase diagram of YFe0.6Mn0.4O3 in terms of the spin wave.
Discussion
This work enhances our understanding of chiral AFM spin waves and their handedness reversal. The emission phase flip occurs radically, which can be explained with the classical picture employing the angular momentum vector and its reversal. However, the gradual increase (Fig. 4a) and saturation (Supplementary Information Fig. S5) of emission intensity rather require a quantum-mechanical picture where the probability density of the magnon wave function governs. The absence of magnon emission at ★ ~230 K can be described by the cancellation of emission signals out of phase arising from right- and left-handed magnons. Deviated from ★ ~230 K, the emission signal originates from the imbalanced emission signals from right- and left-handed magnons. The combination of time-domain accessibility and quantum mechanical capability allows us to realize magnon-based quantum computing without suffering from Joule heating, distinct from charge-based electronic devices.
Without incorporating time-domain experiments, the accurate determination of critical temperatures and the direct observation of handedness from phase winding should be challenging. In particular, more attention to phase-sensitive time-domain measurements can lead to a breakthrough in the research of coherent chiral magnonics for quantum information.
Methods
Terahertz spectroscopy
Terahertz (THz) time-domain spectroscopy was conducted on a Teraview TPS3000 (Teraview Ltd., UK) over the frequency range of 0.1–3 THz with varying temperatures over the range of 4–300 K by a helium-free optical cryostat (Cryostation, Montana Instruments, Ltd., USA). All measurements were carried out in a vacuum to remove the water-vapor absorption. The samples were attached to a holder with a 3 mm hole by using silver paste. The THz measurement yielded waveforms of electric fields in the time domain, and these were converted into complex-valued functions in the frequency domain, through the fast Fourier transform (FFT).
Sample preparation
Polycrystalline YFe1-xMnxO3 (x = 0–0.45) compounds were synthesized by a solid-state reaction method. A stoichiometric mixture of Y2O3 (99.98% Alfa Aesar), Fe2O3 (99.998% Alfa Aesar), and MnO2 (99.997% Alfa Aesar) powders was ground by using a pestle in a corundum mortar, followed by pelletizing and calcining at 1100 °C for 5 h. The calcined pellet was reground and sintered at 1200 °C for 12 h. The compound was finely reground and then sintered at 1300 °C for 30 h and cooled to room temperature at a rate of 100 °C/h. The crystallographic structure of the YFe1-xMnxO3 samples was confirmed by using an X-ray diffractometer (Ultima IV, Rigaku) with Cu-Kα radiation. The temperature and magnetic field dependences of magnetic susceptibility were examined by a vibrating sample magnetometer for temperatures over 2–300 K and magnetic fields over −9 T–9 T with a physical properties measurement system (PPMS, Quantum Design, Inc.).
For our terahertz measurements, the polycrystalline specimen of YFe0.6Mn0.4O3 was pelletized into a disk shape with a diameter of 25 mm and a height of 10 mm. The sample roughness is significantly smaller than the long wavelength (300 µm−1 THz) of the THz field, effectively minimizing the potential for artifacts arising from surface scattering. The surface area of the pellet was large enough for the terahertz measurements. The crystallographic structure and absence of a second phase were checked by the Rietveld refinement using the FullProf program for the powder X-ray diffraction data (Supplementary Information Fig. S1a). The data were obtained with a Rigaku D/Max 2500 powder X-ray diffractometer using Cu-Kα radiation. The result suggests that the YFe0.6Mn0.4O3 crystallizes in an orthorhombic perovskite with the Pnma space group. The lattice constants are found to be a = 5.6704 Å, b = 7.5140 Å, and c = 5.2680 Å with the reliability factor, ({chi}^{2}) = 3.66. Further details of crystallographic data are summarized in Supplementary Information Table S1. The crystallographic structure of YFe0.6Mn0.4O3, in which Fe3+/Mn3+ ions are located in oxygen octahedra, was constructed by the X-ray refinement result (Supplementary Information Fig. S1b). Supplementary Information Fig. S1c shows the magnetic (H)-field dependence of magnetization (M) taken at 340 K. Its hysteretic behavior with the presence of a small remanent magnetization indicates a canted antiferromagnetic order of Fe3+/Mn3+ moments at 340 K.
Spectral fitting analysis
We conducted fitting of ε2 (imaginary part of permittivity) spectra using Lorentz model. Mn-doped YFe1-xMnxO3 samples with x = 0.4, we adopted a Lorentzian,
where ωp is the oscillation strength, ω0 is the center frequency, and γ is the broadening parameter. Please see Supplementary Information Table S2 for the fitting parameters.
BCS model fitting
The spectral area of ε2 is fitted to the first order like transition with BCS-type transition curve as below:
where TRO is re-ordering temperature. A is a free parameter, B is fixed to 0.5, C is a constant offset (ref. 37).
Time-domain fitting analysis
The magnon emission time signals are fitted by the oscillation fitting equation as below:
where A, ωmag, Φ, and τ are the free parameter, magnon frequency, phase, and relaxation time, respectively. Please see Supplementary Information Table S3 for the fitting parameters.


Responses