Real-time tracking of the Bragg peak during proton therapy via 3D protoacoustic Imaging in a clinical scenario
Introduction
Cancer, a leading cause of death globally, is characterized by the rapid and uncontrollable division of its cells1. Radiation therapy, used in over half of cancer cases, effectively destroys or impedes cancer cells by damaging their DNA2. However, it adversely affects healthy cells, resulting in notable side effects and compromising the patient’s overall outcome3. Proton therapy leverages the distinct depth-dose characteristics of protons, known as the Bragg Peak (Fig. 1a), presenting a substantial benefit compared to conventional radiotherapy methods such as X-ray photon therapy and electron therapy4. This technique enables more precise tumor targeting while safeguarding adjacent sensitive organs, which may decrease side effects, heighten treatment efficacy, and boost patient quality of life5. By December 2021, an estimated 279,455 patients had received proton radiation therapy worldwide6. With over one hundred proton therapy centers established globally, the field is undergoing explosive growth7 (Supplementary Note 1).
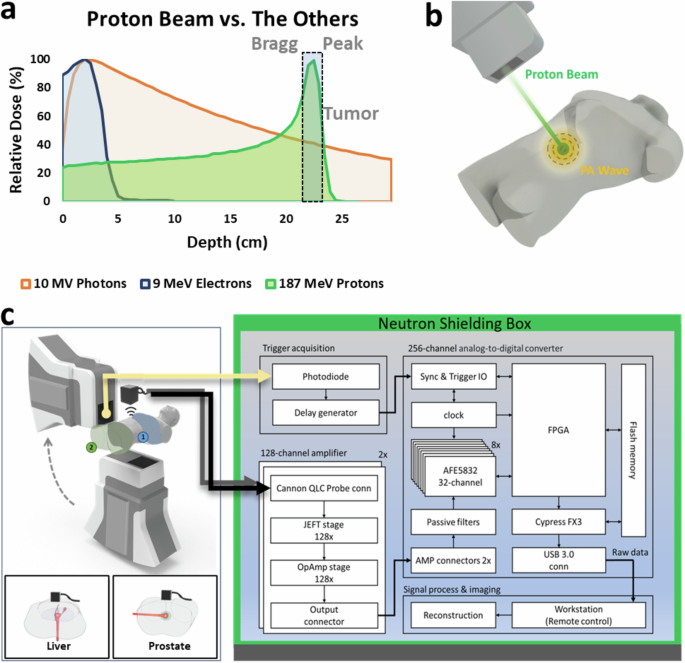
a Proton therapy takes advantage of the Bragg peak phenomenon, delivering radiation precisely to tumor sites, offering a superior alternative to conventional radiotherapy methods such as X-ray photons and electrons. b Illustration depicting the generation of protoacoustic (PA) waves by a proton beam in a clinical setting. c The PAI system employed in our experiment features a 256-element matrix ultrasound array. Each element is directly connected to a pre-amplifier channel and an ADC through 256 parallel channels. Data acquisition (DAQ) is synchronized with the trigger signal detected from the proton machine.
The effectiveness of proton therapy, attributed to the precise location of the Bragg peak, faces challenges due to ‘range uncertainty’8. This uncertainty arises from factors like CT value conversion inaccuracies, changes in patient anatomy, and organ movement, making it difficult to pinpoint the exact location of the Bragg peak9. In its current form, radiotherapy operates as an open-loop treatment, meaning the radiation dose delivered to the patient isn’t directly verified10. This lack of direct feedback inherently reduces safety and accuracy. Therefore, accurately localizing the Bragg peak and providing real-time feedback is critical for improving the precision of radiotherapy. Techniques such as prompt gamma detection (PGD) and positron emitter tomography (PET) are developed to measure the proton beam range in vivo, yet face challenges in clinical accuracy11. Both methods also depend on sophisticated and large detector systems and provide only indirect information about the Bragg peak’s position12.
Protoacoustic imaging (PAI), or ionoacoustic tomography, is emerging as a viable alternative for Bragg peak localization in proton therapy, overcoming the limitations of PGD and PET13,14,15,16,17,18. While the experimental observation of acoustic waves induced by a proton beam during patient treatment was first reported in 199519, there has been renewed interest in this technique over the last few years due to upgraded proton machines and ultrasound detectors12,15,17,20,21,22,23,24,25. Unlike PGD and PET, which require placing bulky and expensive gamma-ray detectors around patients, protoacoustic detection systems comprise a single detector or an array of ultrasound detectors that only require a small space and are more affordable12,25,26,27. Recent studies have utilized protoacoustics to reduce range uncertainty in proton therapy, employing various proton accelerators such as linacs28, synchrotrons19,29, cyclotrons30,31, and synchrocyclotron14,32, all showing promising outcomes. Initially, research predominantly involved single ultrasound transducers for basic point measurements13,14,19,27. Researchers initially explored the use of linear ultrasound arrays for obtaining 2D imaging of the Bragg peak12,30, but newer studies are increasingly focusing on more comprehensive 3D volumetric imaging of the Bragg peak, primarily through computational simulations26,33,34. A recent experiment employing a ring array ultrasound array with a 20 MeV proton beam from a Tandem accelerator represents a significant advancement in 3D protoacoustic imaging17. However, achieving 3D imaging capability requires mechanical rotation, and the lower energy level of this proton source is not compatible with the higher-energy proton machines (>100 MeV) used in clinical settings. A real-time tracking imaging system for monitoring the Bragg peak in 3D during proton therapy in a clinical scenario is still lacking.
In this article, we present an advanced 3D protoacoustic imaging (PAI) system utilizing a 2D matrix array of 16 × 16 elements, which significantly enhances the 3D volumetric imaging capability of localizing the Bragg peak during proton therapy (Fig. 1b). This technology is pivotal in enabling adaptive radiotherapy with real-time feedback, potentially revolutionizing proton therapy for human cancers, particularly in liver and prostate. The system’s real-time capabilities, with up to 75 frames per second, allow for accurate tracking of rapid pencil beam scanning during the treatment. It is also equipped with an integrated ultrasonic transducer, multichannel pre-amplifiers, and 256 parallel data acquisition channels, making it suitable for clinical environments. Its convenience, affordability, and compact design make it applicable to various therapies, including LINAC X-ray photon35,36,37,38,39,40,41,42,43,44,45,46,47,48, electron49,50, and FLASH radiotherapy50,51,52. Moreover, this PAI concept extends to other imaging technologies, for example, 3D ultrasonography53 and photoacoustic imaging54,55,56,57,58 offering broad clinical potential.
Results and discussion
3D PAI system
Figure 1c shows the 3D PAI system’s schematic, comprising a clinical proton machine (Hyperscan S250i, Mevion, USA) for protoacoustic signal generation (Methods). Protoacoustic signals are captured by a 256-element matrix ultrasonic array (Doppler Tech Inc., Guangzhou, China), amplified, and processed by a custom 256-channel data acquisition system (Photosound Tech Inc., Houston, USA) (Supplementary Note 5). The trigger signal, detected by the combination of a photodiode and scintillator, has been used to synchronize the data acquisition process. Signals were processed and reconstructed using a 3D back-projection algorithm59. This configuration, which eliminates the need for mechanical scanning, enables real-time 3D Bragg peak imaging during proton therapy, achieving up to 75 frames per second with 10 averages at a repetition rate of 750 Hz from the proton machine.
3D visualization of Bragg peak
The critical role of three-dimensional visualization of the Bragg peak within proton therapy for cancer treatment is profoundly significant. This peak signifies where the proton beam releases the maximum energy, making it pivotal for clinicians to target the tumor accurately with the highest dose of radiation while safeguarding the surrounding healthy tissues. This level of precision is crucial, especially for tumors located near or within essential structures. In the past, research in protoacoustics primarily focused on point measurements using a single transducer14,16,22,29 or on 2D imaging with a linear array12,17,28,30,32. Our study propels this field forward by utilizing a 2D matrix array composed of 256 (16 × 16) transducers positioned in front of the Bragg peak (Fig. 2a), thereby enabling the 3D volumetric imaging of the Bragg peak in proton therapy. With the 2D matrix array (size of 5 cm by 5 cm, with a center frequency of 1 MHz and a bandwidth of up to 60%) (Supplementary Note 2), we have successfully reconstructed a 3D PAI image. The 3D rendering of the Bragg peak at 108 MeV, captured through Protoacoustic Imaging (PAI) (Fig. 2c, Supplementary Video 1), aligns closely with the TOPAS simulation (Fig. 2b), showcasing its accuracy and potential for precise range measurements in proton therapy. This breakthrough is further evidenced by images in the X–Y plane and dose maps at various depths (Fig. 2d), offering a comprehensive view of the proton beam’s spatial distribution in water (Supplementary Video 2). Additionally, the visualization of two orthogonal planes crossing at the center of the Bragg peak (Fig. 2e) illustrates the precise location of the Bragg peak at the location of 30 mm (Fig. 2e, left), consistent with film measurement. The dose distribution map is displayed in the X–Y plane, as depicted in Fig. 2e (right). This novel imaging approach facilitates the 3D observation of the Bragg peak during proton therapy.
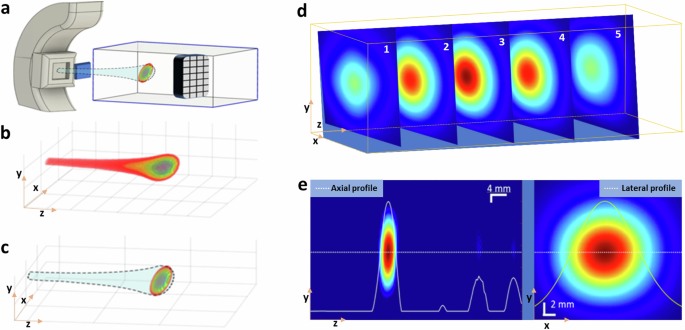
a Orientation of the matrix array relative to the proton beam during our experiment. b Calculated proton dose distribution with TOPAS simulation in 3D. c 3D map depicting the Bragg peak obtained with PAI. d Five typical slices of PA images representing various cross-sections with 0.4 mm thickness of the Bragg peak in the X–Y plane of 108 MeV proton beam. e Protoacoustic (PA) image of the Bragg peak displayed in the Y–Z plane (left), and the PA image of the Bragg peak depicted in the X–Y plane (right).
Characterization of the protoacoustic imaging in 3D
To evaluate the precision of Protoacoustic Imaging (PAI) in identifying Bragg peaks, we conducted a comparison between the Bragg peak profiles reconstructed via PAI (Fig. 3a, d) and those predicted by an in-house TOPAS Monte Carlo simulation code (Fig. 3b, e)60. The reconstructed profiles exhibited Gaussian curves and sizes that closely matched those in the simulations (Fig. 3c, f). Figure 3g, j presents axial plane slices from PAI experiments for proton beams of 87 MeV and 108 MeV, respectively, with comparisons to corresponding simulation slices in Fig. 3h, k. The axial plane (X–Z plane) accuracy, crucial for verifying the range, showed that the reconstructed protoacoustic images aligned closely with the simulation predictions. The accuracy of the reconstructions improved with the number of averaging frames used, with 50 or more frames yielding deviations less than 2 mm from the planned positions for 87 MeV protons, as illustrated in Fig. 3i. This accuracy further improves, potentially reaching submillimeter levels, with an increased averaging number up to 1000 times, as suggested in Fig. 3j. Additionally, the imaging resolution of the PAI system was assessed through the line spread function, achieving ~1.4 mm resolution in the axial plan and ~3.2 mm resolution lateral plane which determined by element size of the ultrasound transducer, detailed in Supplementary Note 3. This examination underscores PAI’s capability for precise localization and visualization of Bragg peaks, offering significant promise for enhancing the accuracy of proton therapy treatments.
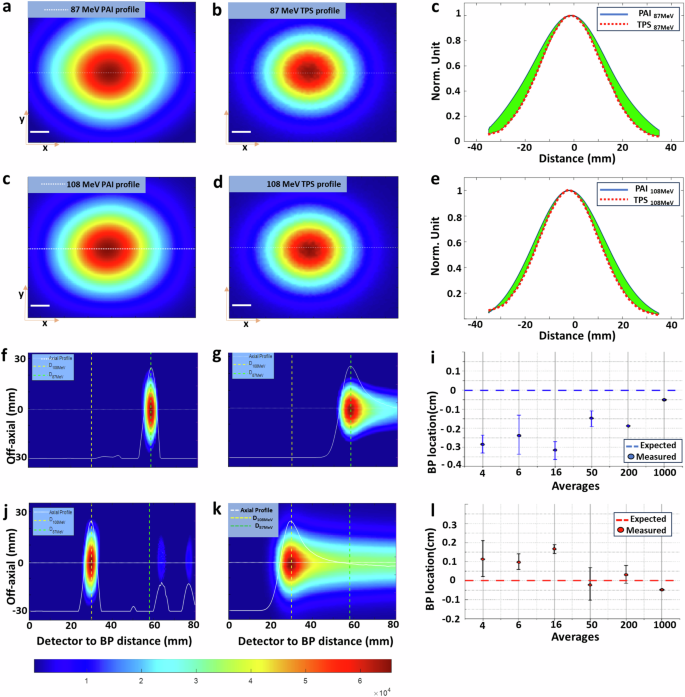
a PA image of 87 MeV protons in the X–Y plane, b corresponding TOPAS simulation. d PA image of 108 MeV protons in the X–Y plane, e corresponding TOPAS simulation. c, f The profile comparison between the PAI and simulation along the dashed line in (a) and (d) correspondingly. The green color marks the difference between the two. g, j PA images of cross sections of the Bragg peak for 87 MeV and 108 MeV protons, respectively, with (h) and (k) showing the corresponding TOPAS simulations. i demonstrates PAI accuracy in localizing the Bragg peak to better than 2 mm with 50 more averages, while l exhibits PAI accuracy in localizing the Bragg peak to better than 1 mm with ~1000 averages.
Real-time tracking of Bragg peak
PAI’s real-time 3D imaging capabilities can be utilized for the real-time monitoring of proton therapy, particularly in pencil beam scanning, as illustrated in Fig. 4a. In order to compare the actual spot positions with the theoretical value, three spots were scanned. The study utilized a 227 MeV proton beam, with the PAI detector array effectively monitoring the beam’s path with different step sizes (10 mm in Fig 4b vs. 5 mm in Fig. 4c). Reconstructions confirmed the designed patterns and spacings, affirming PAI’s accuracy and potential for real-time therapy monitoring and adaptive radiotherapy. Video recordings (Supplementary Videos 3 and 4) further demonstrate the real-time imaging capability (up to 75 frames per second with 10 averages), underscoring PAI’s versatility in monitoring proton therapy in clinical settings.
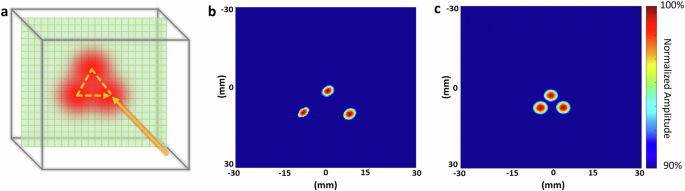
a Scanning pattern utilized in proton pencil beam scanning treatment. b Proton beam scanning demonstrating three different spots with a 10 mm step size (Supplementary Video 3). c Proton beam scanning demonstrates three different spots with a 5 mm step size (Supplementary Video 4).
3D imaging of Bragg peak in liver treatment
To assess protoacoustic imaging (PAI) in localizing Bragg peaks in clinical scenarios, we utilized a liver cancer model within a human torso phantom, matching patient tissue properties in both planning CT and protoacoustic imaging (Supplementary Note 6). Treatment involved administering proton beams at five energy levels (143.85–164.93 MeV, Fig. 5b), directed from the patient’s back with an ultrasound probe on the abdomen (Fig. 5a). PAI depicted relative dose delivery to the liver, revealing different beam locations in 3D imaging (Fig. 5c). Despite some axial distortion, PAI successfully resolved Bragg peak locations. In sagittal views, PAI images were overlaid with treatment planning dose distributions on the planning CT, as depicted in Fig. 5d. Comparing PAI measurements (Fig. 5e) of the Bragg peak of the proton beam to treatment plans (Fig. 5f, Supplementary Note 4) showed good alignment. In Fig. 5f, Gamma index mapping was employed to quantitatively assess PAI data against simulated doses, confirming the accuracy of PAI in dose mapping (Supplementary Note 7). The gamma index test, applying the 5 mm/5% criteria with a 10% dose threshold, reached an accuracy of 95.73%. This result signifies that 95.73% of the doses above 10% of the maximum measured dose aligned with the established ground truth. This level of accuracy is considered very high in the field of radiotherapy, demonstrating the effectiveness of the 5 mm/5% gamma index criteria. These findings underscore PAI’s potential in adaptive radiotherapy for precise Bragg peak localization.
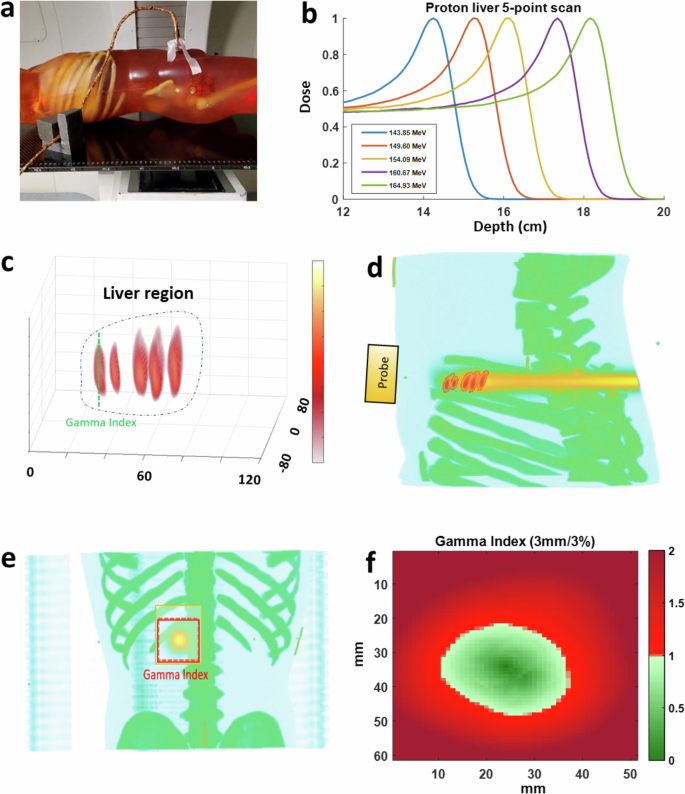
a A photo capturing protoacoustic imaging in a clinical environment, where a matrix array is affixed to a human torso phantom during the experiment. b Graph depicting the dose profile of a proton scanning beam at varying energies. c Five 3D protoacoustic images showcasing Bragg peaks at different energies (143.85, 149.60, 154.09, 160.67, and 164.93 MeV). d Superimposition of the Bragg peak images onto the treatment plan in the X–Z plane using TOPAS. e Protoacoustic images of Bragg peaks overlaid onto planning CT scans in the X–Y plane. f Evaluation of gamma index (5 mm/5%) showing PAI’s accuracy in Bragg peak localization, with over 95.73% precision.
3D imaging of Bragg peak in prostate treatment
We also showcased the effectiveness of PAI in monitoring prostate proton therapy (Fig. 6). Using the same human torso setup, we adjusted the proton beam gantry by 90 degrees to target the prostate laterally with a 171.1 MeV proton beam. The transabdominal ultrasound probe was employed to detect protoacoustic signals. Figure 6 illustrates the simulated dose distribution of proton therapy alongside PAI’s reconstructed distribution, focusing on a quintuple-point proton beam scan. Figure 6a presents the treatment planning for prostate proton therapy, integrating CT imaging with treatment planning dose in the X–Z plane. Figure 6b displays a protoacoustic image superimposed onto the planning CT in the X–Y plane. Figure 6c illustrates the positioning of the protoacoustic probe during the experiment. Figure 6d showcases the evaluation of the gamma index (3 mm/3%), demonstrating the precision of PAI in Bragg peak localization, achieving over 97.44% accuracy when applying the 5 mm/5% criteria with a 10% dose threshold, during prostate treatment. Real-time monitoring of the Bragg peak in vivo is crucial to ensure precise targeting of the prostate while minimizing radiation dose to adjacent critical organs, such as the rectum and bladder.
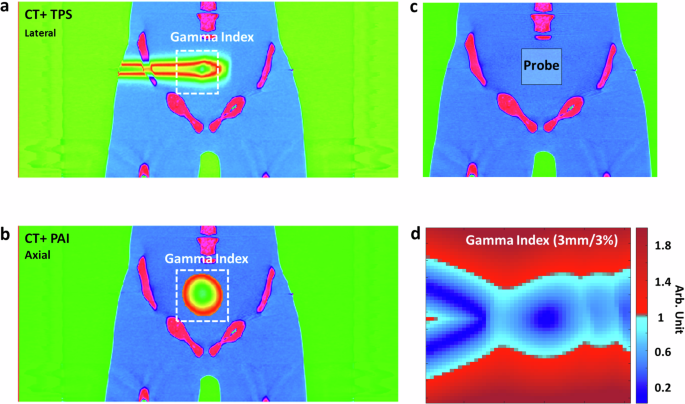
a Illustrates treatment planning for prostate proton therapy, featuring CT imaging overlaid with treatment planning dose distribution in the X–Z plane. b Presents a protoacoustic image superimposed onto the planning CT in the X–Y plane. c Depicts the positioning of the protoacoustic probe during the experiment. d Evaluation of the gamma index (5 mm/5%) demonstrates the precision of PAI in Bragg peak localization, achieving over 97.44% accuracy during prostate treatment.
In summary, PAI showcases its potential in enhancing proton therapy by accurately localizing Bragg peaks in 3D. Its capability to offer detailed (5 mm/5% analysis achieving 95.73% accuracy) and real-time feedback (at 75 frames per second) is vital for verifying radiation delivery on the fly and enabling adaptive radiotherapy.
Our 3D protoacoustic imaging uses a 256-element 2D matrix array, marking the first 3D imaging of the Bragg peak with a clinical proton machine. This method improves upon traditional single detector or linear array for protoacoustic measurements14,30. It is particularly crucial for proton pencil beam scanning, where the precision of spot size, scanning position, and Bragg peak range greatly impacts dose distribution. Despite accurate correlation with treatment planning, some X–Z plane distortions (as shown in Fig. 3g, j) arise due to back projection algorithm limitations, common in ultrasound and photoacoustic imaging59. Future improvements could include advanced reconstruction algorithms, like model-based 45,46,61 or deep learning techniques33,62,63, to enhance imaging accuracy. Additionally, our dedicated pre-amplifier, data acquisition system, and wavelet filtering64 reduce the need for signal averaging, thereby enabling real-time imaging. When pulse-echo ultrasound is integrated with protoacoustic imaging, it can be utilized to manage tumor motion, with corrections made using interleaved ultrasound images64,65.
In 3D protoacoustic imaging, the lateral resolution is about 3.2 mm, influenced by the ultrasound element size in our matrix array (Supplementary Note 2). Axial resolution depends on proton pulse duration and the ultrasonic transducer’s detection bandwidth. We used a 1 MHz transducer with approximately 60% bandwidth and determined the imaging resolution with R = 0.88 vs/fmax around 1.01 mm resolution66. However, proton pulse durations of 4–20 µs reduce the axial resolution to 1.4 mm (Supplementary Note 3). Utilizing higher frequency transducers and narrower proton pulses could potentially allow for sub-millimeter resolution17, enhancing Bragg peak localization accuracy.
A key aspect of our study was testing our PAI imaging device in clinical scenarios, using a portable imaging system integrated with an ultrasound array and a parallel data acquisition system, suitable for clinical use. All experiments were performed using a clinical proton machine (S250i Proton Therapy System, Mevion, USA) with clinically relevant proton energies. We primarily conducted experiments on an adult human torso phantom designed for X-ray/CT and Ultrasound compatibility, replicating average adult male anatomy (Supplementary Note 6). This setup, ideal for proton treatment planning CT, allowed protoacoustic imaging tests without IRB protocols and prepared us for future patient testing and large clinical trials.
In conclusion, while the PAI system shows great promise in enhancing the precision and effectiveness of proton therapy, ongoing research, and development are essential to address its current limitations and fully realize its potential in clinical applications. The advancements in PAI technology and its integration into proton therapy could lead to more accurate, patient-specific treatments, ultimately improving outcomes for cancer patients undergoing proton therapy.
Methods
Experimental set-up
In the PAI system (shown Fig. 1c), there are five main components: (1) a rotating proton beam gantry with positions for prostate (180°) and liver (90°) procedures, (2) a pulse trigger signal from the S250i Proton Therapy System (Mevion, USA), (3) a 256-channel 2D ultrasound transducer array (Doppler Tech Inc., China), and (4) a custom 256-channel data acquisition system (Legion ADC, Photosound Tech Inc., USA). Acoustic waves from the proton beam are collected by the transducer array and digitized, enabling precise monitoring with (5) a computer. The proton source provides the proton beam with a pulse duration adjustable varies from 4 to 20 µs. The combination of a photodiode and a scintillator can detect the proton pulse and can be used as the trigger signal. Trigger signals are fed into a function generator (keysight, USA) and converted into digital pulses for the data acquisition system. For each trigger, approximately 75 µs of acoustic wave is collected with all 256 channels and converted into digital signals by the data acquisition system. The data will be transmitted to a computer and wait for postprocessing and image reconstruction.
2D matrix array
Matrix array transducers have been developed in this work for 3D imaging in real time. The matrix array transducers have 256 (16 × 16) active elements (3 mm in size and 0.2 mm in pitch) made of piezoelectric single crystals, PMN-PT, about 5 cm square (Supplementary Note 2). The matrix array, featuring a central frequency of 1 MHz and a fractional frequency bandwidth exceeding 60%, has undergone division into halves, with each half connected to 128-channel pre-amplifiers and a data acquisition system. This setup enables real-time 3D imaging capabilities.
Pre-amplifiers and data acquisition
To address low signal amplitude in protoacoustic imaging with commercial ultrasound systems, each detector element is linked to a dedicated amplifier located nearby. This setup (Photosound Tech Inc., Houston, USA) includes 256 channel preamplifiers (40 dB) and secondary amplifiers (up to 51 dB) for SNR optimization, totaling a gain of up to 91 dB. This significantly reduces the number of averages needed for acquiring high-quality SNR protoacoustic signals (Supplementary Note 5).
Protoacoustic imaging protocols
For our initial tests in visualizing the Bragg peak in 3D (Fig. 3), the matrix ultrasound array was immersed in a water tank which has been widely used in radiation therapy dosimetry measurements. A scintillator crystal was fixed in the 1-mm entrance window of the tank along the beam path to obtain trigger signals that initialize the data acquisition (DAQ) system. Individual spot energies with energies of 87 and 108 MeV were delivered to characterize the 3D protoacoustic images with an in-house TOPAS simulation. To showcase the real-time tracking of pencil beam scanning (Fig. 4), the same matrix ultrasound array was used, and three spot positions in the X–Y plane were specified. Proton beam scans were executed with two specific step sizes: 0.5 mm and 1 mm at 227 MeV beam energy. To evaluate PAI’s effectiveness with a human-like subject, clinical proton therapy setups were used with a human torso phantom (True Phantom Solutions, Ontario, Canada). IRB protocol is not required at this moment for phantom use. The phantom was CT scanned using a GE Lightspeed in a supine head-first position, following a clinical pelvis protocol with slice resolutions of 1.25 mm in the axial Z-direction and 1.02 mm in the XY-plane. Images were imported to the clinical treatment planning software Raystation ver. 12 (RaySearch Laboratories, Sweden) to calculate pencil beam doses for prostate (Fig. 5) and liver (Fig. 6). The phantom was positioned using skin markers and aligned with in-room lasers and kV-imagers. Raystation (version 12 A) calculated the dose for each treatment configuration. The dose grid was resized to match the physical dimensions of the CT image set, this ensured a matching overlay with protoacoustic imaging in MATLAB. The study considered two clinical scenarios: posterior-anterior beam delivery at 180° gantry for the liver and lateral beams at 90° for the prostate, with specified beam energies. Ultrasound gel ensured coupling between the array and the phantom. All experiments were performed with the synchrocyclotron’s Physics mode allowing the delivery of custom-made single spot plans. Clinical beam energies that reached the target depth were selected. The number of monitor units was set to an amount sufficiently large that the number of trigger events for protoacoustic signal acquisition would be met before the end of beam delivery.
Human torso phantom
Our experiments extensively used a human-like phantom (True Phantom Solutions, Ontario, Canada), designed to resemble an average adult male’s anatomy. This highly detailed model is compatible with CT, and Ultrasound. We can simulate the planning CT with this human torso phantom. It includes realistic skeletal components, such as a complete spine and ribcage, and internal organs like the heart and liver. The phantom replicates human tissue properties with a sound velocity of 1400 ± 10 m/s, a density of 1.00 g/cm³, and an attenuation of 1.2 ± 0.2 dB/cm at 2.25 MHz. These features make it an ideal tool for accurate protoacoustic imaging studies (Supplementary Note 6).
Signal processing and image reconstruction
Traditionally, the low signal-to-noise ratio (SNR) in protoacoustic signals requires multiple averages. This also reduces the frame rate, limiting real-time dose monitoring. To mitigate this, we employed a discrete wavelet transform (DWT) based filtering approach to denoise protoacoustic signals and minimize averaging67. Wavelet analysis via DWT extracts temporal and frequency data, allowing for selective filtering. Threshold coefficients from DWT analysis were synthesized back using inverse DWT (IDWT) with a sym8 wavelet and a 0.12-MHz cutoff frequency for the low-pass filter.
To reconstruct the protoacoustic image (PAI), the detected signals are “back projected” across the imaging space from the direction they were acquired. The protoacoustic pressure (pleft(r,text{t}right)) detected at the transducer position ({boldsymbol{r}}) and time (t) can be expressed by68:
where ({Gamma }) is the Grüneisen parameter defined as: ({Gamma }=frac{{boldsymbol{beta }}{K}_{T}}{{C}_{{boldsymbol{v}}}rho }). where β is the volumetric thermal expansion coefficient, and ({K}_{T}) is the isothermal bulk modulus. Meanwhile, the initial pressure ({{boldsymbol{p}}}_{0}left({boldsymbol{r}}right)) induced by radiation can be obtained by69:
where ({D}_{{boldsymbol{p}}}left({boldsymbol{r}}right)={D}_{{boldsymbol{r}}}left({boldsymbol{r}},tright){tau }_{{boldsymbol{p}}}) is the local energy deposition due to a single proton pulse with a pulse duration of ({tau }_{{boldsymbol{p}}}). The pixel intensity in the PAI image, reconstructed from captured protoacoustic signals, represents the initial acoustic pressure. Therefore, the relative intensity image offers vital information regarding both the location of the proton beam and the amount of dose delivered to the target.


Responses