Realtime bacteria detection and analysis in sterile liquid products using deep learning holographic imaging
Introduction
Bacteria play dual roles in our environment—they are crucial for ecological balance but also pose serious health risks as pathogens and cause significant industrial challenges as contaminants. The World Health Organization reports that bacterial food contaminations contribute to ~33 million disability-adjusted life years lost annually, with bacteria responsible for 60–70% of hospital admissions related to foodborne diseases1. Economically, these incidents have profound impacts, costing the United States around $15.5 billion and global losses in low-to-middle income countries exceeding $100 billion2,3. In the pharmaceutical sector, microbial contamination not only endangers health but also incurs heavy financial losses due to drug recalls4,5. Thus, enhancing bacterial detection methods in these industries is critical to public health and economic stability.
While culture-based methods have long been the gold standard for detecting viable bacteria through colony-forming unit counts, they lack sensitivity and speed. Traditional culture methods often fail to detect a significant portion of viable but non-culturable bacteria, which are believed to be responsible for up to 80% of foodborne illnesses2,6. Additionally, these methods can take several days to yield results, which is impractical for industries requiring rapid responses, such as food, beverage, and pharmaceuticals, to prevent spoilage and avoid outbreaks7. Consequently, the limitations of traditional methods have spurred the development of rapid bacterial pathogen detection techniques. Among these, nucleic acid-based methods like PCR and qPCR offer high specificity by utilizing unique bacterial genetic sequences, yet they require well-equipped labs, specialized personnel, and often pre-amplified DNA, limiting their field applicability8. Other rapid methods, including immunological assays and biosensor-based approaches, also show promise but face challenges due to variable sensitivity, a tendency for false positives, and operational instability9,10. Most importantly, these methods generally fail to distinguish live from dead bacteria and depend on predefined biomarkers, which can restrict their utility in real-world applications.
To address these limitations, well-established label-free techniques such as Fourier transform infrared (FTIR) spectroscopy and mass spectrometry have been adapted and refined to enhance pathogen detection. These methods offer advanced detection capabilities by analyzing unique molecular vibrations and precise mass measurements, yet they often face challenges such as high costs, extensive sample preparation, and reduced sensitivity at lower concentrations”11,12,13. Hyperspectral imaging and quantitative phase imaging (QPI) also provide detailed detection through spatial and morphological data but struggle with low throughput, high operational complexity, and costs14,15,16. Despite their potential, these methods face significant challenges in practical applications, especially when detecting low-concentration pathogens in resource-limited settings. The ongoing demand for innovative technologies that are high-throughput, sensitive, cost-effective, and capable of on-site analysis underscores the substantial gaps in current pathogen detection methods.
Digital inline holography (DIH) has emerged as a cost-effective and compact solution for high-throughput analysis of microparticles in suspension17,18. Utilizing a digital camera, DIH captures interference patterns (i.e., holograms) from the interaction between coherent light and particle suspensions, encoding valuable information about the particles’ 3D positions, morphologies, and refractive indices. In contrast to conventional microscopy, DIH not only yields a significantly larger depth of field but also offers detailed information about the biochemical composition of particles (e.g., cell viability, and metabolic states) without the need for fluorescent labels19,20,21,22. As a result, DIH has been applied to a broad range of biological particle analysis, such as viability analysis of yeast cells23, characterization of sperm motility24, plankton classification25, and detection of abnormal red blood cells26. However, the task of detecting and classifying bacteria using DIH is notably challenging due to their similar morphologies and diminished optical signatures, which are often obscured by their small size and refractive indices closely resembling those of their surrounding media. Adapting this technology for industrial applications adds further complexities, requiring not only low cost and high throughput but also low false positive rates and easy integration without specialized training. To date, DIH applications in bacterial analysis have been constrained to scenarios like bio-locomotion measurements27, colony-level classification28, and low-throughput post-analysis for extraterrestrial samples29. None of these applications have demonstrated the ability to meet industry demands for rapid, highly sensitive, and precise detection and classification of bacteria. In response, our study proposes a DL approach specifically designed to augment DIH’s capabilities, enabling real-time, precise detection of individual bacteria. This advancement is achieved within a cost-effective and user-friendly framework, effectively addressing the current limitations in DIH applications.
Results
In this section, we conducted a thorough evaluation of our method’s performance and capabilities using both synthetic and experimental datasets. Initially, we validated our approach with datasets synthetically generated to closely resemble real-world conditions while maintaining known ground truths. After this synthetic dataset evaluation, we assessed the method’s effectiveness with experimental data by spiking multiple types of bacteria into a sterile liquid. The results below detail the outcomes of these evaluations.
Classification of five classes of bacteria and PMs
we first assessed our DL DIH approach, focusing on its ability to classify five bacterial species, i.e., Escherichia coli (EC), Pseudomonas aeruginosa (PA), Bacillus subtilis (BS), Enterococcus faecalis (EF), and Campylobacter jejuni (CJ), and generic particulate matter (PM) found in the sterile liquid (PMs) within synthetic datasets. These datasets comprised 10,000 holograms featuring random combinations of the aforementioned bacteria and PMs, aiming for an average particle concentration of approximately five per hologram. Figure 1a displays a sample hologram where the successful detection and classification of particles are highlighted through differently colored bounding boxes, demonstrating the DIH method’s capability to discern the distinct holographic signatures of each particle type. Remarkably, the DIH method excels in distinguishing between bacterial species such as EC, PA, and BS, whose morphological similarities pose challenges to traditional microscopy. This differentiation is notably facilitated by DIH’s sensitivity to the subtle variations in optical properties inherent to each bacterial species. Such optical distinctions, which are minute and often undetectable through conventional microscopy, are effectively captured and amplified by DIH.
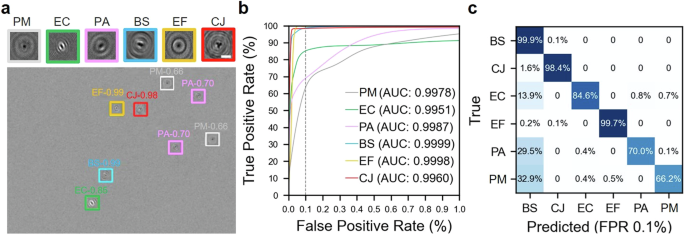
a A sample of experimentally derived synthetic hologram showing our deep learning model detects and classifies six types of particles each marked with colored bounding boxes including E. coli (EC), P. aeruginosa (PA), B. subtilis (BS), E. faecalis (EF), C. jejuni (CJ), and generic particulate matters (PMs). The figure also includes an in-focused closeup hologram of each type of particle showing their distinct morphologies and diffraction patterns with a scale bar of 5 µm. b Receiver operator characteristic (ROC) curves and corresponding area under curve (AUC) values of our deep learning model for different types of particles with vertical dashed line marking 0.1% false positive rate (FPR). c The confusion matrix shows the accuracy and prediction errors of our classification for each type of particle evaluated at 0.1% FPR.
The classification accuracy of our DL model was assessed through receiver operating characteristic (ROC) curves, shown in Fig. 1b. These curves evaluate the model’s accuracy by measuring the true positive rate (TPR), or the probability of accurately classifying a particle, against the false-positive rate (FPR), or the probability of incorrectly classifying a particle as a different type (any of the other types), across various confidence thresholds. This analysis, known as the one vs rest ROC curve analysis, revealed area under curve (AUC) scores exceeding 0.995 for all bacterial species and PMs. In particular, BS achieved the highest AUC at 0.9999, with EF at 0.9998 following closely. Importantly, even at a very low FPR of 0.1%, the TPR for all categories remained reasonably high, with the lowest values above 65% and most above 90%, demonstrating the model’s high precision in classifying each particle type accurately.
Correspondingly, the confusion matrix (Fig. 1c), evaluated at a 0.1% FPR, elaborates further on the classification performance of our method, with BS exhibiting the highest TPR of 99.9% due to its large size and consistently uniform shape. Conversely, PMs, showing the lowest TPR of 66%, reflect the challenges posed by their varied shapes and sizes. EF and CJ rank closely behind BS in TPR, attributable to their unique spherical and spiral shapes, respectively. EC and PA exhibit lower TPRs, i.e., 85 and 70% at 0.1% FPR, respectively, primarily because of their resemblance to each other and BS. Particularly, PA is more frequently misclassified as BS than EC, evidencing their closer shape and size correlation. Despite the lowest TPR of PMs among all classes, their TPR improves significantly to above 80% with only a slight increase in FPR to ~0.3%. This performance, albeit modest, is deemed sufficient for scenarios prioritizing bacterial pathogen detection, especially when the higher prevalence of PMs is a factor. This underscores the method’s capability in accurately identifying critical bacterial pathogens even amid a high background of PMs.
Classification of bacteria of different Gram stain attributes
Here we further evaluated the ability of our method to discern between Gram-positive and negative bacteria, which have different cell-wall structures30. The underlying hypothesis posits that variations in Gram attributes, which correlate with cell wall permeability, may influence the diffraction patterns emanating from bacterial cell walls. Such differences, albeit subtle, are anticipated to create distinct holographic signatures discernible by our DIH approach. To precisely discern the impact of Gram attributes independent of morphological factors such as shape and size, we first utilized synthetic data for E. coli (EC, Gram-negative) and B. subtilis (BS, Gram-positive), both of rod shape but with BS naturally larger than EC. Furthermore, to eliminate bias stemming from size discrepancies, we digitally reduced the size of BS in the synthetic dataset to align with the average dimensions of EC, thus creating a “downscaled BS” (DsBS) variant. Figure 2a displays a sample of experimentally derived synthetic hologram that effectively demonstrates the accurate detection and classification of EC and DsBS, with bounding boxes color-coded in alignment with Fig. 1a. Additionally, in-focused hologram samples for EC and DsBS accompanied by the corresponding reconstructed images at 10 and 20 µm away from the in-focused plane show distinct diffraction patterns between these two bacteria despite their similarity in size and shape. The ROC curves for both EC and DsBS showcase high classification accuracy, with AUC values exceeding 0.999, even at the stringent FPR of 0.1% (Fig. 2b). The confusion matrix at this FPR further details the classification efficacy, illustrating a remarkable performance for DsBS (95.6%). The performance for EC (82.4%) is relatively lower but still reasonable. For this confusion matrix, and the following confusion matrices in Figs. 3c and 4c, an additional class ‘unknown’, is used to classify particles with confidences below the FPR threshold of our known classes. The NA values on the confusion matrix signify that we do not have true positives for this class (no ground truth). Overall, these results underscore the potential of our method in differentiating bacteria with similar morphology but different Gram attributes (Fig. 2c).
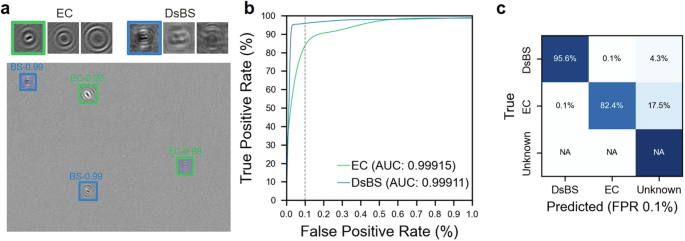
a A sample of experimentally derived synthetic hologram showing our deep learning model detects and classifies E. coli (EC) and downscaled B. subtilis (DsBS), as well as the detections below our confidence threshold (unknown). The figure also includes in-focused hologram samples for EC and DsBS accompanied by the corresponding reconstructed images at 10 and 20 µm away from the in-focused plane showing distinct diffraction patterns between these two bacteria. b Receiver operator characteristic (ROC) curves and corresponding area under curve (AUC) values of our deep learning model for EC and DsBS with vertical dashed line marking 0.1% false positive rate (FPR). c The confusion matrix showing the accuracy and prediction errors of our classification for each type of bacteria evaluated at 0.1% FPR.
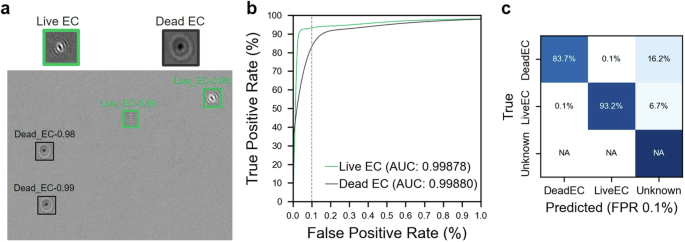
a A sample of experimentally derived synthetic hologram showing our deep learning model detects and classifies live and dead E. coli (EC), as well as the detections below our confidence threshold (unknown). The figure also includes in-focused hologram samples for live and dead bacteria showing distinct diffraction patterns between them. b Receiver operator characteristic (ROC) curves and corresponding area under curve (AUC) values of our deep learning model for live and dead EC with vertical dashed line marking 0.1% false positive rate (FPR). c The confusion matrix showing the accuracy and prediction errors of our classification for live and dead EC evaluated at 0.1% FPR.
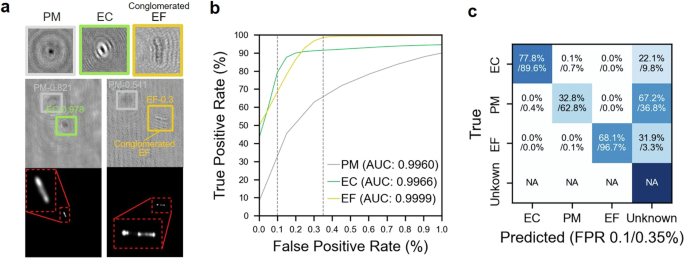
a Hologram and corresponding fluorescent image samples showing our deep learning model detects and classifies E. coli (EC) and E. faecalis (EF) among generic PMs, as well as the detections below our confidence threshold (unknown). The figure also includes an in-focused closeup hologram for each type of particle showing their distinct diffraction patterns. b Receiver operator characteristic (ROC) curves and corresponding area under curve (AUC) values of our deep learning model for PMs, EC, and EF with vertical dashed lines marking 0.1 and 0.3% false positive rate (FPR), respectively. c The confusion matrix shows the accuracy and prediction errors of our classification for each type of particle evaluated at 0.1 and 0.35% FPR, respectively.
Classification of live and dead bacteria
Here we examine the effectiveness of our methodology in distinguishing between live and dead (autoclaved) bacteria. This distinction is critical for medical diagnostics, food safety, and environmental assessments, as it is essential in identifying active biological threats and assessing the efficacy of sterilization protocols. Here we utilize synthetic datasets generated in the same manner as previously described. These datasets simulate both live and dead E. coli, ensuring a realistic and controlled environment for evaluation. Figure 3a displays a sample of an experimentally derived synthetic hologram that demonstrates the accurate detection and classification of live and dead E. coli. The accompanying in-focus hologram samples within the same figure reveal distinct optical signatures, evidencing how autoclaving alters the bacteria’s holographic patterns, a nuance our DIH method successfully captures. Mirroring the outcomes observed in Fig. 2b, the ROC curves for both live and autoclaved E. coli display a striking level of classification precision with AUC values of approximately 0.999, at the same stringent FPR of 0.1% (Fig. 3b). The confusion matrix (Fig. 3c), constructed at the same FPR, conveys the remarkable accuracy of our classification, emphasizing the DIH method’s capability to detect essential biological states. However, it is worth noting that various sterilization techniques may alter the optical properties of bacteria differently, potentially influencing model performance trained on a singular procedure. This aspect underlines a need for further study as indicated in the discussion section of our work.
Bacteria classification in spiked experiments
In this last section of our results, we present the application of our method to real-world scenarios through spiked experiments, wherein selected bacteria is spiked into a sterile liquid containing generic PMs. Specifically, we focused on two bacterial strains, E. coli (EC) and E. faecalis (EF), chosen for their distinct morphological characteristics. For these experiments, both bacteria were labeled with SYBR Green, a nucleic acid stain, to facilitate differentiation from the generic PMs, leveraging both the fluorescent signal for initial distinction and morphological differences for manual classification of EC and EF. The model itself was only trained using non-stained bacteria and our following results (i.e., the desired performance of our model in detecting bacteria) confirmed that the influence of stain on the holographic signature of bacteria is negligible. The experiment was conducted using our dual imaging system, simultaneously capturing the DIH and fluorescence images. In this experiment, 100 µl of a 108 bacteria/ml solution of each EC and EF were mixed into 100 ml of sterile liquid. The ground truths for this experiment were generated via manual examination of the holograms along with cross-comparison to the corresponding fluorescent images, to differentiate generic PMs from bacteria, ensuring precise evaluation of our model’s classification performance. Figure 4a showcases hologram and corresponding fluorescent samples that illustrate the DIH system’s accuracy in detecting EC and EF amidst generic PMs. The precision of the DIH identification is confirmed by the bright spots observable in the fluorescent images, coinciding with the locations marked by DIH. It is worth noting that a substantial presence of EF in the experiments appears as elongated conglomerates, resembling chains of 3-4 spherically linked cells, divergent from the individual EF samples used in training the model as shown in Fig. 4a. Therefore, our DL model initially classified these conglomerates as an unknown class due to their unfamiliar appearance. Upon revising the classification labels to correctly identify EF conglomerates, the subsequent analysis depicted in the one vs rest ROC curves for EC and EF (Fig. 4b) exhibits AUC values surpassing 0.996, indicative of the precision mirrored from synthetic dataset evaluations. However, a noticeable dip in TPR in the confusion matrix at 0.1% FPR (Fig. 4c) reflects expected variations due to a smaller experimental dataset, yielding greater TPR uncertainty at lower FPRs—evidenced by the non-zero TPR at a zero FPR value. Contributing to the diminished TPR could also be the inconsistency in fluorescent labeling, potentially due to incomplete labeling or imperfect focus during image capture. Nevertheless, increasing the FPR marginally to 0.35% aligns the TPR closely with those from synthetic dataset assessments. These findings underscore the potential of synthetic data in calibrating and gauging the accuracy of the DL DIH method. Moreover, the experiment demonstrates our model’s potential for identifying novel particle classes, such as the EF conglomerates, underscoring its capacity and readiness for being fine-tuned for real-world adaptation in industrial environments, which invariably introduce unfamiliar particulates.
Discussion
In the current study, we have developed a DIH approach integrated with DL to enable real-time, label-free, bacterial detection and classification. This innovative method has shown promise in distinguishing between bacteria of different morphology, Gram stain attributes, and viability. For the development of this approach, we design a prototype that integrates DIH with fluorescence imaging to efficiently capture holograms of bacteria flowing in a microfluidic channel, further enhancing the accuracy of our analysis through fluorescence signal validation. We process holograms using a tailored DL framework that consists of preprocessing, detection, and classification stages, which incorporates three DL models, namely YOLOv8n, YOLOv8, and HRNet. Each model is carefully chosen for its respective role in optimizing the image analysis workflow. These models are trained on an extensive dataset that includes holograms of generic PMs present in sterile liquid and five bacterial species featuring distinct morphologies covering both Gram-positive and Gram-negative bacteria. The synthetic data created from labeled experimental holograms feature various combinations of these bacteria and PMs, offering a controlled environment for assessing the performance of our approach. This assessment underscores the capability of our method to effectively discern between bacteria and generic PMs, successfully classify five bacterial species with high accuracy, and maintain a 0.1% false positive rate. Moreover, our method showcases the ability to distinguish between morphologically similar bacteria of differing Gram stain attributes, accurately classifying E. coli (Gram-negative) and B. subtilis (Gram-positive)—both rod-shaped, with the latter adjusted in size to match the former for comparative purposes. Furthermore, our method proves capable of differentiating between live and dead E. coli with a performance paralleling the former cases. The robustness of our method was also supported by experiments in sterile liquid containing two bacterial species labeled by fluorescent dyes, where the method reliably detects and classifies types of bacteria amidst generic PMs.
Our study represents a significant advancement in rapid bacterial pathogen detection, effectively addressing key limitations present in current methodologies. Our method surpasses state-of-the-art techniques such as rapid PCR, immunological assays, and various biosensors by providing real-time, label-free results. It offers these advantages while also reducing operational costs and complexity, a critical consideration for practical applications. The sensitivity of our system allows for the detection of individual bacteria with a reduced FPR relative to many other advanced techniques. Compared to conventional microscopy, DIH achieves a significantly larger depth of field, which substantially enhances throughput. Moreover, DIH captures both morphological and subtle optical changes in samples. This capability is crucial for differentiating between live and dead bacteria, and may also enable the distinction between different strains of bacteria that appear morphologically similar but vary optically due to changes in their biochemical composition. Additionally, compared to other label-free methods such as mass spectrometry, FTIR, hyperspectral imaging, or QPI, our approach is more cost-effective and features a more compact design, making it ideally suited for integration into sterile liquid examination and processing workflows across various industrial settings.
The modular design of our DL framework enhances its adaptability, facilitating the detection and analysis of a wide range of bacteria and PM contaminants. This adaptability was evident in our experiments where our system successfully identified and isolated an unfamiliar particle (conglomerate) during spiked tests. Subsequently, the model swiftly collected data on this unknown signature, analyzed it, and integrated the new information, exemplifying the system’s capacity to continuously adapt and classify new and unfamiliar particle types. The broad applicability of our method offers substantial potential in several biotechnological arenas, including real-time bioreactor monitoring, rapid pharmaceutical manufacturing screening, environmental monitoring, and clinical diagnostics for various diseases31,32.
While the system’s current throughput of ~3 µL/min may fall short of industrial standards, integrating preconcentration techniques like a crossflow filtration unit could substantially increase throughput33. The affordability and compact design of the system facilitate such enhancements, paving the way for scalability and improved performance. Comprehensive validation with a broader variety of samples, including a wide range of bacteria and particulate contaminants and samples treated under different sterilization methods, is critical to fully assess the method’s applicability and robustness. Additionally, the system’s limitations in detecting smaller bacterial species call for further refinement and optimization. Future developments of our DL framework will aim to address those issues to extend the system’s application range significantly.
Methods
Method overview
For our study, we developed a prototype DIH-fluorescent dual imaging system that captures synchronized DIH and fluorescent images within the same field of view. This setup allows for direct validation of our DL algorithm by enabling comparison between the DIH images and the fluorescent signals from tagged bacteria. By utilizing this system, we can confirm the presence of bacteria detected by the DL algorithm in the DIH images through corresponding fluorescent signals in the fluorescent images. This method effectively distinguishes actual bacterial detections from false positives, which are indicated by a lack of fluorescent signal when the algorithm mistakenly identifies generic particles as bacteria.
Hardware description
The hardware of the system is composed of three main modules: sample delivery, DIH, and fluorescent imaging (Fig. 5). The sample delivery module is equipped with two pressure pumps and a microfluidic chip, ensuring a tightly focused sample stream and a controlled flow rate optimal for DIH-fluorescent imaging. The custom-made microfluidic chip features a central sample inlet channel flanked by two sheath flow channels at 45 degrees, to focus the sample to the center of the channel of 200 μm × 80 μm for precise imaging. Customized pressure pumps independently control the main and sheath flows, ensuring minimal flow fluctuation even at rates below 3 µl/min. In this study, the operational flow rates were set to 3 μL/min for the bacteria-spiked sample fluid in the center inlet channel and 6 μL/min for the sheath flow for optimal sample focusing. This sample flow rate will ensure all the particles within the sample stream will be examined by our DIH imaging module considering the specification of our camera and hologram processing speed discussed later. The imaging modules are built on a standard finite conjugate microscope framework. A 405 nm laser diode replaces the microscope’s LED to generate DIH signals, and an additional 488 nm laser diode illuminates the sample to excite fluorescent signals. Both laser diodes are chosen to have low power outputs (<50 mW) and are operated with 1 µs pulse widths per exposure, ensuring that irradiation levels remained significantly below the threshold that causes cellular changes in bacteria, as documented by Cheong et al.34. The short pulse width also effectively prevents image degradation (blurring) due to bacterial movement within the microfluidic channel. The signals are captured through a ×40 imaging objective, then split towards DIH and fluorescent cameras, each equipped with a series of bandpass and dichroic filters tailored to isolate specific signals, i.e., 405 nm DIH and 522 nm fluorescent emission, respectively. Both cameras simultaneously capture images of a 125 × 93 μm2 field of view with a high-resolution of 87 nm/pixel at a rate of 100 frames/s. This magnification ensures a good compromise between image resolution and the throughput required for efficient and accurate bacterial detection and analysis in our system. The imaging focal plane is adjusted to the center of the 80 µm channel depth, ensuring that the bacteria are consistently maintained within a focus range of ±40 µm from the central focal plane. This specific z-focus range is crucial for optimizing the signal-to-noise ratio and maintaining the contrast of holographic fringes, which are essential for accurate bacterial detection and classification.
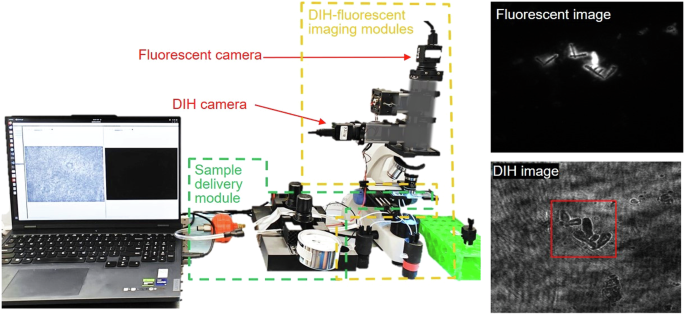
Illustration of digital inline holography (DIH) and fluorescent dual imaging system including DIH imaging module, fluorescent imaging module, and sample delivery module.
Data processing software description
A Python-based graphical user interface (GUI) was developed to integrate hardware control, image acquisition, and data processing. This GUI allows users to adjust flow rates and fine-tune laser power and pulsing settings. It also enables the configuration of camera settings such as sensor size, exposure time, frame rate, gain, and contrast to optimize image quality. Additionally, an image analysis panel is included for real-time image display, bacteria detection and classification using machine learning models, and data archiving for future analysis.
The DIH image analysis undergoes a customizable framework, as depicted in Fig. 6. This framework comprises three main stages: preprocessing, detection, and classification, each tailored to optimize the efficiency and accuracy of our system. In the preprocessing phase, images are first enhanced to eliminate background noise using a moving window background subtraction across 20 consecutive frames. Subsequently, we deploy the YOLOv8n model35, chosen for its swift inference time, to perform preliminary filtering of these enhanced holograms. This model efficiently identifies and isolates frames containing recognizable objects, significantly reducing the volume of data that undergoes more intensive processing. The frames identified by YOLOv8n as containing particles are then processed by the more comprehensive YOLOv8 model, which, although requiring longer processing time, provides a balanced trade-off between inference speed and improved accuracy. This targeted application of YOLOv8 allows for precise localization of particles within the hologram and generates bounding boxes to mark their location and size, ensuring that only relevant data is subjected to further analysis. This two-step approach of employing YOLOv8n followed by YOLOv8 not only minimizes computational resources but also reduces total processing time, enabling real-time performance for efficient and effective particle detection. The final classification stage employs the HRNet36, a high-resolution network known for its accuracy. HRNet classifies each object within the bounding boxes, assigning them to specific particle types based on distinctive holographic signatures, thereby enhancing the precision of our particle characterization. Using our current hardware, our processing framework can analyze holograms in real-time for particle concentrations up to 350 particles/µL, about one particle every three frames. According to US Pharmacopeia standards (USP < 788 > ), PM concentrations for injectable fluids are capped at 0.25 particles/µL for particles ≥10 µm37. Although higher concentrations could theoretically increase processing demands, typical sterile liquid applications rarely reach these levels.
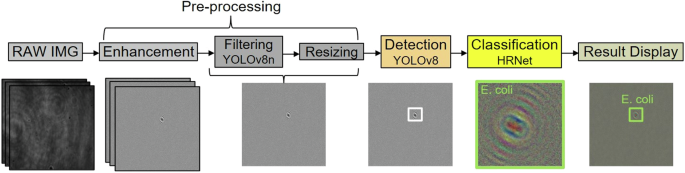
Illustration of the DIH image analysis framework including preprocessing, detection, and classification steps involving three different deep learning models.
Model training
The training dataset for the YOLOv8n model consists of 10,000 labeled particle holograms derived from PMs found in the sterile liquid. These particles (referred to as generic PMs) with average size >2 µm are present in the sterile liquid at very low concentration. This dataset was augmented from an initial collection of 5000 manually labeled experimental holograms and 200 background-only holograms, through processes including random cropping, flipping, contrast and brightness adjustments, and rotations, effectively doubling the original dataset for a robust training process. The YOLOv8 detection model was trained on the same augmented dataset with a specific focus on identifying and localizing the particles within the holograms. The classification HRNet model was trained on a dataset of 4000 labeled holograms for each particle class, including generic particles and various types of bacteria. These holograms were carefully cropped using the detection model to center the particle and include up to the third diffraction fringe for precision. Similarly, the classification model’s dataset was augmented from an original 1000 manually labeled holograms to enrich the diversity of particle morphology and orientations. An additional set of 1000 labeled holograms per class was similarly augmented to create a validation dataset of 2000 holograms, ensuring the model’s accuracy and reliability in classifying different particle types.
Data collection for model training and evaluation
To accumulate training data for our DL DIH approach, we conducted comprehensive experiments using our prototype DIH imaging system. The dataset encompasses holograms from a variety of particles including generic PMs and five bacterial species of distinct morphologies and Gram stain attributes: EC, PA, CJ, EF, and BS. This selection ensures a representative cross-section of rod-shaped, spiral, and spherical bacteria, as well as Gram-negative (EC, PA, CJ) and Gram-positive (EF, BS) types. The bacteria samples were spiked into our sterile liquid at a high concentration, ~108 bacteria/ml, and flowed through our microfluidic chip at a controlled rate of 3 µL/min for consistent sample delivery. The DIH system, operating at a frame rate of 100 frames/s, recorded holographic data over a 10-minute span. The targeted concentration allowed the system to consistently image 2–3 bacteria per frame, given the defined DIH sampling volume. The dead EC samples were created by autoclaving the freshly overnight cultured EC samples for one hour at 121 °C and 15 psi, as outlined by Robertson et al.38. The efficacy of this sterilization method was verified through colony-forming unit plating on LB agar, confirming the absence of viable bacteria post-treatment. From this process, a total of 30,000 holograms of the dead EC samples were acquired, providing a substantial dataset for training and validating the capability of our system to discern between live and dead bacterial states.
In addition to training our DL model, the experimental data gathered from the aforementioned experiments also serve a crucial role in developing a comprehensive synthetic dataset. This dataset is instrumental in evaluating the performance of our DL DIH approach in the Results Section. Specifically, we first identified individual bacteria within experimentally generated holograms, as outlined in the Materials and Methods Section, and isolated the regions surrounding them using bounding boxes. These bounding boxes were sized to contain the bacterial entity and include three sets of diffraction fringes from the center, creating a collection of 10,000 holograms for each type of bacteria and PM. This dataset captures images of the particles at various focal depths and orientations relative to the optical axis of DIH sensor. To generate synthetic holograms, we randomly selected five holograms of particles from each category (bacteria and PMs) and blended them onto experimentally derived background holograms using a gray-scale weighted mean. This method, applied to a diverse background pool of 10,000 experimental holograms, produced highly realistic holograms with accurately known compositions of bacteria and PMs39,40,41.


Responses