Regulated somatic hypermutation enhances antibody affinity maturation

Main
Within germinal centres (GCs), B cells cycle between two zones: the dark zone (DZ) and the light zone (LZ)3,4,5. In the LZ, B cells compete for limited T follicular helper (TFH) cell help, which selects B cells based on antibody affinity for DZ re-entry. The magnitude of TFH cell help determines the level of c-Myc, which regulates both the speed and number of B cell divisions made in the DZ6,7, wherein B cells also undergo somatic hypermutation (SHM) to diversify their antibody genes3,8,9. Since nuclear membrane breakdown during mitosis is essential for DNA mutagenesis, SHM and cell division are closely linked10,11,12. Current understanding suggests that SHM continues at a constant rate per division, so that the highest-affinity B cells, which divide more often, also accumulate more mutations than their lower affinity counterparts13. However, because SHM is random, with most mutations decreasing affinity rather than enhancing it3,8,9,14, B cells dividing the most might disadvantage their progeny by acquiring more mutations. We propose and experimentally test a model in which the survival of high-affinity B cell lineages is enhanced by modulating the rate of SHM per division, allowing B cells with the highest-affinity antibodies to undergo mutation-free proliferative bursts15,16.
Despite the relatively low probability that any one mutation enhances affinity, GC responses can produce 100-fold increases in serum antibody affinity within a short period of time17. This phenomenon led us to investigate how cycles of mutation and selection might be optimized in the GC15. Herein, we sought to determine whether affinity maturation is inherently wasteful with diminishing returns for higher-affinity cells, or whether it includes mechanisms to protect these cells from accumulating affinity-reducing mutations.
Our agent-based model makes the assumptions that competition among LZ B cells is mediated by affinity-dependent acquisition of antigens from follicular dendritic cells (FDCs) (Fig. 1a, (1)), and subsequent selection by TFH cells contingent on antigen presentation (Fig. 1a, (2)). Selected LZ B cells then migrate to the DZ and undergo a programmed number of divisions (D), which is proportional to the magnitude of TFH cell help received (Fig. 1a, (3)). Each division is accompanied by SHM with a probability of mutation (pmut ≈ 0.5)18, where mutations can be silent (psil = 0.5), lethal (plet = 0.3) (such as those that cause loss of B cell receptor (BCR) expression), affinity deleterious (pdel = 0.19) or affinity enhancing (penh = 0.01) on the basis of previously determined experimental and computational probabilities19,20,21. Following division, DZ B cells migrate back to the LZ for further rounds of affinity-based selection and then the cycle starts over (Fig. 1a, (4))6,22,23. A detailed description of the model and the parameters used in simulations can be found in Methods and in Supplementary Table 1.

a, Diagrammatic representation of key processes involved in GC reactions captured by the agent-based model (Supplementary Table 1; Methods). TCR, T cell receptor; pMHCII, peptide major histocompatibility complex II. b, Comparison of the effect of different mutation rates on B cell progeny affinities. Graph shows the number of progeny cells versus the net change in affinity produced after six consecutive divisions in the DZ, assuming a constant (pmut = 0.5 (black)) or a lower (pmut = 0.2 (red)) mutation rate. The net change in affinity is determined by calculating the difference between the number of beneficial mutations and the number of deleterious mutations. Among the 64 possible progeny cells, 25% of B cells exhibit equal or improved affinity in the constant mutation rate scenario, compared with 50% in the decreasing mutation rate scenario. c, Probability distribution of B cell node sizes in the GC for two scenarios: constant pmut = 0.5 (black) and decreasing pmut (red).
Source Data
Due to the relative paucity of beneficial mutations, generation of high-affinity B cells is a rate-limiting step in affinity maturation. Clonal dominance arises in GCs by strong expansion of high-affinity somatic variants from within a clonal family, generating diversified progeny and/or small collections of identical cells that collectively augment affinity maturation16. Despite being observed in various settings16,24,25,26,27, how identical somatic variants are generated or their overall contribution to affinity maturation has not been elucidated. To understand the behaviour of high-affinity B cells and their progeny, we simulated a clonal burst in the case where the mutation probability per division pmut is a fixed value (constant pmut = 0.5) regardless of the prescribed division (D) in the DZ (Fig. 1b). Specifically, we looked at the change in affinity among the progeny of GC B cells undergoing a maximum of six consecutive cell divisions in the DZ (Fig. 1b). In this constant −pmut simulation, progeny of a DZ B cell dividing six times experienced generational degradation of affinity by the accumulation of deleterious mutations19. This, and the added probability of acquiring lethal mutations, predicted that, out of a possible 64 progeny, six divisions produced on average only 27 cells, and that more than 40% of these exhibited lower affinities than their parent. We concluded that clonal expansion at a constant rate of SHM would generate many unfit progeny and would not obviously augment affinity maturation.
To address the problem of ‘backsliding’ or affinity degradation, we explored a scenario where the probability of mutation per division, pmut, is dependent on the magnitude of TFH cell help received in the LZ. Specifically, we considered the case where the mutation probability (pmut) for B cells signalled to divide (D) consecutive times in the DZ, pmut(D), decreases linearly from pmut(D = 1) = 0.6 to pmut(D = 6) = 0.2, which would correspond to a threefold decrease in mutations per division for the progeny of high-affinity B cells. Decreasing pmut for DZ B cells dividing six times resulted in an increased average of 41 progeny cells, with now only 22% of these having lower affinity than their parent (Fig. 1b). Therefore, an affinity-dependent pmut can theoretically facilitate the preferential establishment of high-affinity B cells in the GC, without extensive generational ‘backsliding’ in affinity.
To examine whether affinity-dependent rates of mutation facilitate establishment of expanded high-affinity B cell somatic variants, we employed our agent-based model to study the size of identical B cell clones within the GC. Throughout the simulations, we tracked the mutation history of each B cell, allowing us to identify genetically identical B cells, or nodes (Fig. 1c). We found that, with a constant pmut (Fig. 1c, black), groups of identical B cells did not exceed 15 identical members. In contrast, decreasing pmut with respect to TFH cell help (Fig. 1c, red) produced remarkably larger populations of identical B cells, displaying a long-tailed distribution. Thus, a model in which T cell help modulates mutation rates favours the emergence of large groups of genetically identical high-affinity B cells (nodes).
To experimentally test whether mutation rates are variable, and dependent on both affinity and division rates, we tracked GC B cell division in mice that express mCherry labelled Histone-2b (H2b-mCherry) under the control of a doxycycline (DOX)-sensitive promoter23,28. Lymphocytes from these mice (H2b-mCherry mice) constitutively express the mCherry indicator. Administration of DOX turns off the reporter gene and, upon dividing, cells dilute the indicator in proportion to the number of divisions made, whereas quiescent cells retain the indicator22,23,28 (Extended Data Fig. 1a–c).
To track GC B cell division in vivo, we immunized H2b-mCherry mice with 4-hydroxy-3-nitrophenylacetyl conjugated to ovalbumin (NP-OVA), administered DOX on day 12.5 and assayed mCherry indicator dilution (Extended Data Fig. 2a,b). At 36 h after DOX administration on day 14, 17% of GC B cells were mCherryhigh and 21% mCherrylow, respectively, representing GC B cells that had divided on average one or fewer times or at least six times (Extended Data Figs. 1c and 2b).
To characterize the relationship between SHM and cell division, we purified mCherryhigh and mCherrylow GC B cells from the popliteal lymph nodes of NP-OVA-immunized DOX-treated mice and performed single-cell mRNA sequencing (scRNA-seq) using the 10X Chromium platform. To profile clonality, we used paired immunoglobulin heavy (IgH)- and light (IgL)-chain sequences that resolved families of related cells (clones) derived from common ancestors. Consistent with their higher levels of cell division, mCherrylow populations were significantly more clonal than the corresponding mCherryhigh populations (Fig. 2a and Extended Data Fig. 2c). As surrogates for affinity, we compared the frequency of anti-NP affinity-enhancing mutations (W33L, K59R and Y99G in cells using IgHV1-72 (ref. 29)) and measured NP-fluorophore binding by flow cytometry. On average, GC B cells that had undergone more divisions (mCherrylow) were significantly enriched for cells with affinity-enhancing mutations and measurable NP-fluorophore binding compared with those that divided less (mCherryhigh) (Extended Data Fig. 2d,e). Therefore, cells that divided the greatest number of times showed significantly higher affinity for antigen compared with cells that divided less.
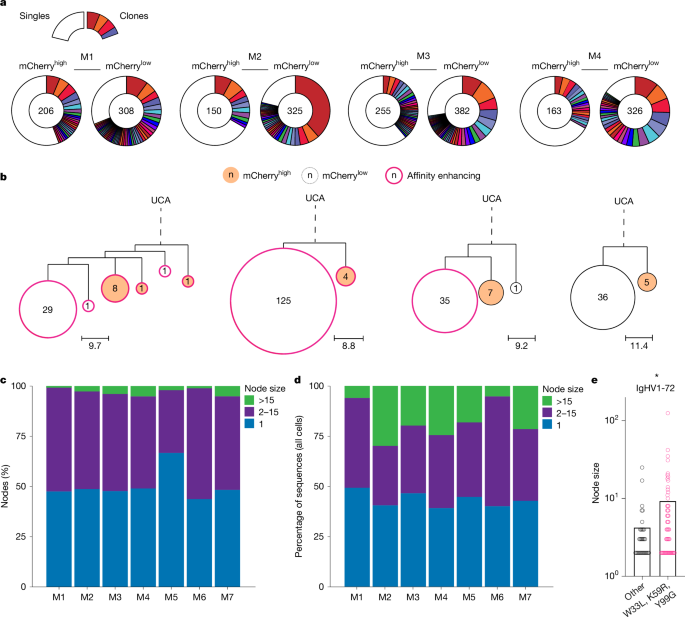
a, Pie charts depicting clonal distribution of antibody sequences obtained from mCherryhigh or mCherrylow NP-OVA elicited GC B cells from four of n = 7 mice analysed (M1–4). Numbers inside charts indicate the total sequences analysed per compartment. Coloured slice sizes are proportional to the number of clonally related sequences; white slices represent singles (sequences isolated only once). b, Representative genotype-collapsed phylogenetic trees containing nodes with more than 15 identical members. UCA (inferred) sequences appear at the root of the tree, connected (dashed line) to observed sequences (nodes) by branching. Sub-branching (solid line) reflects mutational distance between observed sequences (nodes). Scale bars represent mutational distance in nucleotides (per tree). Circle centres display the number of identical sequences in a node. Pink outlined nodes indicate sequences carrying any one of the affinity-enhancing mutations (W33L, K59R, Y99G). mCherryhigh and mCherrylow nodes are filled red-orange and white, respectively. c, Bar graph showing the percentage of nodes containing 1 (blue), 2–15 (purple) or more than 15 (green) identical sequences among expanded clones for each of the 7 mice analysed. d, Bar graph showing percentage of total sequences that contributed to nodes containing 1 (blue), 2–15 (purple) or more than 15 (green) when analysis is extended to all cells (clones and singles). e, Graph displays size distributions of nodes with two or more identical sequences (derived from cells expressing IgHV1-72, paired with a lambda (λ) light chain) for cells with any (pink) or without (black) affinity-enhancing mutations (W33L, K59R, Y99G). *, Welch’s t-test (two-sided) shows significance (P < 0.05).
Source Data
Despite being derived from the same unmutated common ancestor (UCA), expanded clones are heterogeneous, composed of a collection of diversified somatic variants (nodes) that have accumulated additional point mutations due to SHM. Genotype-collapsed phylogenetic trees were produced to visualize the contribution of individual somatic variants to each of the expanded clones (Fig. 2b and Extended Data Fig. 2f)21,30. UCAs are shown at the roots of the trees and are connected to variants through branching, as indicated by dotted lines. Sub-branching (solid lines) illustrates mutational distance between variants. Division, as measured by mCherry dilution and affinity-enhancing mutations (pink outline), were also mapped onto the tree to annotate cell division status and relative affinity (Fig. 2b and Extended Data Fig. 2f).
Our modelling predicts that a constant mutation rate of around 1 × 10⁻³ per base pair per cell division1, equivalent to approximately 50% chance of mutation per division pmut = 0.5, should produce branched trees containing limited small collections of identical sequences (nodes) of 15 or fewer cells (Fig. 1c, black). Alternatively, the decreasing pmut model, with otherwise identical simulation parameters, predicted trees with nodes that extended up to 50 cells (Fig. 1c, red). Analysis of the experimental data revealed trees with nodes comprised of 2–15 members as well as trees with much larger nodes that contained 15–125 identical members (Fig. 2b and Extended Data Fig. 2f). These grossly expanded nodes (more than 15) could not be accounted for by the constant pmut model but were more consistent with the decreasing pmut model.
Among the expanded clones, the fraction of nodes containing either 1, 2–15 or more than 15 genetically identical sequences were 50%, 47% and 3%, respectively (Fig. 2c and Supplementary Table 2). Thus, only a small fraction of all nodes have more than 15 identical sequences. However, when all sequences were considered independently, on average 18% of all GC B cells were found in nodes that carry more than 15 identical sequences (Fig. 2d and Supplementary Table 3). Therefore, mutation-free clonal bursts produce a large assortment of identical progeny that contribute to the GC reaction.
To examine how affinity might impact node formation and size, we compared nodes from IgHV1-72 (heavy chain that is associated with optimal NP-binding activity31) GC B cells that had or had not yet acquired one of the affinity-enhancing mutations (W33L, K59R, Y99G). Larger nodes were enriched among GC B cells carrying affinity-enhancing mutations (Fig. 2e). In conclusion, the experimental data are in keeping with the theoretical model suggesting that the GC reaction is optimized by mutation-free proliferative bursts of cells expressing high-affinity antibodies.
Immune responses to simple haptens like NP might differ from more complex protein antigens. To determine the contribution of mutation-free clonal bursts to immunization with a vaccine antigen, we performed single-cell analysis of GC B cells obtained from draining lymph nodes of H2b-mCherry mice immunized with the receptor binding domain (RBD) of SARS-CoV-2 in adjuvant (Extended Data Fig. 3a). GC B cells obtained 14 days after vaccination, and 36 h after DOX exposure were barcoded according to RBD-binding and mCherry expression, allowing paired analysis of sequence identity, division status and RBD-binding as a surrogate for affinity (Extended Data Fig. 3b). Genotype-collapsed phylogenetic trees were produced using paired IgH- and IgL-chain sequences from expanded clones (Fig. 3a,b and Extended Data Fig. 3c). RBD-binders (RBD+, pink outline), and RBD-non-binders (RBD−, black outline) were annotated along with cells’ mCherry expression (filled) (Fig. 3b). Similar to NP-OVA immunization, we observed large nodes containing identical sequences, indicating that extensive mutation-free clonal bursts occurred during SARS-CoV-2 vaccination (Fig. 3a–c). When only expanded clones were considered, the fraction of nodes with 1, 2–15 and more than 15 identical sequences represented 51%, 46% and 3% of all the nodes, respectively (Fig. 3c,d and Supplementary Table 4). Since large nodes contribute disproportionately, when all cells were considered independently, on average 24% of all GC B cells were derived from nodes that carry more than 15 identical sequences (Fig. 3d and Supplementary Table 5). Notably, the fraction of nodes containing more than 15 identical sequences was always greater among RBD+ as compared to RBD− cells (Fig. 3d,e (P < 0.0001) and Supplementary Table 5).
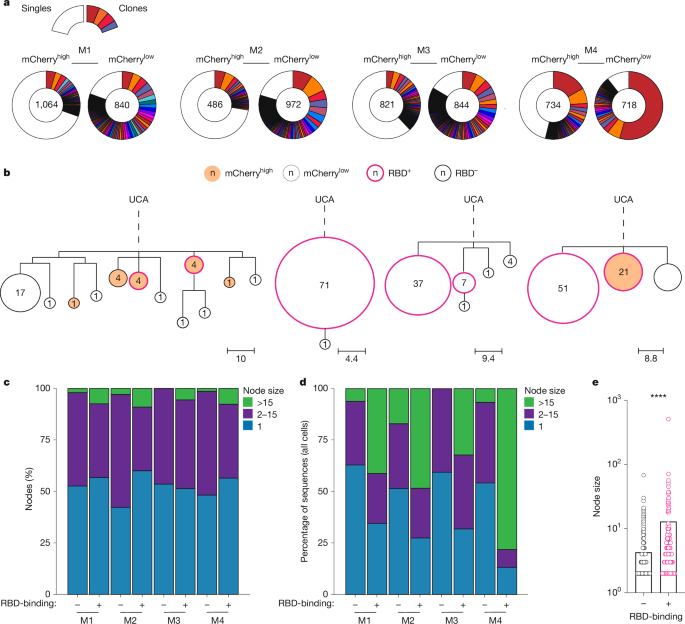
a, Pie charts depicting clonal distribution of antibody sequences obtained from mCherryhigh or mCherrylow RBD-elicited GC B cells from n = 4 of the mice analysed. Numbers inside charts indicate the total sequences analysed per compartment. Coloured slice sizes are proportional to the number of clonally related sequences; white slices represent singles (sequences isolated only once). b, Representative genotype-collapsed phylogenetic trees as in Fig. 2b. Sequences obtained from RBD+ and RBD− sorted cells are outlined in pink and black, respectively. mCherryhigh and mCherrylow nodes are filled red-orange and white, respectively. c, Bar graph showing the percentage of nodes containing 1 (blue), 2–15 (purple) or more than 15 (green) identical sequences in the RBD+ and RBD− compartments among expanded clones for each of the four mice analysed. d, Bar graph showing percentage of total sequences that contributed to nodes containing 1 (blue), 2–15 (purple) or more than 15 (green) identical sequences among RBD+ and RBD− fractions when all cells were considered (clones and singles). e, Graph showing size distribution of nodes containing two or more identical sequences among RBD+ (pink) and RBD− (black) cells. ****P < 0.0001, by both unpaired Student’s t-test, (two-sided) and Welch’s t-test (two-sided, log-transformed).
Source Data
To verify this enrichment and confirm that RBD-binding reliably reports on relative affinity, we produced fragment antigen-binding region (Fabs) templated from cells belonging to RBD+ and RBD− nodes from expanded clones and measured affinity constants (Kd) by bio-layer interferometry (Extended Data Fig. 4a–d). With only two exceptions, RBD+ nodes all produced high-affinity antibodies and RBD− nodes showed little or no measurable affinity. When all Kd values were considered, antibodies from RBD+ nodes were significantly higher in affinity (lower Kds) than those from RBD− nodes (Extended Data Fig. 4d; P < 0.0001). Thus, protein and hapten immunization are similar with respect to production of expanded nodes of high-affinity cells with identical sequences.
To determine whether these effects were adjuvant specific, we profiled GC B cells responding to SARS-CoV-2-mRNA vaccination (Extended Data Fig. 5a). GC B cells were obtained 14 days after mRNA vaccination, and 36 h after DOX exposure and isolated according to mCherry status. Single-cell sequencing was performed to resolve paired IgH- and IgL-chain sequences. Genotype-collapsed phylogenetic trees obtained from the expanded clones confirmed the contribution of large nodes to affinity maturation (Extended Data Fig. 5b,c). Thus, expanded cells with identical sequences arise in GCs elicited by different immunogens and adjuvants.
Profiling mCherryhigh and mCherrylow B cells is useful to compare cells that had divided one or fewer times versus at least six times following DOX exposure. However, as many GC cells were mCherryintermediate, many GC B cells were excluded from this analysis. To assess the contribution of mutation-free clonal bursts to total GC responses, we performed single-cell analysis of all GC B cells responding to RBD vaccination (Extended Data Fig. 6a–c). Consistent with the data obtained by mCherry fractionation, we observed large nodes containing identical sequences that contributed significantly to affinity maturation during SARS-CoV-2-RBD vaccination (Extended Data Fig. 6d–g). As expected, the grossly expanded nodes of B cells with more than 15 identical sequences also contributed disproportionately to the overall number of B cells and were highly enriched within high-affinity (RBD+) clones (Extended Data Fig. 6e–g). Thus, mutation-free clonal expansion contributes to affinity maturation in GC reactions across a range of immunological challenges.
To determine how the experimental data compared with the theoretical predictions we plotted the experimental cumulative distribution function (CDF) of node sizes alongside the simulations (Fig. 4a). Notably, the experimental results were closer to the node size distribution predicted by the decreasing pmut model than the constant pmut model. However, despite the qualitative similarities, the experimental cohorts displayed even longer tails not seen in the decreasing pmut model. We reasoned that this discrepancy might be due to overly conservative assumptions about the maximum number of cell divisions per DZ cycle (six), which was inconsistent with the size of some of the experimentally observed nodes, or the choice of mutation probability for highly dividing B cells. Modestly changing the maximum number of cell divisions from six to eight produced a model that displayed a longer-tailed node size distribution and largely resolved the differences with respect to the experimental results (Fig. 4b, green). This change is more consistent with the experimental data that contained nodes with more than 64 cells in which more than six divisions have probably occurred. Alternatively, preserving the maximum number of divisions at six (D = 6), but decreasing the mutation rate (pmut) linearly from 0.6 to 0.1 in the decreasing −pmut model also yielded a node size distribution consistent with experiments (Fig. 4b, red). In contrast, significantly lowering pmut or, alternatively, extending the number of cell divisions in the constant pmut model from six to eight did not yield a distribution of node sizes consistent with the experimental data (Fig. 4b, black and grey).
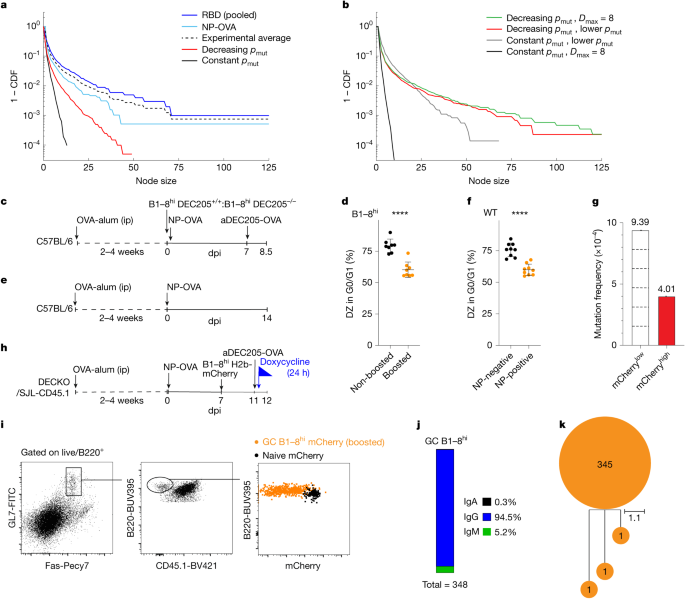
a, Graph plotting CDF of node sizes from model simulations and experimental data. For the decreasing pmut model (red), a linearly decreasing per division mutation probability as a function of number of divisions D from pmut(D = 1) = 0.6 to pmut(D = 6) = 0.2 was used, yielding ({bar{p}}_{{rm{mut}}}=0.48), where ({bar{p}}_{{rm{mut}}}) is the average per division mutation probability experienced. Averages over ten simulation runs are plotted. b, Graph comparing simulated node size CDF for alternate choices in the maximum number of divisions and mutation probability. Decreasing pmut models where the maximum number of divisions is eight, Dmax = 8, with linearly decreasing mutation probability from pmut(D = 1) = 0.6 to pmut(D = 8) = 0.12 yielding ({bar{p}}_{{rm{mut}}}=0.44) (green), and decreasing pmut model with Dmax = 6 but with linearly decreasing mutation probability from pmut(D = 1) = 0.6 to pmut(D = 6) = 0.1 yielding ({bar{p}}_{{rm{mut}}}=0.45) (red) are shown. Constant pmut models with lower pmut = 0.2 (grey) and pmut = 0.5 but with Dmax = 8 (black) are shown. Average over five simulation runs plotted. c, Schematic representation of the experiment used in d. ip, intraperitoneal injection. d, Graph showing percentages of non-boosted B1–8hi DEC205−/− (black) or boosted DZ B1–8hi DEC205+/+ (orange) B cells in G0/G1 among n = 8 mice assayed. ****Unpaired two-tailed Student’s t-test comparing non-boosted and boosted shows significance (P > 0.0001). e, Schematic representation of the experiment shown in f. f, Graph showing percentage of NP non-binding (negative-black) or NP-binding (positive-orange) DZ B cells in G0/G1 among n = 9 mice assayed. ****Unpaired two-tailed Student’s t-test comparing NP-negative and NP-positive fractions shows significance (P > 0.0001). g, Re-analysis of SHM within JH4 intron of mCherrylow or mCherryhigh GC B cells23. Dashed lines indicate divisions. Experiments were performed at least twice, error bars plot mean and s.d. h, Schematic for i–k. i, Representative flow cytometric plots profiling mCherry dilution from B1–8hi H2b-mCherry GC (orange) or naive B cells (black) 24 h after boost; 348 GC B1–8hi H2b-mCherry DEC-205+/+ VH regions sequences were retrieved across the six mice assayed. j, Bar chart interrogating isotype switching. k, Single tree visualizing SHM in VH regions of the 348 sequences. Unmutated sequences appear at the root, and diversified progeny appear as sub-branching. dpi, days post immunization.
Source Data
Finally, we considered whether stochasticity in the constant pmut model could account for the large nodes observed in experimental data. To this end, we simulated the case with stochastic pmut (Extended Data Fig. 7a), and the case where the number of divisions corresponding to a constant level of T cell help was stochastic (Extended Data Fig. 7b). We found that neither scenario could account for the long-tail behaviour of node sizes observed in experiments. Thus, both the theory and experimental data are consistent with the idea that the per division rate of SHM is regulated and decreases with increasing T cell help.
SHM is mediated by the enzyme activation-induced cytidine deaminase (AID)2,14,32,33,34,35. AID has relatively poor catalytic activity and even small changes to AID expression result in changes in the rate of SHM36. To determine whether variable mutation rates in GC B cells were mediated by altered AID expression in expanded nodes, we profiled its expression in NP-OVA and RBD-elicited GC B cells contributing to nodes of sizes 1, 2–15 or more than 15 (Extended Data Fig. 8a–c). Despite the absence of SHM in grossly expanded nodes, there were no significant decrease in Aicda transcript levels in the larger node classes. Thus, differential Aicda expression levels are not likely to be responsible for the absence of mutation in large nodes.
AID introduces C>U mutations at preferential nucleotide sequence hotspots (WRC, W = A/T, R = A/G, underline indicates residue targeted for mutation)37,38. To determine whether absence of SHM in expanded nodes was due to previous loss of these motifs, we profiled AID hotspots between cells contributing to nodes of sizes 1, 2–15 or more than 15. Hotspot motifs were equally intact in cells belonging to all three classes of nodes (average 92%, 93% and 94%, respectively; Extended Data Fig. 8d–f). Thus, target motif decay does not account for differences in SHM between nodes. Finally, we compared the level of cell death among mCherry compartments and found no significant differences (Extended Data Fig. 8g,h).
SHM is cell cycle dependent and limited to the G0/G1 phases of the cell cycle, when AID is in spatial contact with genomic DNA10,11,12,22,23. High-affinity B cells receiving strong T cell help transit through the S phase of the cell cycle faster than their low-affinity counterparts, but the consequences on the G0/G1 phase of the cycle and on SHM have not been examined22. To determine how regulation of the cell cycle might contribute to variable, per division mutation rates, we initially used anti-DEC205 chimeric antibodies to deliver strong selection signals to GC B cells23,39. Congenic DEC205+/+ B1–8hi B cells were adoptively transferred into OVA primed mice that were subsequently immunized with NP-OVA and later boosted with anti-DEC205-OVA chimeric antibodies or left non-boosted (Fig. 4c)39,40. Cell cycle analysis by DNA content revealed that B1–8hi B cells that received strong selection signals (boosted, orange) and experienced a greater number of divisions were significantly less likely to be in G0/G1 than controls (non-boosted, black) (Fig. 4d and Extended Data Fig. 9a).
To determine whether shorter time spent in G0/G1 was a feature of high- versus low-affinity B cells participating in polyclonal immune responses, we immunized OVA primed mice with NP-OVA and measured the cell cycle distribution of DZ cells that bound to NP-fluorescent bait by flow cytometry as a surrogate for affinity (Fig. 4e,f and Extended Data Fig. 9b; P < 0.001). The proportion of DZ NP-fluorophore binding cells in G0/G1 was significantly lower than non-binder DZ counterparts (Fig. 4f, P < 0.001). These results imply that high-affinity B cells cycle through the G0/G1 phase significantly faster than low-affinity B cells, shortening the time for AID mutator activity and thereby decreasing mutation probability per division, thus leading to the long-tailed behaviour of node sizes predicted by the decreasing pmut model and as observed in our experiments. Notably, altering the speed of the cell cycle without changing the per division mutation probability in our simulations does not result in changes to the node size distribution (Extended Data Fig. 10).
To confirm that GC B cells that divide more also mutate less per cell division we re-examined mutation rates in the IgH JH4 intron in DZ B cells from H2b-mCherry mice immunized with NP-OVA (Fig. 4g)23. The IgH JH4 intron was selected because mutations in this region are not subject to selection. We observed that mCherrylow cells that had divided at least six times were only approximately 2- to 2.5-fold more mutated (not the expected sixfold) than their mCherryhigh counterparts that had divided once or less, representing a roughly two- to threefold lower mutation rate per division in cells that undergo several rounds of division in the DZ (Fig. 4g)23.
To determine how the altered cell cycle might impact SHM, we delivered strong selection signals to GC B cells using anti-DEC205-OVA (ref. 22). Congenic DEC205+/+ H2b-mCherry B1–8hi B cells that express high-affinity receptors for NP were adoptively transferred into polyclonal host mice that had been immunized with NP-OVA 7 days previously (Fig. 4h). Approximately 3.5–4 days after the transfer, enough time for B1–8hi B cells to become activated and enter the GC but not enough for the accumulation of SHM41, we administered DOX and anti-DEC205-OVA to track cell division and deliver a strong selection signal, respectively (Fig. 4i)23,39. Although asynchronous, most DEC205+/+ B1–8hi B cells underwent at least two divisions within the 24-h observation period, as compared with naive H2b-mCherry counterparts, as captured by respective mCherry dilution or retention (Fig. 4i). Despite division and class switch recombination, which would have occurred after activation and before GC entry42, B1–8hi IgVH sequence analysis revealed only eight base pairs were mutated in a total 125,628 bases sequenced, generating only three mutated cells out of total of 348 cells (Fig. 4j,k and Extended Data Fig. 9c). Thus, the observed rate is significantly less than the accepted rate of one mutation per 103 bp per division.
Together these data are consistent with the idea that strong selection signals decrease the relative time DZ cells spend in G0/G1, thereby reducing their exposure to AID and lowering their per division mutation rates.
Discussion
SHM is an unusual feature of the antibody system. It is essential for affinity maturation but comes at the high cost of producing off-target DNA damage that can lead to chromosome translocations that are associated with malignancy43,44. Because mutation is random, it is also more likely to decrease antibody affinity than enhance it. Based entirely on theoretical considerations, we predicted that optimizing affinity maturation requires varying mutation rates such that high-affinity antibody-producing B cells that divide a greater number of times should mutate at a lower rate per division. The experimental data presented here support this theory.
SHM is mediated by AID2,32,33. The activity of this enzyme is regulated in a number of different ways including transcription, phosphorylation13,45,46 and nuclear access, the last of which is linked to cell division and specifically to the early G1 phase of the cell cycle after which AID is exported from the nucleus10,11,45,47,48,49. High-affinity LZ GC B cells that receive strong positive selection signals divide more rapidly6 than their lower affinity counterparts22,23. Although other mechanisms may also contribute to decreased SHM, the experimental data suggest that rapidly dividing cells limit mutation in part by spending less time in G0/G1, thereby reducing access of AID to the DNA. In addition to preferentially preserving B cells that express high-affinity antibodies, this mechanism also decreases the likelihood that rapidly dividing GC B cells suffer off-target AID-mediated DNA damage.
Our finding that high-affinity interactions lead to lower mutation rates may contribute to the observation that vaccines or vaccine boosts that select high-affinity antibody-producing cells favour their conservation during clonal expansion and thereby contribute to imprinting or original antigenic sin. Notably, the data suggest that vaccine strategies that aim to diversify immune responses to increase breadth or shepherd antibody responses by sequential vaccination to elicit highly mutated antibodies could benefit from boosting with lower affinity antigens.
Methods
Agent-based modelling of the GC reaction
In the agent-based model, we simplify GC B cells into four distinct states: B cells competing for antigen and TFH signal in the LZ (Fig. 1a, (1)), B cells migrating from LZ to DZ (Fig. 1a, (2)), B cells undergoing proliferation and SHM in the DZ (Fig. 1a, (3)) and B cells migrating from DZ to LZ (Fig. 1a, (4)). To focus on the influence of a help-signal-dependent per division mutation rate on B cell affinity maturation, differentiation of B cells into effector cells and the export of effector cells from the GC are neglected.
Each GC B cell is represented by a vector that specifies its current state and essential parameters, such as BCR affinity for antigen, amount of acquired antigen and mutation history. We update the state of each B cell at every time step, governed by state-specific dynamics. Each LZ B cell (state 1) interacts with an FDC at a maximum rate of rFDC and, upon interaction with an FDC, successfully acquires an antigen with probability pantigen = (1 + e⟨a⟩−a)−1, where a is the affinity of its BCR for the antigen, and ⟨a⟩ is the average BCR affinity of all the B cells in the LZ at the current time step (state 1). If a B cell successfully acquires an antigen, its amount of acquired antigen increases by one unit. Simultaneously, each TFH cell interacts with a random LZ B cell at a rate of rTFH. Upon each interaction event, the TFH cell provides a selection signal to the B cell, where the magnitude of the selection signal D is dependent on the amount of acquired antigen, according to
where Dmax is the maximum number of consecutive divisions allowed in the DZ, A is the amount of acquired antigen, Amin and A0 set the stringency of TFH cell selection and (lfloor ,cdot ,rfloor ) denotes the floor function. If D ≥ 1, D is saved to the vector of the B cell, and the B cell switches to state 2. If a B cell does not acquire sufficient help signal from a TFH cell within its lifetime τB, then it undergoes apoptosis and is removed from the simulation.
Selected B cells in state 2 take a time τLZ→DZ to differentiate from an LZ phenotype B cell to a DZ phenotype B cell before migrating to the DZ, entering state 3. DZ B cells (state 3) divide D consecutive times, where each division takes τdiv to complete. Upon a division event, each daughter cell acquires a mutation with probability pmut(D), which may depend on the magnitude of the selection signal acquired in the LZ. Mutations can be lethal, silent (no effect on affinity), deleterious (decreases affinity by Δa = 1), or advantageous (increases affinity by Δa = 1). The mutation history of each B cell is tracked under the assumption that each mutation is unique (infinite allele limit). After completing D divisions, all surviving progeny switch to state 4, taking a time τDZ→LZ to differentiate back into LZ phenotype B cells, then return to the LZ (state 1).
Simulation details
Each simulation begins with 250 LZ B cells in state 1 and 200 TFH cells, and runs for a period of 20 days using a time step of 5 × 10⁻³ h. Note that the number of TFH cells remains fixed throughout the simulation.
For constant mutation rate simulations, we use a mutation probability of pmut(D) = 0.5 for all D18,48,49, whereas in the decreasing mutation rate simulations, the mutation probability is chosen to be linearly decreasing, for example, between pmut(1) = 0.6 and pmut(Dmax = 6) = 0.2, that is,
Upon a mutation event, lethal, silent, deleterious and enhancing mutations occur with probabilities plet = 0.3, psil = 0.5, pdel = 0.19 and penh = 0.01, respectively19. Simulation parameters are listed in Supplementary Table 1.
Parameter estimation
For the initially studied decreasing pmut model, mutation probabilities pmut(1) = 0.6 and pmut(6) = 0.2 were inferred from experimental measurements by Gitlin et al.23, who found that B cells that underwent approximately six divisions in the DZ accumulated only twice the number of mutations compared with B cells that underwent a single division in the DZ. This implies that B cells undergoing six divisions have a per division mutation probability that is lower by a factor of three compared with B cells that undergo a single division.
The rate at which each TFH cell interacts with a B cell, rTFH, was inferred from the rate at which each B cell interacts with a TFH cell, rB, using the relation
where f is the fraction of cells in the GC that are TFH cells. Equation (3) was derived by assuming that the interaction between any two cells in the GC occurs at a rate rC, which is related to rTFH and rB, respectively, as rTFH = (1 − f)rC and rB = frC. Combining the two expression yields equation (3). A TFH cell fraction of f = 0.15 was assumed to yield rTFH = 0.4 h−1 (Supplementary Table 1).
Mice
Mice were housed at a temperature of 72 °F and humidity of 30–70% in a 12-h light/dark cycle with ad libitum access to food and water. Male and female mice aged 8–10 weeks at the start of the experiment were used throughout. C57BL/6J mice were purchased from Jackson Laboratories. H2b-mCherry mice, B1–8hi and B1–8hi DEC205−/− mice were generated and maintained at Rockefeller University. All mouse experiments were performed under Institutional Review Board approved protocols. Sample sizes were not calculated a priori. Animals were age (6–10 weeks) and sex matched within experiments (both sexes were used between experiments). Given the nature of the comparisons, mice were not randomized into each experimental group and investigators were not blinded to group allocation.
Immunizations and treatments
For NP-OVA immunization experiments, C57BL/6J or H2b-mCherry recipient mice (6–12 weeks old) were immunized with 50 μg of OVA intraperitoneally and boosted 2–4 weeks later via footpad injection with 20 μg NP17-OVA (Biosearch Technologies) both precipitated in alum. For COVID-19 vaccination experiments, C57BL/6J or H2b-mCherry recipient mice were immunized in the footpads with 20 μg monomeric RBD precipitated in alum or received 1 μg of COVID-19 BioNTech (Pfizer) mRNA vaccine intramuscularly and the associated popliteal or inguinal lymph (respectively) were harvested 14 days thereafter.
For H2b-mCherry dilution experiments, mice were administered DOX (doxycycline hyclate, Sigma) by intraperitoneal injection of 2 mg DOX in PBS. Draining lymph nodes were collected for flow cytometric analysis 36 h later. H2b-mCherry dilution was monitored by flow cytometry.
αDEC205-OVA chimeric antibodies were expressed transiently in Expi293F cells using the ExpiFectamine 293 Transfection Kit (Thermo Fisher Scientific). The supernatant was collected 7 days later and the chimeric antibodies were concentrated by ammonium sulfate precipitation. After centrifugation, the pellet was resuspended in PBS and affinity purified on Protein G columns (Protein G Sepharose 4 Fast Flow, catalogue no. 17-0618-05, GE Healthcare); 2 μg of chimeric antibody in PBS was injected into footpads of the recipient mice at indicated time points.
B cell transfer
Single-cell suspensions were prepared from the spleens and lymph nodes of donor mice. Resting B cell suspensions were enriched using negative selection using Magnisort B cell enrichment kit (Thermo Fisher). Approximately 5 × 10⁶ B1–8hi DEC205+/+ B cells: B1–8hi DEC205−/− (5 × 10⁵ Igλ+, NP-specific B cells) composed of the indicated populations were injected into recipient mice by intravenous injection.
Flow cytometry
Single-cell suspensions were stained with antibodies directly conjugated to surface markers. Intracellular stains for DNA content analysis used 2% paraformaldehyde and commercially available permeabilization buffer, coupled to incubation with 4′,6-diamidino-2-phenylindoleantibodies. For RBD-staining, RBD-biotin (in-house) was incubated with Streptavidin (SA)-BV711, SA-PE, SA-BV421 and SA-A647 or 30 min, covered, before addition to suspension. Multi-colour cytometry was performed on the Symphony flow cytometer (BD Biosciences) and analysed with FlowJo v.10.4.2. All cells were sorted on the BD FACSymphony S6 system at greater than 95% purity.
Cell sorting and barcoding
For the mCherry scRNA-seq experiments, individual mice were barcoded separately using commercially available TotalSeq anti-mouse Hashtag reagents. mCherryhigh and mCherrylow fractions were subsequently sorted into separate tubes and indexed and run as separate lanes on the sequencer. All cells were sorted on the BD FACSymphony S6 system and sequenced without enrichment bias.
For scRNA-seq of RBD challenged mice, individual mice were separately barcoded using commercially available TotalSeq anti-mouse Hashtag reagents. RBD-binders and non-binders, were sorted into separate tubes, indexed and run as separate lanes on the sequencer. All cells were sorted on the BD FACSymphony S6 system and sequenced without enrichment bias.
For the B1–8hi scRNA-seq experiment the 10X was run once, but two cohorts of recipients that were treated and harvested separately, totalling six independent mice (CD45.1 or DECKO) used. Sequences analysed were pooled between all six mice and analysed collectively, filtering for sequences derived from the IgHV1-72 knock-in B1–8hi sequence.
Preparation of immunogen bait
4-Hydroxy-3-nitrophenylacetic acid succinimide ester (NP-Osu, Biosearch Technologies) was conjugated to Alexa Fluor 647 Streptavidin (SA-A647) hapten:streptavidin molar ratio of 10:1 or 20:1. Hapten–protein conjugation ratios were calculated by measuring the absorbance value at 430 nm. Purified and Avi-tagged SARS-CoV-2 RBD was biotinylated using the Biotin-Protein Ligase-BIRA kit according to manufacturer’s instructions (Avidity). Biotinylated RBD was conjugated to SA-fluorophores (tetramerized) for use in flow cytometry.
Fab production
Heavy and light chain eBlocks (IDT) were cloned into human Fab and kappa/lambda expression vectors by restriction cloning50,51. His6-tagged Fabs and kappa/lambda light chains were expressed by transient transfection in Expi293F cells (Thermo Fisher Scientific) and purified using Ni Sepharose 6 Fast Flow resin (Cytiva).
Bio-layer interferometry
Bio-layer interferometry assays were performed as previously described10 using the ForteBio Octet Red instrument (ForteBio Data Acquisition software v.11.1.3.25) at 30 °C with shaking at 1,000 rpm. Kinetic analysis using Octet SAX Biosensors (Satorius 18-5117) with biotinylated wild-type RBD and human Fabs was performed as follows: (1) baseline, immersion for 60 s in buffer (1× Octet Kinetic buffer, Sartorius, 18-1105); (2) loading, immersion for 200 s in a solution with 200 nM biotinylated wild-type RBD; (3) baseline, immersion for 200 s in buffer; (4) association, immersion for 300 s in solution with Fabs and (5) dissociation, immersion for 600 s in buffer. Curve fitting was performed using a fast 1:1 binding model and the data analysis software from ForteBio (ForteBio Data Analysis HT v.11.1.3.50). Mean Kd were determined by averaging all binding curves that matched the theoretical fit with an R2 value of at least 0.75.
RNA sequencing
For scRNA-seq of NP-OVA challenged mice, single-cell suspensions were prepared from popliteal lymph nodes on day 14 after immunization. Samples were indexed with TotalSeqC (BioLegend) cell surface antibodies and live, lineage−, B220+, GL7+, Fas+, mCherryhigh and mCherrylow GC cells were purified by flow cytometry and loaded onto a Chromium Controller (10x Genomics). scRNA-seq libraries were prepared using the Chromium Single Cell 5′ v.2 Reagent Kit (10x Genomics) according to the manufacturer’s protocol. Libraries were loaded onto an Illumina NextSeq with the mid-Output Kit (150 paired end) for V-D-J analysis or NOVAseq for single-cell gene expression. Hashtag indexing was used to demultiplex the sequencing data and generate gene–barcode matrices, respectively.
For scRNA-seq of RBD challenged mice, single-cell suspensions were prepared from draining lymph nodes on day 14 after immunization. Samples were indexed with TotalSeqC (BioLegend) cell surface antibodies and live, lineage−, B220+, CD38−, Fas+, RBD− and RBD+ GC cells were purified by flow cytometry and loaded onto a Chromium Controller (10x Genomics). On average, 696 sequences were analysed per mouse.
Single-cell library processing
scRNA-seq and Hashtag-oligos unique molecular identifier quantification were performed with Cell Ranger multi v.7.1.0 (10x Genomics), using the Cell Ranger GEX reference mm10, and analysed in R with Seurat v.4.3.0 (ref. 52). Cells were demultiplexed with MULTISeqDemux, and those classified as doublets or with mitochondrial content greater than 10% and feature count less than 200 or greater than 2,500 were excluded. Sample batches were then merged, scaled and normalized with SCTransform. Single-cell BCR libraries were mapped to the Cell Ranger VDJ GRCm38 reference using Cell Ranger multi v.7.1.0. The contigs containing less than 50 reads and more than one heavy or light chain were removed. For B1–8hi scRNA-seq analysis, only IgHV1-72 heavy chains that derived from the B1–8hi germline knock-in sequence were filtered for further analysis.
Computational analyses of antibody sequences
Single-cell heavy and light chains were paired and analysed using igpipeline v.2.0 (https://github.com/stratust/igpipeline/tree/igpipeline2_timepoint_v2), as previously described53, using the mouse IMGT database as a reference54. The paired IgH and IgL chains of antibodies from the same clonal progeny were merged and aligned to the mouse IMGT germline sequence using mafft v.7.520 with default parameters55, except for –globalpair. Genotype-collapsed phylogenetic trees of clonal lineages were inferred using GCTree v.4.1.2 (https://github.com/matsengrp/gctree)30. Each node represents a unique IgH and IgL combination with number within each node indicating the number of identical sequences. The scales represent the branch lengths, estimated on the basis of the number of nucleotide mutations. AID hotspots regions, characterized by the motif WGCW (W = A/T)56, were mapped systematically across the germline sequences of each clone allowing for overlaps between hotspots. In the antibody sequences, these hotspots were classified as AID-mutated if G>A/C>T mutations were present, unmutated or containing other types of mutations.
Classifications
Clones are defined as cells (clonal progeny) derived from a UCA (naive B cell). Expanded clones are composed of a heterogeneous collection of somatic variants, diversified from a common unmutated ancestor. Nodes within clones are cells with genetically identical IgH and IgL combinations.
Statistical analyses
Statistical tests were conducted using R v.4.2.3 and/or Prism (GraphPad) software. Unpaired, two-tailed Student’s t-tests, two-tailed Fisher’s exact test and one-way analysis of variance with Tukey’s post hoc tests to further examine pairwise differences were used. Data were considered statistically significant at P ≤ 0.05, P ≤ 0.01, P ≤ 0.001 and P ≤ 0.0001. The number of mice per group, number of replicates and the nature of error bars are indicated in the legend of each figure. Centre bars always indicate mean and error bars always plot s.d. or s.e.m.
Ethics statement
All procedures in mice were performed in accordance with protocols approved by the Rockefeller University Institutional Animal Care and Use Committee. All animal experiments were performed according to the protocols approved by the Institutional Animal Care and Use Committee of NIAID, NIH.
Reporting summary
Further information on research design is available in the Nature Portfolio Reporting Summary linked to this article.

Responses