Regulation of erm(T) MLSB phenotype expression in the emergent emm92 type group A Streptococcus
Introduction
The bacterium Streptococcus pyogenes is also known as group A Streptococcus (GAS) based on the Lancefield classification system. GAS is a global pathogen that acts as a causative agent in a variety of human diseases, including pharyngitis, pyoderma, and systemic invasive soft tissue infections (e.g. myositis, necrotizing fasciitis, bacteremia, streptococcal toxic shock syndrome)1. Combination therapy using a β-lactam and protein synthesis inhibitor has become a mainstay for the treatment of severe invasive GAS (iGAS) infections because limiting bacterial toxin production increases survival rates2,3. The recommended treatment for iGAS infections is combination therapy with clindamycin and penicillin4,5,6,7. Despite uniform β-lactam susceptibility of GAS, this bacterium increasingly has gained resistance to other classes of antibiotics8. A major contributing factor, in the US specifically, is widespread dissemination of an MLSB [macrolide (erythromycin), lincosamide (clindamycin), and streptogramin B] resistance phenotype8,9,10,11,12,13. Macrolide resistance in US GAS isolates is frequently attributed to the acquisition of erythromycin resistance methylase (erm) genes through horizontal gene transfer12,14. The plasmid-borne erm(T) gene has been associated with the emerging emm92 iGAS strain, which has been on the rise in the US circa 20109,10,15,16,17,18. This multi-resistant emm92 strain has been associated with iGAS infections in people who inject drugs (PWID) as well as people experiencing homelessness (PEH), indicating the serious threat to these vulnerable populations8,9,10,11,13,19.
The MLSB resistance phenotype is mediated by an erm gene encoding a methyltransferase enzyme that acts on a binding site shared between the three antibiotic classes14,20,21. The target of the methyltransferase enzyme is the A2058 residue of 23S rRNA, which is mono- or di-methylated depending on the erm-gene type21,22. Ribosome methylation functions to inhibit MLSB antibiotics from binding to their active site in the nascent peptide exit tunnel (NPET) of the 50S ribosomal subunit. Expression of erm-encoded enzymes has been shown to be regulated during translation of their leader peptide(s) by the formation of two mRNA hairpin structures upstream of the Erm Shine-Dalgarno (SD) translation initiation sites23,24,25. In the absence of erythromycin, efficient translation of the nascent leader peptide(s) maintains that the Erm-SD sequences are sequestered in the posterior mRNA hairpins, thereby precluding enzyme production. In the presence of bound erythromycin in the NPET, however, reduced translational efficiency effectively stalls the ribosomal complex, thereby permitting the formation of alternative mRNA hairpins without restricting the Erm-SD sites26.
The MLSB phenotype of an isolate is further classified based on whether clindamycin resistance is constitutive or induced by the presence of erythromycin. The majority of studies focused on erm(A), erm(B), and erm(C) have identified mutations in the regulatory region that appear to be responsible for the constitutive (cMLSB) phenotype25,27,28,29,30. Sequence analysis of the erm(T)-gene regulatory region has revealed tentative leader peptide and structural hairpin elements15, yet this has not been a topic of experimental study. Herein, we determined the impact of regulatory region polymorphisms on the degree and timing of erm(T) gene expression, as well as on downstream enzyme activity with and without erythromycin pressure. We modeled the structure of the ErmT protein and identified conserved structural elements and amino acid residues critical to enzyme function. We also evaluated the effects of each MLSB sub-phenotype on bacterial growth and levels of antibiotic resistance in vitro.
Results
We previously characterized the clinicoepidemiology of multidrug-resistant invasive emm92 iGAS infections predominantly affecting PWID in West Virginia9,10. All emm92 isolates had MLSB resistance encoded by the plasmid-borne erm(T) gene, 13% (n = 8) of which had a cMLSB phenotype, while the remaining isolates exhibited an iMLSB phenotype. Here, we hypothesized that isolates with a cMLSB phenotype would have acquired mutations disrupting the normal regulation of erm(T)-encoded methyltransferase expression.
Regulatory region polymorphisms
Regulation of the model erm(C)-gene has been the most extensively studied23,24,31,32, but this knowledge was lacking for erm(T) regulation. The leader peptides of erm(T) and erm(C) differ by a single amino acid, while sequence alignment of the regulatory region for both genes showed 80% identity. As previously demonstrated for mRNA-encoding the erm(C) regulatory region, four inverted repeats, IR1-4, are involved in the formation of two regulatory hairpin structures26. In the absence of erythromycin, the pairing of IR1-2 and IR3-4 forms two corresponding anterior and posterior hairpins, with the latter sequestering the erm(C)-SD2 motif from translation (Fig. 1a). Alternatively, in the presence of erythromycin, a single IR2-3 hairpin forms, releasing the erm(C)-SD2 sequence to initiate translation of the ErmC methyltransferase (Fig. 1b)20,24,26. Similar inverted repeat sequences, presumably forming analogous hairpin structures, were reported in the regulatory region preceding the erm(T) gene (Fig. 1c)15. We analyzed the erm(T) promoter region of 23 clinical emm92 isolates collected from iGAS infections in the state of West Virginia (WV). Amplification and sequencing of DNA fragments encompassing the erm(T)L leader-peptide-encoding sequence through to the 5’ end of the erm(T) gene confirmed the presence of the reported IR1-4 elements and the erm(T)L sequence in the promoter region of all iMLSB isolates sequenced (n = 15). Modeling of mRNA secondary structure formation in the erm(T) regulatory region predicted two hairpins formed by IR1-2 and IR3-4, with overall free energy of −30.40 kcal/mol (Supplementary Fig. 1a). In the presence of erythromycin, the mRNA would be expected to transition to a less favorable IR2-3 structure (−15.80 kcal/mol), where the single hairpin formed would permit enzyme production by freeing the ErmT-SD2 sequence (Supplementary Fig. 1a).
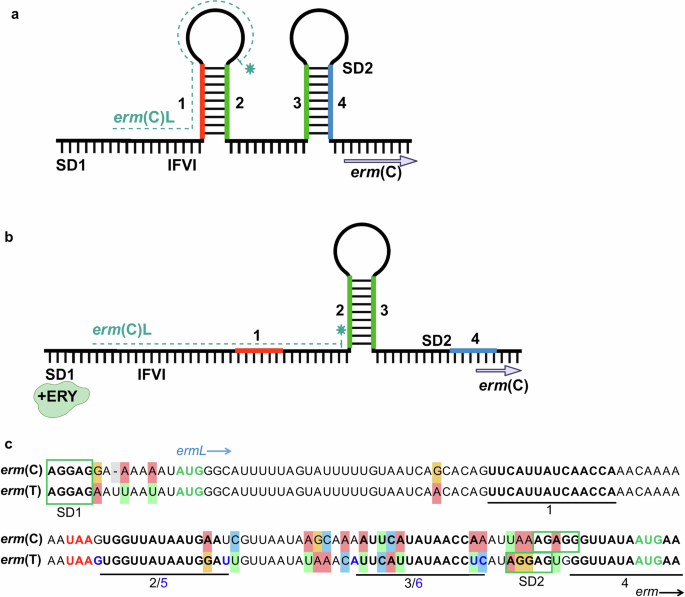
a Reported erm(C) secondary RNA structures in an inactive state in the absence of erythromycin. b Active conformation in the presence of erythromycin (+ERY)-bound ribosomes. Panels a and b were created with BioRender.com. c Sequence alignment of the model erm(C) promoter to the erm(T) regulatory region. For simplicity, we refer to the IR1-4 sequences, although the IR2-3 pairing in erm(T) engages slightly different sequences, i.e. IR5-6, as compared to erm(C). Sequence sources: erm(C)31 and erm(T)15.
To identify whether a cMLSB phenotype was associated with polymorphisms responsible for mRNA structural alterations, DNA-corresponding RNA sequences were aligned with MAFFT to a pRW35 plasmid sequence from an iMLSB emm92 reference strain (EU192194)15, as well as to an iMLSB emm92 isolate from our collection (Figs. 2a, S1–2). Analysis of these sequences identified 4 distinct types of mRNA polymorphisms in the erm(T) regulatory region (Table 1), with three being due to sequence duplication. One cMLSB isolate contains an 18-bp duplication, Dup18, which interrupts the IR2 sequence at the 9th nucleotide. The sequence insertion results in an alternate IR2, referred to as IR2’ (Fig. 2b). We used modeling to predict how this novel regulatory hybrid sequence affects hairpin formation. The duplication results in a structural alteration where IR1 partially pairs with the interrupted IR2 sequence, while the IR2’ element pairs with IR3, forming the new hairpin 2’–3. The IR1-2 and IR2’-3 hairpin structure has an overall predicted free energy of −18.90 kcal/mol (Supplementary Fig. 1b). A longer 30-bp sequence duplication, Dup30, was identified in a different isolate, which is inserted directly after the IR2 sequence. Due to the duplication, two full IR2 sequences are present in the regulatory region resulting in the alternative 1–2 and 2’–3 hairpins with a more favorable free energy of −24 kcal/mol (Fig. 2b, Supplementary Fig. 1c). Four isolates were found to have a “false start” polymorphism caused by a 79-bp sequence duplication, Dup79—encompassing the entire IR2-4 sequence—the duplicated sequence is inserted past the original IR4 (Fig. 2b); this polymorphism results in a structural alteration with the most favorable free energy of −40.80 kcal/mol. Structural modeling predicted that the duplication does not prevent IR1-2 and IR3-4 hairpin formation upstream of the inserted sequence. Instead, the 79-bp duplication supports the formation of the IR2’-3’ hairpin, providing an accessible 3rd SD3 motif followed by the entire erm(T) gene sequence, which should allow translation of the full ErmT protein (Supplementary Fig. 1d). A single cMLSB isolate was found to have undergone a deletion event, Del74, in which the majority of the regulatory region was lost. The 74-bp deletion interrupts the regulatory region immediately following hairpin region IR1 through to the beginning of the erm(T) gene sequence, where the sequence resumes two nucleotides downstream of the erm(T)-gene start codon, resulting in a catalytically active ErmTL-ErmT fusion protein harboring an additional 16 amino acids at the N terminus (Fig. 2b). In addition, one cMLSB isolate had no sequence mutations in the erm(T) regulatory region relative to iMLSB, suggesting that regulation of erm(T) in this isolate is likely controlled by a different mechanism (Fig. 2a, Supplementary Fig. 2).

The sequence is shown for one isolate with each mutation type (see Supplementary Fig. 2 for all sequences). Polymorphism names are indicated as shown in Table 1. a Multiple sequence alignment. Sequences shown are from the top: iMLSB isolates, erm(T) regulatory regions on plasmid pRW3515 and of the emm92 WV-iGAS; cMLSB isolates, no mutations in the promoter region (Nm), and acquired duplications Dup18 (line 4, IR2’-orange arrow), Dup30 (line 5, IR2’-purple arrow), and Dup79 (line 7, IR’-blue lines); and the deletion Del74 polymorphism (line 6). The ErmTL peptide sequence is shown in blue text, whereas the ErmT protein sequence is shown in black (green for the Dup79 isolate shown in line 7). All Shine Dalgarno sequences are shown by a green box, with the start codon annotated in green text and the erm(T)L stop codon in red text. b Schematic representation of sequence polymorphisms in the erm(T) regulatory region, panel created with BioRender.com. The erm(T)L is shown by the teal line with the stop codon annotated by red asterisks. Inverted repeats are shown as gray boxes. Dotted lines indicate polymorphism sections, with the resulting alternate inverted repeats shown as gray boxes with a dotted outline.
erm(T) mRNA transcript levels are associated with MLSB phenotype
Regulation of enzyme production for the majority of Erm proteins studied is thought to occur largely at the translational level20,21,22. Here, we used RT-qPCR and RNA sequencing to assess whether fluctuations in mRNA levels occur after the addition of erythromycin, which is a potent inducer of erm expression21,32. RT-qPCR primers (Supplementary Table 1) were designed to measure how the addition of erythromycin differentially affects the levels of erm(T)-mRNA in the background of distinct leader peptide sequence polymorphisms. We first assessed how the addition of erythromycin at log-phase growth (OD600nm ~ 0.5) affects erm(T) transcripts in an iMLSB isolate after 0.5, 1, and 24 h of exposure to antibiotic using several concentrations (0.05–10 µg/mL) that encompass the therapeutic breakpoints (i.e. susceptible ≤ 0.25 µg/mL; resistant ≥ 1 µg/mL) (Fig. 3a). Comparing erm(T) mRNA fold-change pre- and post-erythromycin exposure, the 0.05 µg/mL concentration did not appreciably affect erm(T) levels (0.52–2.02-fold change in mRNA across all 3 time points). In contrast, there were clear increases in erm(T) transcript levels observed for the remaining concentrations at the T0.5-, T1-, or T24-hour time points. To determine the number of erm(T) transcripts present in different conditions, the erm(T) 2(ΔΔCT) value for the tested emm92 isolates was assessed relative to a susceptible M1 isolate as shown in Fig. 3b (left axis, black box squares). The M1 isolate, which lacks the erm(T) gene, was grown without erythromycin prior to RNA isolation and was used as a negative reference control (ΔΔCT = 0). For the inducible isolate (iMLSB), exposure to erythromycin for 30 min (T0.5) led to a significant increase in erm(T) mRNA levels as compared to T0 (p = 0.0045) (Fig. 3b, black squares). To compare the level of erm(T) induction by erythromycin at the transcriptional level, Fig. 3b shows the fold-change after erythromycin exposure relative to the untreated T0 samples (right axis, blue circles). Erythromycin exposure significantly increased erm(T) transcript levels by 13–20-fold for the T0.5, T1, or T24 time points (p = 0.001) (Fig. 3b, blue circles). An additional iMLSB isolate was tested, which confirmed this trend, as shown in Supplementary Fig. 3.
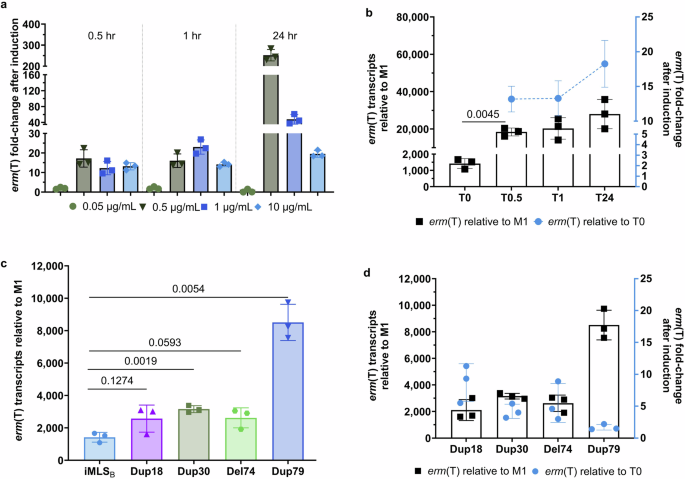
RT-qPCR was performed on RNA isolated from log-phase cultures. a Time- and concentration-dependent changes in erm(T) mRNA transcripts in an iMLSB isolate after exposure to erythromycin. Fold-change is shown relative to erm(T) transcription from an untreated sample for the same isolate. b Exposure-dependent fold-change in erm(T) transcripts for an iMLSB isolate. The level of erm(T) transcripts in an iMLSB emm92 isolate relative to the susceptible M1 control strain is shown after exposure to erythromycin (black squares). Statistical significance is shown for the T0.5 (p = 0.0045) sample compared to T0, as determined using unpaired t-tests with Welch’s correction. Changes in erm(T) mRNA levels after induction are shown relative to an untreated iMLSB sample (blue dotted line), a Brown–Forsythe ANOVA test (p = 0.001) was used to assess differences in erm(T) transcription across the T0.5, T1, and T24 time points. c The number of erm(T) transcripts for iMLSB and cMLSB emm92-type isolates are shown relative to the M1 strain. Statistical significance between the iMLSB versus cMLSB erm(T) mRNA levels was determined using unpaired t-tests with Welch’s correction. d Fold-change in erm(T) transcripts from cMLSB isolates after erythromycin exposure. Changes in erm(T) expression compared to the M1 strain are shown by the black squares. The fold-change in erm(T) transcripts after exposure to erythromycin for 30 min is shown relative to the untreated sample (T0) for each isolate (blue circles). For all data, RNA was isolated from three independent experiments; RT-qPCR reactions were performed in triplicate wells per sample, and results were normalized to the tuf(A) reference gene. Standard deviation was determined by the averaged log2 ΔΔCT values for each biological replicate. GraphPad Prism software was used for statistical analysis and figure generation.
We then assessed how the sequence polymorphisms identified within the erm(T) regulatory region of cMLSB isolates impacted transcript levels. In the absence of an inducing antibiotic, the cMLSB isolates showed higher erm(T) mRNA with 2105–8509 transcripts as compared to the 1665 transcripts for the iMLSB isolate (Fig. 3c). The number of erm(T) transcripts was higher for the Dup18 and Del74 isolates compared to the iMLS isolates; however, this difference was not statistically significant. Altogether, findings indicate that each of the four polymorphisms was associated with high baseline erm(T) expression. In the next experiment, cultures of cMLSB isolates were treated with 10 µg/mL erythromycin for 30 min prior to RNA extraction (Fig. 3d). For Dup18, Dup30, and Del74 isolates, a small, yet measurable (4.2–8.7) mRNA fold-change relative to T0 samples for each isolate was observed following erythromycin exposure (Fig. 3d, blue circles). By contrast, the Dup79 isolates, which showed the greatest number of baseline erm(T) transcripts (n = 8509) (Fig. 3d, black squares), exhibited very little (1.7-fold) change in relative expression after antibiotic induction (Fig. 3d, blue circles). Interestingly, the change in erm(T)-transcript levels following erythromycin exposure—measured for structural alterations with growing lengths in Dup18, Dup30, and Dup79—were inversely correlated to the improved stability of the modeled alternative hairpin structures (−18.90, −24.70, and −40.80 kcal/mol, respectively).
RNAseq analysis supports transcriptional changes upon exposure to inducing erythromycin
To expand on the RT-qPCR data of erm(T) gene expression, we used RNA sequencing to determine the effect of erythromycin on transcription of the erm(T) promoter and coding sequences in an iMLSB isolate and a cMLSB isolate, Dup79. In the absence of erythromycin, we again saw baseline transcription of the erm(T)L- erm(T)-gene region in the iMLSB isolate based on mapped reads (Fig. 4, Supplementary Fig. 4). For the erm(T)L region there were 2223.86 Rlog reads and 30,238.93 Rlog reads for the erm(T)-gene region. Whereas, after erythromycin exposure the number of reads doubled with 3876.39 and 63,411.06 Rlog reads corresponding to the erm(T)L and gene sequences, respectively. The significant increase in overall erm(T)L (p = 1.07 × 10⁻¹²) and erm(T) (p = 1.9 × 10⁻²¹) Rlog reads following erythromycin exposure supports transcriptional coupling to the upregulated protein expression in iMLSB isolates.
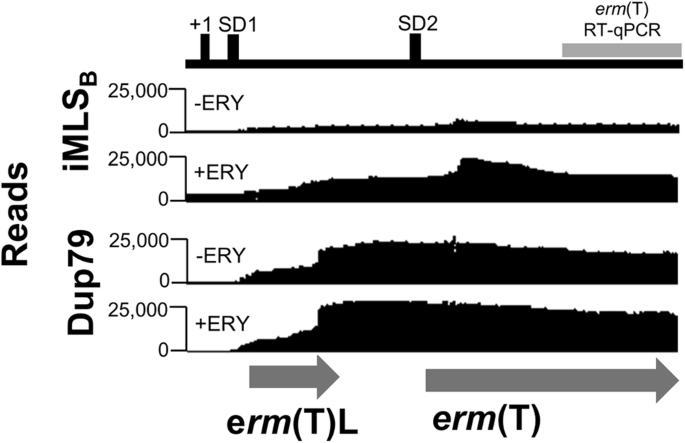
RNA sequencing results were aligned to the pRW35 genome to determine plasmid-borne erm(T) expression at the transcriptional level (Accession #: CP032701)17. Analysis of the erm(T) promoter and start of the erm(T) gene was assessed based on the number of mapped sequencing reads. The level of mRNA mapped to each section is shown for an iMLSB isolate and cMLSB isolate (Dup79). Reads are shown for each isolate without erythromycin exposure for comparison to the number of reads after a 1-h incubation period with 10 µg/mL erythromycin added at log-phase. The erm(T)L and erm(T) open reading frames are shown below (gray arrows). The section amplified in RT-qPCR experiments is indicated by the gray bar. The mapped reads are shown for 1 sample, complete data for three independent experiments are shown in Supplementary Figure 4.
For the cMLSB Dup79 isolate, comparing the expression of the erm(T)L between the untreated versus treated samples revealed no significant difference in expression (p = 0.539), as shown by the mapped reads (Fig.4, Supplementary Figure 4). The number of Rlog reads for the erm(T)L region from the untreated sample (5341.46 reads) versus following erythromycin exposure (5010.45 reads) remained steady. Further, the erm(T)L Rlog reads for the cMLSB Dup79 isolate pre- and post- erythromycin exposure exceeded those of the iMLSB isolate (3876.39 reads), indicating constant expression in cMLSB. Expression of the erm(T) gene is also much higher in the cMLSB isolate, with 113,574.77 Rlog reads in the untreated samples versus 140,772.95 Rlog reads in the treated sample; supporting a background of high-level, constitutive expression imparted by sequence polymorphisms.
Modeling of the ErmT methyltransferase
The structure of ErmT was modeled using AlphaFold2.0 in template mode33. The resulting structure presents a high level of confidence, with pLDDT score >90 (residues 5–244), except for the N-terminal residues, whose structure is not reliable (pLDDT < 60) and is predicted to be flexible34. Consistent with its ErmC’ homologous structure from Bacillus subtilis (77% sequence identity, 89% sequence similarity), the ErmT presents a bi-lobed structure, including a larger catalytic N-terminal domain and an rRNA binding domain (Fig. 5). The N-terminal S-adenosylmethionine (SAM) binding domain adopts an α/β fold, with a central β sheet similar to other methyl transferases34,35 (Fig. 5a). The rRNA binding domain encompasses the concave cleft between the N- and C-terminal domains, and is completely α-helical, consisting of three α-helices. Consistent with its catalytic role, ErmT presents a strongly positive electrostatic surface potential (Fig. 5b). MAFFT alignment of the ErmT and ErmC proteins identified several missense polymorphisms (e.g., K21E or E69K) that we predict did not change ErmT structure (Fig. 5c). Importantly, amino acids involved in SAM and rRNA binding were conserved, thereby, ErmT function was not altered34,36.
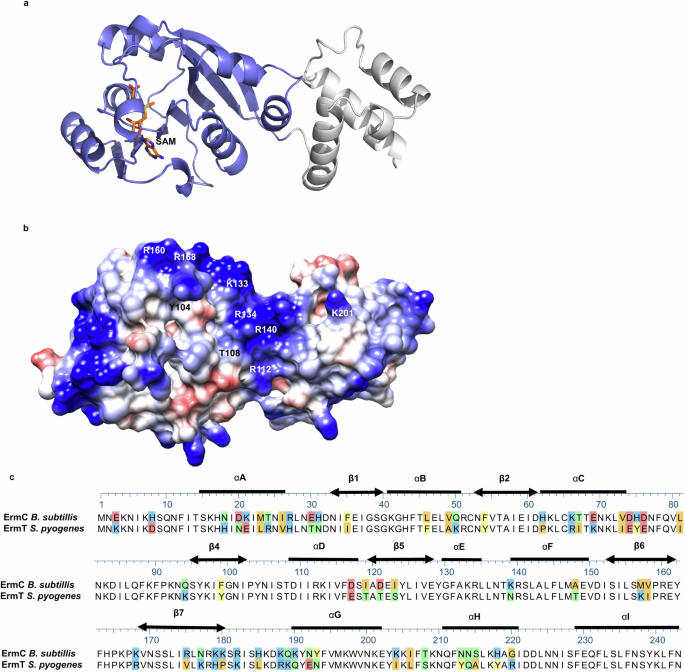
a Cartoon representation of the ErmT structure modeled by the open-access AlphaFold2.0 program. A SAM molecule, docked in the catalytic site, is drawn as an orange stick. The catalytic α/β N-terminal domain encompasses residues 1–181, shown in purple. The C-terminal domain is shown in gray (residues 182–244). b Electrostatic potential of the erm(T) protein model. The positively charged (blue) conclave interdomain between the N- and C-terminal domains represents the residues that were predicted to bind the rRNA substrate34,36. c MAFFT alignment of the ErmC and ErmT protein sequence. The secondary structure elements are shown as thick lines for α-helices and double-headed arrows for β-strands. Colored sections indicate non-conserved residues. The chemistry corresponding to the amino acid classification is shown for each residue as follows: basic (blue), acidic (red), polar uncharged (green), aromatic (yellow), and aliphatic (orange).
Polymorphisms interfere with hairpin formation to induce constant ErmT activity
We next studied how regulation of ErmT translation affects ribosomal methylation in iMLSB and cMLSB isolates before and after exposure to erythromycin. ErmT methyltransferase, catalyzes bi-methylation of adenosine residue A2058 (E. coli numbering) in the 23S rRNA. The m6A methylation detection assay we employed measures percent N6A methyladenosine levels in total RNA samples, as calculated based on the standard curve (Fig. 6). Total RNA extracted from the susceptible M1 strain, which has not acquired erm-mediated resistance, was included to establish the background for the assay. In the absence of erythromycin, RNA samples from iMLSB GAS showed a higher percentage of methylation (0.007%) as compared to the RNA from the untreated M1 strain (0.003%), indicating some basal ErmT-enzyme expression in resistant iMLSB isolates. As expected, the addition of erythromycin induced methylation in the iMLSB isolate, where the percentage of N6A (%N6A on Y axis) methylated RNA more than doubled with an average increase to ~0.017% across the 0.5-, 1-, and 24-h time points (Fig. 6a). Based on these observations, 30 min of exposure was used to assess changes in %N6A methylation for cMLSB isolates. %N6A methylation was detected in similar levels in all cMLSB isolates prior to erythromycin exposure (0.017% average for all cMLSB isolates, (Fig. 6b). This is comparable with the percentage of methylation in the iMLSB isolate after induction with erythromycin (0.017% average across time points, Fig. 6a). RNA methylation levels following erythromycin exposure for 0.5 h remained constant in the cMLSB isolates (0.017% average), further supporting equal constitutive enzyme activity with or without the presence of antibiotic.
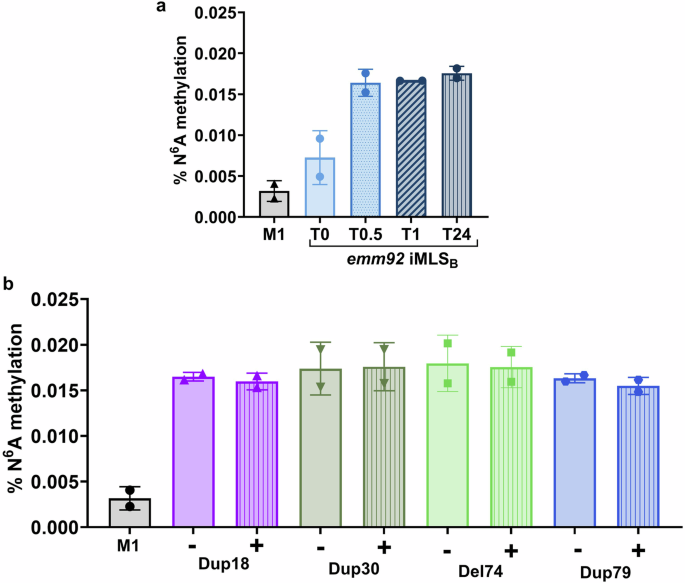
a Ribosomal methylation in an iMLSB isolate. Total RNA was extracted from cultures after exposure to erythromycin for 0–24 h. b Ribosomal methylation in cMLSB isolates. RNA was isolated after a 0.5-h incubation period either without (−) or with 10 µg/mL (+) of erythromycin. For all data, total RNA was isolated from cultures grown to log phase for two biological replicates. The percentage of methylation was calculated based on a standard curve of samples with a known concentration according to the manufacturers’ instructions. Standard deviation is shown for the average of triplicate wells from two biological replicates per isolate. This figure was created with GraphPad Prism software.
Effect of MLSB sub-phenotype on bacterial growth physiology
We consequently assessed how constant ribosomal methylation in a cMLSB isolate affects bacterial physiology as compared to an iMLSB isolate (Fig. 7). In the absence of erythromycin, cMLSB strains exhibited a ~2-h delay in achieving maximal log-phase growth in rich media compared to the iMLSB strain (Fig. 7a, left), thus suggesting a physiological effect of constant ribosomal methylation. When erythromycin was added at the start of the culture (OD600nm ~ 0.05), growth of the iMLSB isolate was markedly stalled for several hours, but the same culture density was reached at the 24-h endpoint (Fig. 7a, right). In the presence of erythromycin, cMLSB isolates lacked this initial lag period and grew comparably well to untreated cultures (Fig. 7a, right). This trend was confirmed for all cMLSB isolates, as facilitated by the identified polymorphisms (Supplementary Fig. 5). When erythromycin was added to the log-phase (OD600nm ~ 0.5) cultures (conditions used for RT-qPCR, RNA sequencing, and methylation experiments), a similar inhibitory effect on bacterial growth was observed for the iMLSB isolate at 10 µg/mL, but not at 1 µg/mL concentrations (Fig. 7b, left). In contrast, exposure to either concentration of erythromycin did not affect the growth rate of the cMLSB-isolate, Dup18 (Fig. 7b, right). To establish the MIC for erythromycin, varying concentrations of antibiotic were added at the start of the culture (OD600nm 0.05), and growth was measured over a 24-h period. Interestingly, the MIC of the iMLSB isolate was >512 μg/mL at the 24-h time point, however, the initial lag in growth was duplicated across all concentrations tested (Fig. 7c, left). As expected, the growth of the cMLSB isolate was unaffected by erythromycin at concentrations up to 512 µg/mL (Fig. 7c, right). Furthermore, we found that the cMLSB isolates had at least 2-fold higher clindamycin MIC of >64 μg/mL compared to the iMLSB isolate (MIC of 32 μg/mL) (Fig. 7d). Taken together, our data suggest that cMLSB isolates have an early but not persistent growth advantage relative to inducible isolates in the presence of high concentrations of erythromycin. Whereas, constant ribosome methylation seems to delay growth to some extent in antibiotic-free media as compared to iMLSB isolates. In addition, these data confirm that standard erythromycin MIC measurements made prior to the full 24-h incubation period may fail to detect resistance imparted by iMLSB strains.
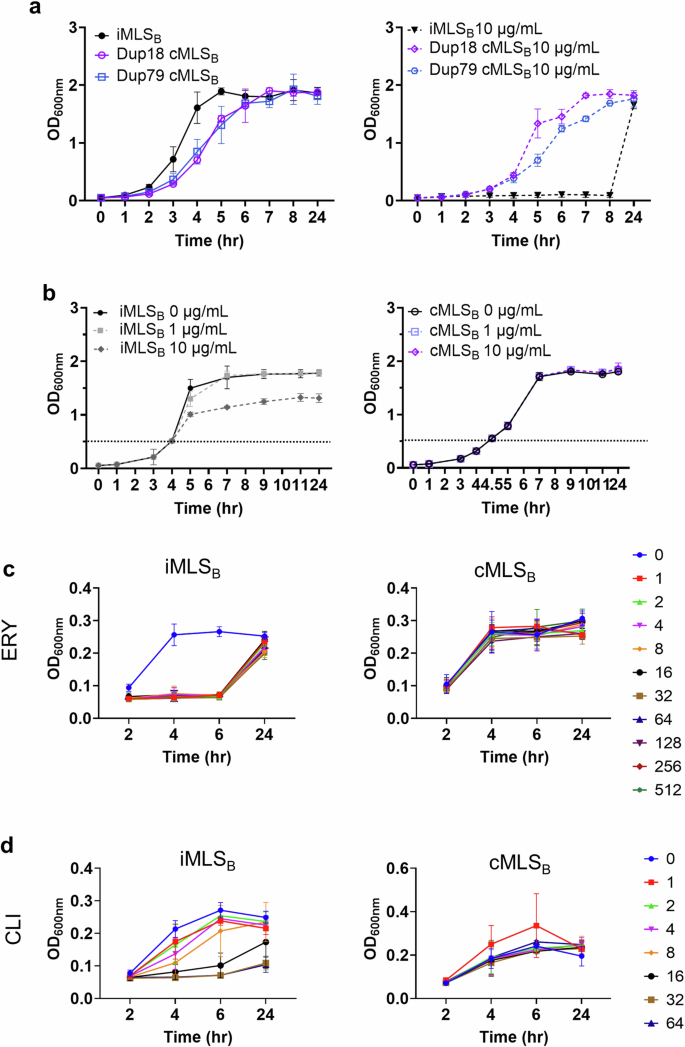
a Growth curves without and with the persistent presence of erythromycin. Erythromycin (10 µg/mL) was added at the beginning of the assay at starting OD600nm ~ 0.05. b Growth curves with the intermittent presence of antibiotics. Erythromycin (10 µg/mL) was added to the log-phase cultures at OD600nm ~ 0.5. Effect of MLSB phenotypes on c erythromycin (ERY) and d clindamycin (CLI) MIC. Varying concentrations of ERY and CLI were added to the starting cultures in 48 well plates with a concentration range of 1–512 μg/mL of ERY or 1–64 μg/mL of CLI for 24 h. Data is from three independent experiments ± sd.
Discussion
In the past decade, the rising incidence of infections by invasive emm92-type group A Streptococcus isolates harboring the erm(T) gene has been associated with emergence in people who inject drugs as well as people experiencing homelessness. Acquisition of the erm(T) gene contributes to the growing rate of erythromycin and clindamycin resistance in GAS, indicating the serious threat of this multi-resistant strain in vulnerable populations. In addition to the emm92 strain, emm77 and emm4 isolates have progressively acquired the erm(T) gene contributing to increased virulence and nationwide emergence12,37,38,39. Despite the increasing threat of MLSB-resistant iGAS infections, an incomplete understanding of the genotype responsible for either constitutive or inducible resistance phenotype persists. Further, experimental evaluation of the regulation of erm(T) gene expression and enzyme structure was lacking despite the alarming expansion of iGAS isolates harboring erm(T). Here we provide experimental rationale for what determines the resistance phenotype of emergent emm92 iGAS isolates carrying erm(T) and how it affects bacterial physiology with potential impact on patient outcomes.
To the best of our knowledge, we were the first to assess the effect of polymorphisms on both transcription and methylation. Our transcriptional data, RT-qPCR and RNA sequencing support the proposed model of erm(T) gene expression that translation-transcription coupled regulation exists in iMLSB isolates (Fig. 8a), whereas sequence polymorphisms mapped in cMLSB isolates dysregulate this mechanism (Fig. 8b). In the non-induced state (−ERY), the formation of IR1-2 and IR3-4 hairpins largely silences erm(T) gene transcription and ErmT enzyme expression in iMLSB isolates, albeit with some degree of “leaky” (low-level, baseline) expression occurring. The addition of erythromycin stalls ribosomes at the IFVI motif of the erm(T)L leader peptide, which allows hairpin IR2-3 to form, resulting in rapid full erm(T) induction and high levels of mRNA transcripts. In contrast, duplication/deletion sequence polymorphisms identified in cMLSB isolates allow efficient transcription of the full erm(T) coding sequence with or without erythromycin binding, as indicated by transcription data and ribosomal methylation data. The main effect of the Dup18 and Dup30 polymorphisms is that both sequence duplications champion energetically altered structural alteration where an IR2’-3 hairpin forms to constitutively make the erm(T)-SD2 sequence accessible for translation (Fig. 8b). The 79-nucleotide repeat, Dup79, encompassing the IR2-4 sequence provides an alternate downstream SD3 site for erm(T)-gene translation. The deletion of 74 base pairs (Del74) encompassing the IR2-4 segment resulted in the constitutive expression of the catalytically active ErmT variant with an extended amino terminus by the additional 16 amino acids.
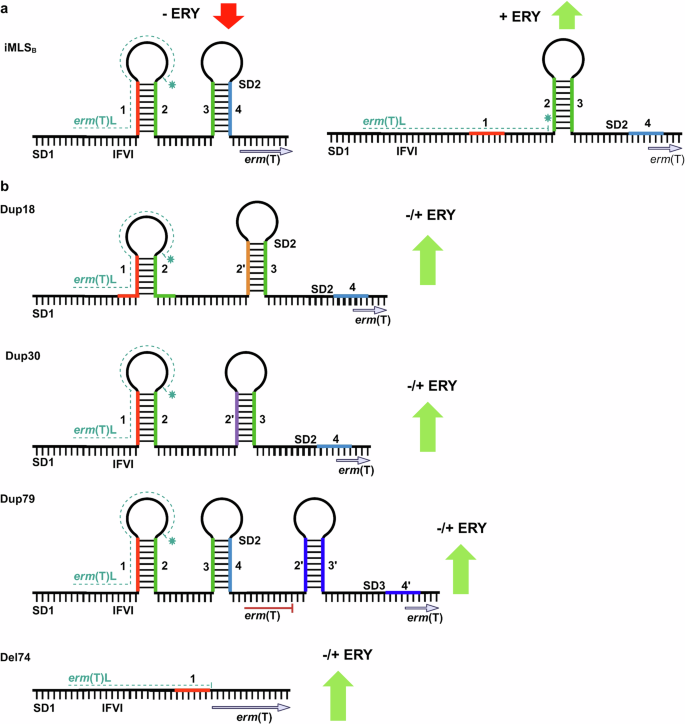
a Secondary RNA structures of inactive (left) and active (right) states in iMLSB isolates. Effect of polymorphisms on transcription and enzyme activity of the erm(T) methyltransferase (as indicated by red or green arrows). b Secondary RNA structures of active state in cMLSB isolates. Structural alterations due to sequence polymorphisms and target site methylation (green arrows) in the absence/presence (±ERY) of an inducing antibiotic are shown. Figure created with Biorender.com.
The genetic relationship between erm(T) and erm(C) genes, indicated that the coding sequences were closely related and located within the same clade on the phylogenetic tree22. Our structural modeling of the ErmT enzyme showed that the cofactor-S‐adenosyl‐l‐methionine (SAM) and rRNA-binding regions are conserved as compared to the ErmC crystal structure from Bacillus subtilis34. Conservation of Erm enzymes supports the potential for the development of compounds that inhibit their activity, thus targeting MLSB resistance in various bacterial pathogens, including Mycobacteria and Staphylococcus aureus,28,40,41,42, as well as erm(T)-harboring emerging iGAS strains of the emm92, emm4, and emm77 type12,39. However, the SAM binding site has been shown to be similar across eukaryotic and prokaryotic S‐adenosyl‐l‐methionine‐dependent MTases, thus increasing the potential risk for off-target effects of compounds developed to inhibit SAM binding34,35,43. Therefore, blocking the 23S rRNA binding site on Erm enzymes may be a more promising alternative approach36.
In S. aureus, erm(C) function was optimally induced at a 10−8–10−7 M (~0.01–0.1 μg/mL) concentration range of erythromycin with opposite effects outside of this range44. Therefore, we tested a concentration range of 0.05–10 µg/mL of erythromycin to establish the optimal concentration for erm(T) induction in an iMLSB isolate. In emm92 iGAS, a 0.05 μg/mL concentration did not effectively induce erm(T) transcription up to 24 h post-exposure. In contrast to erm(C), a 10-fold higher concentration of 0.5 μg/mL, was needed to induce erm(T) expression. Furthermore, exposure to much higher 0.5–10 μg/mL concentrations of erythromycin upregulated erm(T) expression, showcasing differences in the sensitivity of induction between erm genes, which may partially be influenced by the recipient organism.
Natural sequence polymorphisms in the regulatory regions of erm(A), erm(B), and erm(C) genes have been associated with a cMLSB resistance phenotype25,27,28,29,30,45. Interestingly, a study by Rosato et al. showed that of the ermB promoter sequences analyzed, only a fraction had mutations that would explain the cMLSB phenotype, indicating that alternative mechanism(s) contribute to MLSB phenotype expression29. Here, we report a singular emm92 isolate with a cMLSB phenotype that had no sequence polymorphisms in the promoter region and was confirmed to have constitutive erm(T) expression by RT-qPCR/RNAseq and methylation experiments, which further points to the presence of supplementary regulatory mechanism(s). Unlike erm(K), the erm(T) regulatory region does not contain a traditional Rho-independent terminator sequence that could regulate erm gene expression at the level of transcription46,47,48. However, other reports identified sequence similarities between the erm(C) regulatory region and the bacterial attenuators that could be involved in the transcriptional regulation of several amino acid synthesis pathways, e.g., tryptophan, as its production is regulated at the transcriptional level in addition to secondary mRNA structures31,49. Others indicated the potential for autoregulation of erm translation through binding of the erm(C) enzyme to the IR3-4 loop sequence or observed that erythromycin or clindamycin exposure extended the half-life of erm(B) mRNA in an E. coli model, further underscoring the complexity of erm regulation45,50. Altogether, existing literature implies that apart from the well-studied regulation by mRNA hairpin structures, additional regulatory mechanism(s)—including regulatory protein(s), transcription factors, small-noncoding RNAs, etc.—should be investigated to explain how isolates that lack mutations in the erm(T) regulatory region sequence exhibit a cMLSB phenotype.
In our WV-iGAS collection, the MLSB sub-phenotype differed based on emm-type and the acquired erm gene, where a cMLSB phenotype was more common in isolates with erm(B) (~65%) compared to those with erm(A) (10%) or erm(T) (13%)9,10. This contrasts with several reports of group B streptococcal isolates from various infections in which a cMLSB phenotype was observed in up to 80% of isolates51,52. The general consensus is that erm expression and subsequent rRNA methylation results in a fitness cost, hence the need for tight regulation of Erm protein production (for review, see ref. 20). In S. aureus cultures, exposure to 25 µg/mL of erythromycin for 15 min drastically affected the bacterial proteome53,54,55, whereas erythromycin added here to iMLSB emm92 culture doubled ribosomal methylation in half an hour and was accompanied by a significant lag in bacterial growth. In the absence of erythromycin, an S. aureus strain, transformed with a plasmid harboring an inducible erm(C) allele outgrew, in 50:50 mixed culture, an isogenic parental strain expressing a constitutive erm(C) allele, although fitness in response to antibiotic challenge was not tested53. While we did not directly test iGAS fitness in a competition assay, we observed a slower growth rate of cMLSB isolates without antibiotic pressure in a rich medium compared to the iMLSB isolate.
Altogether, here we studied the control mechanisms that regulate the expression of the erm(T) methyltransferase gene, which was acquired by GAS via horizontal transfer and led to the emergence of an invasive emm92 clone predominantly affecting people who inject drugs. We show sequence polymorphisms in the erm(T) promoter region that lead to a cMLSB phenotype in iGAS. Co-translation regulation in iMLSB isolates is coupled with fluctuating erm(T) transcription levels and a shift in ribosomal methylation. Our experimental data shows that emm92-iGAS isolates with a cMLSB phenotype have higher clindamycin resistance in vitro, although the clinical relevance of this observation has not been established. Similarly, the in vitro lag in the growth of iMLSB isolates in the presence of erythromycin may affect initial treatment outcomes as compared to cMLSB isolates.
Methods
Bacterial isolate collection data
The group A streptococcal isolates used in the present study were collected between January 2020–January 2023 and characterized epidemiologically as described elsewhere9,10. Isolates were emm-typed according to the CDC protocol. For all 61 emm92 isolates, antimicrobial susceptibility testing was performed by disc diffusion using methods and quality control criteria described by the Clinical Laboratory Standards Institute (CLSI M100-S31). Briefly, disc diffusion and D-testing were performed on 0.5 MacFarland bacterial cell suspensions prepared from isolated colonies and inoculated for confluent growth on cation-adjusted Mueller Hinton agar with 5% sheep blood (BBL, Becton-Dickinson, Franklin Lakes, NJ), using disks (BD) containing 15 µg erythromycin and 2 µg clindamycin. Plates were incubated at 35 °C in 5% CO2 for 20–24 h before measuring the zone of inhibition with a manual caliper in reflected light. Zone diameters were interpreted using CLSI clinical breakpoints, and any degree of clindamycin zone flattening in proximity to the erythromycin disc was interpreted as a positive D-test result. D-test positive isolates were considered inducible (iMLSB), while isolates with confluent growth around both disks were reported as constitutive (cMLSB) resistance sub-phenotype. Resistance determinants were identified for each isolate, where all 61 emm92 isolates harbored the erm(T) gene on a plasmid9,10. The emm1-type MGAS5005 isolate was used as a control in some experiments56. Control strains from the CDC collection were used to verify primers shown in Supplementary Table 1.
Plasmid DNA isolation and sequence analysis
Plasmid DNA was isolated, from bacteria grown overnight in Todd-Hewitt yeast (THY) media, using the Gene JET Plasmid Miniprep Kit (Thermoscientific) with an additional cell-digestion step (1 mg/mL lysozyme and 50 U/mL mutanolysin) at 37 °C for 1 h, followed by treatment with 10% SDS for 20 min at 65 °C. Plasmid DNA was used as a PCR template with erm(T)-specific primers (Supplementary Table 1). PCR products encompassing the erm(T)-gene regulatory region were generated from all eight cMLSB isolates and a representative number with the iMLSB phenotype (n = 15), followed by Sanger sequencing. All sequences were aligned to the reference sequence of the pRW35 plasmid identified in emm92 iGAS15 using Lasergene DNAStar MegAlign17 software. The MAFFT alignment algorithm was used to detect point mutations, as well as insertions and deletions.
Structural modeling and free energy calculation of RNA secondary structures
The three-dimensional structure of ErmT was computed using the Colab server (https://colab.research.google.com/github/sokrypton/ColabFold/blob/main/AlphaFold2.ipynb). This server predicts protein structures starting from their sequences using a slightly simplified version of AlphaFold v2.0 (AF)33. The reliability of the AF predictions was assessed by the local distance difference test (LDDT) score. The predicted pLDDT score (0–100) is a per-residue confidence score, with values greater than 90 indicating high confidence, and values below 50 indicating low confidence. Structures were analyzed and displayed using PyMOL57 and ChimeraX58. The secondary structure and overall free energy for RNA segments of the erm(T) regulatory region were predicted by the ViennaRNA tool. The predicted secondary structure was analyzed by the RNAFold WebServer tool for structure visualization and the strength of base pair probabilities.
RNA isolation
Overnight GAS cultures were grown on brain–heart infusion (BHI) agar at 37 °C in 5% CO2 and were used to inoculate THY liquid medium at a starting OD600nm of 0.05 and grown to 0.5, at which point half of the culture was treated with various concentrations of erythromycin. Cultures were then incubated for an additional 30 min. RNA was stabilized in the Qiagen RNA protect bacterial reagent; cell pellets were stored at −80 °C prior to use. Total RNA was isolated from three independent samples with the rBAC Mini Total RNA kit (IBI Scientific) per manufacturer’s instructions, with an additional cell-digestion step (1 mg/mL lysozyme and 50 U/mL mutanolysin) at 37 °C for 1 h, followed by treatment with 10% SDS for 20 min at 65 °C. DNA trace was removed by DNase I treatment with a TURBO DNA-free kit (Invitrogen) and sample concentration and purity were assessed spectrophotometrically and on agarose gel.
RT-qPCR
The iScript Select cDNA Synthesis kit (BioRad) was used for cDNA synthesis with 1 µg of total RNA used for the starting template. SYBR Green Master Mix (BioRad) was used in RT-qPCR reactions with either erm(T)- or tuf(A)-specific primers (Supplementary Table 1); expression of the erm(T) gene was normalized to the tuf(A) housekeeping gene59. Fold-change was determined by the log2 ΔΔCT method relative to two conditions. Expression of the erm(T) gene was first made relative to the M1-type strain, which lacks the erm(T) gene. The induction fold-change after exposure of emm92 cultures to erythromycin was determined relative to the number of erm(T) transcripts in non-treated samples. Data is shown for three independent experiments, each performed in triplicate wells.
RNA sequencing
Total RNA was isolated as described above from cultures treated with 10 µg/mL of erythromycin for 1 h. Following DNAse I treatment, RNA samples extracted from three independent experiments were sent to Admera Health for quality assessment and sequencing. The QC value for each sample was assessed by Agilent tape station. The QIAseq FastSelect rRNA 5S/16S/23S (Bacteria) kit was used to deplete ribosomal RNA from samples. This was followed by library preparation with the NEB Ultra II Directional RNA Library Prep kit. The library was sequenced in the PE150 format with 60 million paired-end reads per sample. The Galaxy bioinformatics server, https://usegalaxy.org/, was used to analyze read quality (FASTQC, MULTIQC)60. All downstream data analysis was performed with Lasergene DNAstar software. Reads were mapped to the TSPY556 genome (NCBI: Accession #: CP032700) and the pRW35 plasmid genome (Accession #: CP032701) using the DNAstar SeqMan NGen program. The reads mapped to the erm(T)L- and erm(T)-gene sequences were visualized with the GenVision Pro program. Differential gene expression and Rlog reads were assessed by DESEQ2 analysis using the same software.
Quantification of N6A -methylation
Total RNA was isolated from cultures as above. The EpiQuikTM m6A RNA methylation quantification kit (EPIGENTEK) was used to determine differences in total N6A methylation; 200 ng of RNA was used in each triplicate well in the assays. Methylation calculations were based on a standard curve generated from readings of known samples included in the assay kit. The assay was duplicated for analysis of standard deviation.
Growth curves
Overnight cultures on BHI agar at 37 °C in 5% CO2 were used to inoculate THY medium at a starting OD600nm of 0.05 in Erlenmeyer flasks, with (10 µg/mL) or without erythromycin. Alternatively, overnight cultures on BHI agar were used to inoculate THY medium in Erlenmeyer flasks to a starting OD600nm of 0.05 and grown to log-phase (OD600nm of 0.5), then split into three flasks, each supplemented with either 0, 1, or 10 µg/mL of erythromycin. Growth was measured according to spectrophotometric absorbance at OD600nm over a 24-h period. Each assay was repeated in three biological replicates for analysis.
Overnight GAS cultures grown on BHI agar at 37 °C in 5% CO2 were used to inoculate THY medium at a starting OD600nm of 0.05 in 48-well plates, with varying concentrations of erythromycin and clindamycin added at the start of culture. Bacterial growth was measured spectrophotometrically at OD600nm over a period of 24 h. For each concentration, growth was averaged from triplicate wells, and each assay was repeated in three biological replicates for analysis.
Statistical analysis
Statistical analysis of data was performed using the GraphPad Prism software v10. Data from three biological replicates were used for statistical analysis using an unpaired t-test with Welch’s correction or ANOVA unless otherwise stated. The means ± standard deviation are presented for all data.
Responses