Relationships of eating behaviors with psychopathology, brain maturation and genetic risk for obesity in an adolescent cohort study
Main
Eating disorders (EDs) are serious psychiatric disorders with high mortality rates, substantial impacts on quality of life and economic burdens1,2. Their increasing prevalence3,4, particularly during mid-adolescence5, highlights the need for early detection and effective interventions.
Key risk factors for EDs include eating behaviors such as dietary restraint and overeating, which increase the risk for unhealthy weight control behaviors and EDs like bulimia nervosa and binge ED6. Assessments of eating behaviors in various population groups7,8 indicated that cognitive restraint (CR), the conscious restriction of food intake to control body weight and shape, can lead to episodic overeating and is a strong predictor of disordered eating and negative body image. Conversely, uncontrolled eating (UE) (which refers to eating in response to food palatability, social cues and hunger, resulting in eating episodes) and emotional eating (EE) (eating episodes elicited by negative affect) is associated with increased susceptibility to EDs, hedonically driven food choices, higher body mass index (BMI) and obesity. Genetic studies indicate that these behaviors may be partially genetically determined, with obesity-associated variants linked to CR, UE, EE9, and eating behavior trajectories in childhood10 and adolescence11.
Neural factors also play a role in EDs12, with neurobiological differences observed in clinical samples13,14,15,16,17. Neurobehavioral correlates suggest that the hypothalamic, emotion/memory and executive systems are involved in eating control18,19. Neural activation of lateral prefrontal structures underpinning self-control and decision-making and striatal reward regions has been shown to underlie individual differences in CR20. Longitudinal studies have revealed volumetric brain differences, particularly in striatal and prefrontal regions, which suggest that differences in brain maturation may be etiological factors for disordered eating behaviors and comorbid depressive symptoms21.
Internalizing and externalizing psychopathology symptoms may serve as premorbid risk factors for EDs22,23,24. Externalizing problems (EPs) in early adolescence predict the onset11 and persistence of eating pathology25, whereas generalized anxiety symptoms predict adolescent-onset ED26. Negative affect and functional impairment are found to predict the onset of all EDs6,27. However, how trajectories of adolescent maladjustment, as evidenced by internalizing problems (IPs) and EPs, relate to eating behaviors, genetic liability and brain maturation is not well understood.
This study aimed to advance our understanding of eating behaviors by analyzing longitudinal data from the IMAGEN adolescent cohort. Applying a multivariate analytical framework, the study identified eating profiles at age 23, characterized by associations with polygenic scores (PGSs) for higher BMI, and differences in earlier trajectories of disordered eating, IPs and EPs, and brain maturation. The mediating roles of brain maturation and BMI PGS were also investigated using multivariate models. The analytical workflow is illustrated in Fig. 1.

EE, emotional eating; UE, uncontrolled eating; RE, restrictive eaters; E/UE, emotional and uncontrolled eaters; HE, healthy eaters; IP, internalizing problem; EP, externalizing problem; GMV, gray matter volume; CT, cortical thickness; SD, sulcal depth; BMI, body mass index; PGS, polygenic score. Regions 1 and 2 represent brain areas that showed a significant age-by-group interaction in their trajectory comparisons.
Results
Identification of groups with distinct eating profiles
A total of 996 participants (478 male and 518 female participants) with completed Three-Factor Eating Questionnaire (TFEQ) scores at age 23 and who had at least 1 measure from the Strengths and Difficulties Questionnaire (SDQ) available at ages 14, 16, 19 and 23 were included in this study (Methods). Three groups were identified from K-means clustering analysis with distinct eating behaviors (Fig. 2a and Table 1). The group distribution and within-group sum of squares are detailed in Supplementary Fig. 1. Validity and stability analyses confirmed the 3-group solution with Jaccard similarities of 0.83, 0.77 and 0.75, respectively. One group (N = 423) scored low on all eating behaviors, indicating healthy eaters (HEs). Another group (N = 324) showed the highest CR, indicating restrictive eaters (REs). Behaviors that differentiated REs the most from HEs (odds ratios > 5) included consciously eating less to control weight and weight gain, the intensity of restrained eating, consciously eating less than desired and not eating foods that made them fat (Supplementary Information). This group also scored significantly higher than HEs on UE. The 3rd group (N = 249) showed the highest EE and UE, indicating emotional and uncontrolled eaters (E/UEs). Behaviors that distinguished E/UEs the most from HEs included eating/overeating when feeling blue, lonely or anxious (all EE items), inability to stop eating and frequency of binge-eating episodes (UE items). This group also reported significantly higher CR than HEs. REs and E/UEs comprised predominantly female participants, contrasting with HEs, which had a higher proportion of male participants. Consistent with differences in BMI, the BMI PGSs were higher in REs and E/UEs than in HEs (Table 1).
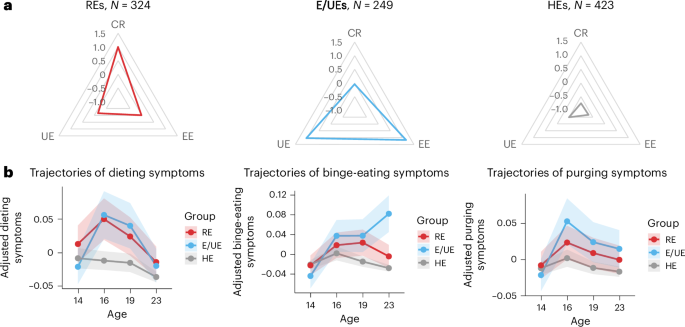
a, Three groups of distinct eating behavior profiles were identified by K-means clustering at age 23. The radar charts show the average standardized scores for CR, EE and UE across these groups. b, Trajectories of ED symptoms (dieting, binge eating and purging symptoms) from ages 14 to 23 across the 3 identified groups. Data are presented as mean values ± 95% CIs. The points along the lines represent the mean symptom scores at each time, and the shaded areas show the 95% CIs. Analyses were adjusted for sex and recruitment sites. The y axis indicates the adjusted symptom scores after regressing out the effects of sex and recruitment sites.
Group differences in ED symptom trajectories in adolescence
Linear mixed models were applied to investigate group differences in trajectories of ED symptoms (dieting, binge eating and purging) from ages 14 to 23. Analyses of age-by-group interactions were used to identify symptom trajectories that differed in the RE or E/UE groups compared with HEs (Fig. 2b and Supplementary Tables 1 and 2). REs were characterized by significantly (P = 0.006) higher overall levels of dieting compared with HEs, with no significant age-by-group interactions. Trends toward increased dieting from ages 14 to 16 and increased binge eating from ages 14 to 19 were observed in this group. In E/UEs, significant age-by-group interactions were observed compared with HEs, with significantly increased dieting from ages 14 to 16 (PBonferroni = 0.026), and increased binge eating from ages 14 to 19 (PBonferroni = 0.028) and 14 to 23 (PBonferroni < 0.001). Nominal increases in purging were observed from ages 14 to 16, ages 14 and 19, and ages 14 to 23.
IP and EP trajectories by group
We explored behavioral group differences further, using latent growth curve models (LGCMs) to measure trajectories of IPs and EPs across (Fig. 3a; for descriptives, see Supplementary Table 1 and Supplementary Fig. 3) and within groups (Fig. 3d). Between-group univariate analyses showed that, compared with HEs, unhealthy eaters (REs and E/UEs) showed significant differences in how their IPs developed over time. Both REs (β = 0.073, 95% confidence interval (CI) = 0.019–0.126, P = 0.008; Fig. 3b) and E/UEs (β = 0.110, 95% CI = 0.051–0.169, P < 0.001) reported a significant increase (that is, in the slopes of their trajectories; Supplementary Tables 3 and 4) in IPs with age. Intercepts of IPs also differed, with E/UEs already reporting higher levels of IPs at age 14 than HEs (β = 0.712, 95% CI = 0.281–1.144, P = 0.001). Regarding EP trajectories, all three groups showed a decrease in these problems over time but the rate of decrease did not significantly differ between groups (Fig. 3c). Nevertheless, the EPs reported at age 14 were higher in E/UEs compared with HEs (β = 0.855, 95% CI = 0.418–1.292, P < 0.001) and REs (β = 0.743, 95% CI = 0.278–1.209, P = 0.002).

a, Path diagram for the conditional linear LGCM for individual IP and EP trajectories among three groups. Two dummy variables, RE and E/UE, were included to represent three groups (HE was considered the reference group in the model). Sex and seven dummy variables for different recruitment sites were included as covariates in the analysis. Post hoc analyses were conducted to examine the differences between the RE and E/UE groups. b, Predicted trajectories of IP across three groups. c, Predicted trajectories of EP across three groups. Data are presented as mean values ± 95% CIs. Points along the lines represent the mean IP or EP scores at each time, and the shaded areas show the 95% CIs. d, Path diagram for the multivariate LGCM for each group separately. e, Significant within-construct and cross-construct correlations (that is, covariances among the latent factors) between IP and EP trajectories were found within each group. The significant (two-sided) standardized covariances (that is, correlation coefficient r) and P values are indicated in the figure. In the path diagrams in panels a and d, ε represents residuals for observed indicator variables (for example, IP or EP at each time point) after accounting for the influence of latent factors (intercept and slope); ζ represents residuals for latent variables, capturing vairance that is not explained by the predictors. The numbers 1, 2, 5 and 9 indicate the factor loadings for the intercept and slope, reflecting the time intervals between the observed indicator variables.
Within-group multivariate LGCM analyses, which included IPs and EPs in the same model (Fig. 3d), revealed significant within- and between-construct correlations (Fig. 3e). Within-construct correlations showed that, in all groups, higher levels of EPs at age 14 were significantly correlated with smaller decreases in these problems over time. This association was especially strong in unhealthy eaters (REs and E/UEs), indicating that higher initial levels of EPs were linked to less improvement over time. Similarly, in REs and HEs, higher initial levels of IPs were associated with smaller decreases in these problems over time, but this pattern was not observed in E/UEs. Interestingly, our models highlighted notable connections between IPs and EPs. Specifically, we found that these problems tended to co-occur, especially in unhealthy eaters (REs and E/UEs), suggesting that individuals who started with higher levels of one type of problem were also more likely to have higher levels of the other. In HEs, changes in IPs and EPs were positively correlated, indicating that as one type of problem decreased, the other also tended to decrease. In addition, in contrast to the other groups, in REs there was a significant positive correlation between the initial levels of IPs and the changes in EPs over time, suggesting that higher initial levels of IPs were related to more subsequent changes in EPs. No other significant relationships between IPs and EPs were found in these analyses.
Group differences in brain maturation across adolescence
Longitudinal analyses were conducted to investigate between-group differences in brain maturation during adolescence, comparing changes in gray matter volume (GMV), cortical thickness (CT) and sulcal depth (SD) from age 14 to 23. All primary analyses included sex, recruitment sites and total intracranial volume (TIV) as covariates.
For GMV (Fig. 4a and Supplementary Table 6), longitudinal voxel-based morphometry (VBM) analyses were conducted, which revealed significant age-by-group interactions. Compared with HEs, REs showed smaller GMV reductions in the left cerebellum. E/UEs had smaller GMV reductions in two subclusters in the left cerebellum and five subclusters in the right hemisphere, including the middle frontal gyrus (MFG), putamen, medial superior frontal gyrus and postcentral gyrus. A lower GMV increase in the right parahippocampal gyrus was also observed. Differences remained similar after controlling for the joint effects of pubertal status, IQ, educational attainment (EA), and age- and sex-adjusted BMI (Supplementary Table 7). No significant differences in GMV trajectory were observed between REs and E/UEs.

a, A significant age-by-group interaction was observed between REs and HEs, ages 14–23, indicating that REs experienced a smaller volumetric reduction in the left cerebellum compared with HEs over time. E/UEs showed less volumetric reductions in multiple brain regions, including the left cerebellum, right MFG, right medial superior frontal gyrus, right postcentral gyrus and right putamen compared with HEs. However, E/UEs had volumetric increases in the right parahippocampal gyrus compared with HEs. b, Comparisons of CT trajectories between REs and E/UEs showed that REs experienced more pronounced CT reductions in the right frontal pole. CT trajectory comparisons between HEs and E/UEs showed that HEs experienced more pronounced CT reductions across a wide range of brain regions, including the frontal and occipital gyri and the anterior cingulate gyrus compared with E/UEs. c, SD trajectory comparisons between REs and E/UEs indicated that REs had less pronounced SD reductions in the left frontal pole. Comparisons of SD trajectories between HEs and E/UEs showed that HEs had less pronounced SD reductions in the frontal and temporal regions. All analyses were adjusted for sex, recruitment sites and TIV. The lines in the figures represent mean values for brain morphological features and the shaded areas represent the corresponding 95% CIs. The y axis indicates the adjusted brain morphological measures (GMV, CT or SD) after regressing out sex, recruitment sites and TIV. The F and T values were obtained from the 2 × 2 mixed analysis of variance and linear mixed model analyses, respectively (see Methods).
For CT (Fig. 4b and Supplementary Table 8), mixed linear analyses showed significant age-by-group interactions in the right frontal pole when comparing E/UEs with REs, with REs experiencing more pronounced CT reduction. In contrast, comparing E/UEs with HEs showed significant interactions across nine brain regions. These included the left lingual gyrus, bilateral frontal pole, bilateral rostral MFG, left pericalcarine, left cuneus, right caudal MFG and right caudal anterior cingulate gyrus, with E/UEs showing less CT reduction than HEs. Most differences remained significant after controlling for the joint effects of pubertal status, IQ, EA, age- and sex-adjusted BMI, Euler’s number and their joint effects (Supplementary Table 9).
Regarding SD (Fig. 4c and Supplementary Table 10), REs had a less pronounced reduction in the left frontal pole compared with E/UEs. Moreover, E/UEs showed larger SD reductions across nine regions compared with HEs, including the bilateral rostral MFG, left frontal pole, bilateral superior frontal gyrus, right caudal MFG, right pars orbitalis, right pars opercularis and right pars triangularis gyrus. Most differences remained significant after controlling for all covariates (Supplementary Table 11).
No significant age-by-group interactions in CT and SD were found when comparing REs with HEs.
Brain maturation mediates adolescent psychopathology and eating behaviors
We conducted mediation analyses to examine whether the brain differences identified above mediated the relationships between variations in IP and EP trajectories during adolescence and eating behaviors in young adulthood, as determined by the K-means derived clusters (the ‘psychopathology–brain maturation–eating behaviors’ models). Brain regions with significant group differences in their GMV, CT or SD trajectories were identified as regions of interest (ROIs) and tested for their mediating effects on behavioral group differences between RE or E/UEs compared with HEs. For REs, the cluster in the left cerebellum was used as the ROI. For E/UEs, differences across E/UE-related clusters were combined into a single ROI for each structural brain measure. All primary mediation analyses were adjusted for sex, recruitment sites and TIV differences to account for overall brain size variations across ages.
For REs, who differed from HEs during adolescence by their increasing trajectories of IPs (IP slope) and less pronounced GMV reductions in the left cerebellum, differences in cerebellar volume reductions partially mediated the relationship between increased IPs and being classified as an RE at age 23 (Fig. 5a). This mediation was no longer significant after adjustments for BMI, IQ and pubertal status.

a, Mediation effect of GMV reductions in the left cerebellum (ages 14–23) on the relationship between age-related IP (IP slope) and RE at age 23. b, Mediation effects of GMV reductions on the relationship between age-related IP changes (IP slope) and E/EU at age 23, considering all E/UE-related ROIs (except the right parahippocampal gyrus, due to the different directionality of its changes compared with other ROIs). c, Mediation effects of CT reductions on the relationship between age-related IP changes (IP slope) and E/EU at age 23, considering all E/UE-related ROIs. d, Mediation effects of GMV reductions on the relationship between EP intercept and E/EU at age 23, considering all ROIs (except the right parahippocampal gyrus, due to the different directionality of its changes compared with other ROIs). e, The unique contribution of smaller cerebellar GMV reductions in mediating the effects of BMI PGS on restrictive eating when IP trajectory was also included in the model. f, The unique contribution of GMV changes in all E/UE-related ROIs (except the right parahippocampal gyrus) in the relationship between EP intercept and E/UE at age 23, beyond the effects of BMI PGS. All mediation models were adjusted for sex, recruitment sites and TIV differences (between ages 14 and 23). Cerebellum_8_L, left Lobule VIII of the cerebellar hemisphere. In the mediation models shown in panels a–f, the path coefficients a, b, c’, a1, a2, c1, c2 and c represent standardized regression weights.
Behaviorally, E/UEs differed from HEs in adolescence by their higher levels of IPs and EPs (EP and IP intercepts) and increasing trajectory of IPs (IP slope). Nominal significance was found when testing the mediation effects of GMV (Fig. 5b) and CT (Fig. 5c) differences on the relationship between IP slope and being classified as an E/UE at age 23. Mediation in the ‘IP slope–GMV–E/UE’ model remained significant after controlling for covariates, whereas for the ‘IP slope–CT–E/UE’ model, the mediation remained significant after adjusting for BMI or EA but not when adjusting for pubertal status or IQ. GMV differences in E/UE-related ROIs also significantly (P < 0.001) mediated the associations between EP intercept and E/UEs (Fig. 5d). This was unaffected by BMI, IQ, EA or pubertal status. No significant mediating effects were found for SD differences.
Altogether, these findings suggest that altered neurodevelopment in the RE and E/UE groups, as evidenced by protracted GMV and CT reductions, may contribute to ED symptoms, partly by mediating the effects of IPs and EPs.
Links between genetics, brain maturation, psychopathology and eating behaviors
Considering the effects of covarying BMI in the mediation analyses above, we explored the potential contributions of polygenic risk for higher BMI. Simple ‘genetics–brain maturation–eating behaviors’ mediation models indicated that smaller GMV reductions in the RE and E/UE groups (compared with HEs) mediated the effects of BMI PGS on eating behavior profiles at age 23 in these groups (for REs versus HEs, indirect effect = 0.042, P = 0.002, 13.5% mediated; for E/UEs versus HEs, indirect effect = 0.043, P = 0.026, 11.7% mediated). For REs, this remained significant after adjusting for IQ, EA or pubertal status but not BMI. For E/UEs, this only remained significant after controlling for IQ or EA. No significant association was found between BMI PGS and CT reductions related to E/UEs. These analyses suggest that genetic predispositions to higher BMI influence BMI and restrictive and emotional/uncontrolled eating partly through their effects on protracted GMV reductions during adolescence.
Multivariate mediation analyses including IPs or EPs in these models showed the unique contribution of smaller cerebellar GMV reductions in mediating the effects of BMI PGS on REs when changes in IPs were also considered (Fig. 5e). In contrast, smaller GMV reductions in E/UEs mediated the effects of early EPs (at age 14) in this group, beyond the effects of BMI PGS (Fig. 5f). These findings suggest a specific role for cerebellar maturation in the control of BMI and restrictive eating, and additional roles for cortical and putamen maturations in mediating the effects of behavioral problems on EE and UE.
Discussion
In this study, we used a longitudinal, multivariate analytical framework to explore the interplay among eating behaviors, genetic factors, ED-related psychopathology and brain maturation during adolescence. Our analyses revealed a high prevalence of unhealthy eating behaviors (RE and E/UE) associated with higher BMI and BMI PGS. Unhealthy eaters showed higher levels of EPs (E/UEs) and increasing trajectories of dieting (REs and E/UEs), binge eating (E/UEs) and IPs (REs and E/UEs). Age-related decreases in volumes and thickness in several brain regions, particularly in the cerebellum and prefrontal cortex (PFC), were less pronounced in REs and E/UEs compared with HEs, suggesting protracted brain maturation. Smaller volumetric reductions in the left cerebellum mediated the effects of BMI PGS on restrictive eating, even after accounting for IPs. Reductions within additional brain regions of the right hemisphere uniquely mediated the relationship between EPs and EE or UE, even after accounting for BMI PGS. These findings enhance our understanding of adolescent neurodevelopment related to ED symptomatology.
Unhealthy eaters were characterized by differing trajectories of ED symptoms during adolescence, with increasing rates of binge eating, dieting and purging in E/UEs, suggesting a greater risk for bulimia nervosa, in line with previous research6. Unsurprisingly11,28, higher levels of EPs in this group also indicated that adolescents with attention deficit hyperactivity disorder and conduct disorder symptoms may be more likely to engage in EE or UE. IPs also increased during adolescence in unhealthy eaters, notably in E/UEs, highlighting the close relationships between EE and psychological well-being29. Although the decreasing levels of IPs and EPs in HEs replicate previous findings30, differing trajectories in unhealthy eaters, already evidenced at age 14, indicate that IPs and EPs predate the development of ED symptoms.
Consistent with cortical development trajectories31,32, declines in structural brain measures (except for increases in SD) were observed in all eating groups, with evidence of protracted brain maturation in unhealthy eaters. Protracted brain maturation was also related to IPs and EPs, corroborating findings from children33, and findings of delayed trajectories of cortical thinning in children and adolescents with attention deficit hyperactivity disorder34. The smaller volumetric reductions in the cerebellum observed in unhealthy eaters support its role in eating pathology. Findings from anatomical, functional and behavioral studies indicate that the cerebellum is involved in the regulation of feeding behaviors and appetite control35,36,37,38. Disruption of a cerebellum-driven satiety network contributes to excessive eating, difficulties in stopping eating and weight gain38. Our finding of protracted cerebellar maturation in unhealthy eaters suggests disrupted development of such a satiety network, and engagement in restrictive eating as a compensatory mechanism to consciously control weight gain. Additional alterations in reward (right putamen) and prefrontal (for example, right PFC) circuitry might lead E/UEs to also engage in disinhibited eating due to impairments in self-regulation39 and impulsive action control40, making them more susceptible to EE or UE behaviors.
Genetic and environmental factors41 contribute to changes in developmental brain trajectories related to eating. Genetic risk for obesity was previously found to correlate with disordered eating and weight control behaviors in adolescents42,43. High BMI was also found to be associated with reduced cortical thinning in adolescence44,45. Our findings extend these analyses, indicating that genetic risk for obesity may influence eating-related weight control behaviors, partially via effects on cerebellar maturation, in a BMI-dependent manner.
Environmental stressors, such as adverse social environments and peer interactions, also modulate brain development46. Smaller GMV decreases in the cerebellum, PFC and anterior cingulate are observed in adolescents disliked by their peers, correlating with callous-unemotional traits found in externalizing disorders47. This altered brain development may underlie these adolescent adjustment problems and hypersensitivity to peer rejection48. Our findings suggest that adjustment problems influence brain maturation beyond genetic predispositions for high BMI, increasing the risk for EE and UE.
Our study’s key strengths include a well-characterized, deeply phenotyped longitudinal adolescent cohort and an innovative multivariate analytical approach. However, some limitations exist. First, the analysis is based on participants of European ancestry, necessitating future research with more ethnically diverse samples for broader applicability. Second, the use of summary scores to assess eating behaviors may oversimplify complex interactions and variations. Third, some analyses rely on VBM, which can impact GMV estimates49. In addition, although we considered CT and SD, we did not analyze surface area, a key volume component with distinct genetic architecture, reducing the resolution of our genetic findings.
Nonetheless, our study sheds light on how genetic risk for higher BMI, along with increasing IPs and EPs experienced during adolescence, distinctly contributes to unhealthy eating through their effects on brain maturation. The implications of these findings underscore the potential benefits of education targeting early maladaptive coping mechanisms and dietary habits to prevent EDs while promoting brain health.
Methods
Participants
Data analyzed in this study were collected as part of IMAGEN, a longitudinal genetic × neuroimaging cohort study of adolescents recruited from eight study centers in England, Ireland, France and Germany50. The IMAGEN study was approved by local research ethics committees at each study site, and written informed consent was obtained from participants and their parents or guardians. A detailed description of the study protocol and data acquisition can be found in ref. 50. Information on specific ethnic categories was not collected but the study, aimed at identifying the genetic and neurobiological basis of individual variability in behavior, was designed to include predominantly participants of European (white) ancestry, based on their self-reports. To further account for population stratification, statistical approaches were applied to identify and exclude genetic ancestries other than European when analyzing the genetic data. Specifically, the SDQ data used in this study were acquired at ages 14, 16, 19 and 23 years; neuroimaging data (N = 949) were acquired at ages 14 and 23 years and the TFEQ data were obtained at age 23 (N = 996).
Neuropsychological assessments
Eating behaviors
The short version (18 items) of the TFEQ was used to assess eating behaviors. The TFEQ contains 3 subscales: CR, which measures the tendency to restrict one’s food intake constantly and consciously instead of using physiological cues, hunger and satiety as regulators of food intake (6 items); EE, which reflects the tendency to eat in response to negative emotions (3 items); and UE, which characterizes the tendency to overeat with the feeling of being out of control (9 items). It has good structural validity and has been used and validated in different European populations7,51 and was found to distinguish different eating patterns in the general population52.
ED symptoms
Dieting, binge eating and purging symptoms were assessed using the self-reports from the ED section (section P) of the Development and Well-being Assessment21,53. Dieting symptoms were evaluated based on responses to questions P18a, P18b and P18c, which asked about eating less at meals, skipping meals and fasting, respectively. Binge-eating symptoms were assessed using the question P15, which inquired about eating a large amount of food and losing control overeating. Purging symptoms were measured using the questions P1c, P18f and P18g, which asked about self-induced vomiting or taking pills or medicines to lose weight.
Emotional and behavioral problems
The SDQ was used to assess emotional and behavioral problems in adolescents. It has five hypothesized subscales, including emotional symptoms, conduct problems, hyperactivity/inattention, peer relationship problems and prosocial behaviors54. In low-risk and general population samples, the emotional and peer subscales can be combined into an ‘internalizing’ subscale (10 items) and the behavioral and hyperactivity subscales into an ‘externalizing’ subscale (10 items), respectively55. We used self-reported scores at ages 14, 16, 19 and 23 years for IPs and EPs in further analyses.
Structural magnetic resonance imaging acquisition and processing
Magnetic resonance imaging (MRI) scans were acquired with 3T MRI scanners from different manufacturers (Siemens, Philips, General Electrics and Bruker) from 8 IMAGEN recruitment sites. The high-resolution anatomical MRI images acquired included a 3-dimensional T1-weighted magnetization prepared gradient echo sequence based on the Alzheimer’s Disease Neuroimaging Protocol (https://adni.loni.usc.edu/data-samples/adni-data/neuroimaging/mri/mri-scanner-protocols/), T2-weighted fast-spin echo and fluid-attenuated inversion recovery scans for visual assessment.
All raw images were visually inspected to exclude images with movement artifacts, brace artifacts or field inhomogeneities before preprocessing. The preprocessing procedures were then conducted using the Computational Anatomy Toolbox (CAT 12.8 (r1907); https://neuro-jena.github.io/cat/) in SPM 12 (Wellcome Department of Cognitive Neurology). We used the ‘segment longitudinal data’ procedure with default settings. Intrasubject coregistration was performed on the baseline (at age 14) and follow-up (at age 23) images. The coregistered images were then realigned across participants and bias corrected with reference to the mean images computed from each subject’s baseline and follow-up images. Next, the baseline and follow-up images and their mean images were segmented into gray matter, white matter and cerebrospinal fluid based on the default tissue classification map. Diffeomorphic Anatomical Registration Through Exponentiated Lie Algebra (DARTEL) normalization was subsequently performed on the segmented mean images using the default DARTEL template. The derived spatial normalization parameters were then applied to transform the segmented subject baseline and follow-up gray matter images into the standard Montreal Neurological Institute space. All normalized gray matter images were finally smoothed with an isotropic Gaussian kernel of 6 mm full width at half maximum. The quality measures created during preprocessing for each participant at each time point were examined, and images with sufficient quality (corresponding to grade D or above) were included in further analyses. Changes in GMV were analyzed using whole-brain VBM. Measures of CT and square root-transformed SD, which were then resampled to 12 mm in line with the recommendation for surface measures, were also derived. Longitudinal changes in mean CT and SD were extracted for different ROIs using the Desikan–Killiany atlas (N of ROIs = 68).
BMI PGSs
A total of 2,087 participants were genotyped with the Illumina Human610-Quad BeadChip and Illumina Human660-Quad BeadChip during the baseline assessments. Stringent quality control (QC) procedures were performed before imputation (Supplementary Information). In brief, multidimensional scaling analysis and principal component analysis were conducted to identify genetic ancestry. Participants who were outliers from the European superpopulation were excluded (Supplementary Figs. 4 and 5) due to the limited portability across ancestries for PGSs. Consequently, 1,899 participants (49.66% male participants) who passed genotyping QC and were identified to be of European ancestry were selected for generating the BMI PGSs. IMAGEN genotype data were integrated into the European ethnicity 1KGP (phase 3 release v.5) reference panel56 for imputation. Summary statistics of genome-wide association study data of BMI from ~681,275 individuals of European ancestry57 were used to calculate BMI PGSs. This was achieved using PRS-CS58, which uses high-dimensional Bayesian regression and a continuous shrinkage before single-nucleotide polymorphism effect sizes. The global shrinkage parameter was set to 0.01 as is recommended for highly polygenic traits. A total of 905,362 single-nucleotide polymorphisms were used to predict BMI PGSs. Participants with available TFEQ scores were included in the subsequent analyses (for RE, N = 255; for E/UE, N = 194; for HE, N = 347). The BMI PGS was residualized for the first 10 principal components and batch effects before being Z-scored for subsequent analyses.
Statistical analyses
Identification of groups with distinct eating behaviors by K-means clustering
K-means clustering using the TFEQ subscale scores (that is, CR, EE and UE) at age 23 was performed to identify clusters showing different eating behaviors. All continuous variables were transformed into Z-scores. We used the NbClust package to identify the optimal cluster number and validity of the cluster solution, and the fpc package to examine the clustering stability with the Jaccard coefficient and a bootstrap technique (N = 1000) in R.
Group differences in trajectories of ED symptoms across adolescence
Linear mixed models were used to examine group differences in the trajectories of dieting, binge eating and purging from ages 14 to 23. Age (that is, 14, 16, 19 and 23) was treated as a categorical variable. The models included age, group and age-by-group interactions as fixed effects and adjusted for sex. Random intercepts for participants nested within recruitment sites accounted for the dependence of repeated measures. Group-by-age interactions were investigated using HEs and age 14 as reference. A Bonferroni correction accounting for 18 tests (3 ED symptoms × 2 group comparisons × 3 age comparisons) was applied (that is, PBonferroni = 2.78 × 10⁻³).
Group differences in trajectories of IPs and EPs
The LGCMs were conducted in these analyses using the lavaan package in R.
Univariate LGCM analyses
Latent factors of intercept and slope were estimated for repeated measures (at ages 14, 16, 19 and 23 years) of IP and EP scores separately. Sex, groups and recruitment sites were considered time-invariant covariates. For these analyses, we included only those participants who had TFEQ scores at age 23 and who had at least 1 measure of IP or EP at ages 14, 16, 19 and 23. For both IP and EP, we attempted to fit a quadratic term; however, this specification resulted in a non-positive definite covariance matrix, driven by a correlation greater than or equal to one between the linear and quadratic terms. Hence, we decided not to include a quadratic term as the information contained within it was not adding any extra information over the linear term. The full information maximum likelihood estimator was used to account for data missing at random. We investigated group differences in intercepts and slopes of IP and EP trajectories, taking HEs as a reference. A Bonferroni-corrected P-value threshold of 0.05/(2 behaviors × 2 measures × 2 groups) = 6.25 × 10⁻³ was considered statistically significant.
Multivariate LGCM analyses within each group were also run to estimate models for IP and EP trajectories simultaneously and to investigate covariances between latent factors (that is, IP intercept, IP slope, EP intercept and EP slope). Sex and recruitment sites were included as covariates.
Longitudinal MRI analyses for group differences in brain maturation
Participants were excluded from the analysis if they had missing MRI data or failed to meet QC criteria (N = 47; see ‘Structural magnetic resonance imaging acquisition and processing’ for image preprocessing and QC). Consequently, a total of 949 participants (306 REs, 236 E/UEs and 407 HEs) were included in the whole-brain VBM analysis and linear mixed models for CT and SD.
VBM analysis
Longitudinal whole-brain VBM analyses were performed using the CAT 12.8 (r1932) toolbox. To identify brain regions reflecting significant changes in GMVs between ages 14 and 23 among the groups identified above, we performed a 2 × 2 mixed analysis of variance on the smoothed images using the ‘flexible factorial’ model. The two factors were age (age 14 or age 23; within subject) and group (that is, comparison of each of 2 groups, namely REs versus HEs, E/UEs versus HEs or REs versus E/UEs; between subject). Intracranial volumes (TIVs) were estimated by CAT 12.8 as the sum of the gray matter, white matter and cerebrospinal fluid volume. Analyses were controlled for the effects of participants’ sex, the scanning site and TIV at each time point (at ages 14 or 23). An absolute threshold masking of 0.1 was applied. The gray matter morphological differences showing significant age-by-group interactions were reported after a cluster-level, family-wise error correction with P < 0.05 and a cluster-forming threshold of P < 0.001 without correction.
Linear mixed models
For group differences in changes in CT and SD, we performed ROI-based linear mixed models, investigating interactions between age and groups. Models included age, groups and their interactions as fixed effects, with the participant nested within recruitment sites as a random effect and adjusted for sex. For both measures, the Bonferroni correction was applied to adjust for multiple testing (P = 0.05/68 ROIs × 3 group comparisons = 2.45 × 10⁻⁴).
Mediation analyses
Simple mediation models were performed using the PROCESS v.4.0 macro for R to test whether the between-group differences in brain changes mediated the relationships between differences in IP or EP trajectories and eating behaviors. We refer to this model as the psychopathology–brain maturation–eating behaviors model. Brain clusters that significantly differentiated REs from HEs, E/UEs from HEs or REs from E/UEs were considered ROIs. For group comparisons involving several brain clusters, these clusters were combined into a single ROI for each structural measure (GMV, CT or SD). For comparisons between REs and HEs, 1 mediation model was tested, relating GMV differences in the left cerebellum to differences in IP slope; therefore, a P-value threshold of 0.05 was considered significant. For comparisons between E/UEs and HEs, nine mediation models were tested because these two groups differed behaviorally in IP intercept, IP slope, and EP intercept, and in their changes of GMVs, CTs and SDs. The Bonferroni-corrected significance threshold of 0.05/(3 trajectory measures × 3 structural brain measures) = 5.56 × 10⁻³ was applied.
Subsequent analyses investigated the potential contributions of the BMI PGS on the brain mediation models identified above, referred to as the genetics–brain maturation–eating behaviors models. The same brain ROIs were considered as mediators in these models. For models comparing REs with HEs, the significance was set at P = 0.05/(1 structural measure) = 0.05. For models comparing E/UEs to HEs, the significance was set at P = 0.05/3 structural measures = 1.67 × 10⁻².
Multivariate mediation models were conducted using AMOS 29 to explore the unique contributions of brain ROIs, psychopathology (IP and EP trajectories) and BMI PGS to mediation models identified in simple mediation analyses, referred to as the ‘genetics–psychopathology–brain maturation–eating behaviors’ model. Continuous variables were transformed into Z-scores for these analyses. CIs for the mediation effect were estimated from 5,000 bootstrap samples.
Covariates
Covariates for all analyses included sex and recruitment sites. For analyses involving GMV, CT and SD, TIV at the corresponding age was additionally included as a covariate. As there were no significant group differences in age at each data collection, age was considered a categorial variable in the linear mixed models and as time points in repeated measures in the LGCM analysis. For the longitudinal MRI analysis (VBM analysis and linear mixed models), participants nested within recruitment were modeled as a random effect and sex was considered a fixed effect in the model.
Other covariates
To examine the robustness of findings from our primary analyses, sensitivity analyses were conducted by including pubertal status, IQ, EA, and age- and sex-adjusted BMI as additional covariates. Pubertal status was assessed using the Puberty Development Scale59, an eight-item self-report measure of physical development based on Tanner stages, separately for male and female participants. IQ was calculated as the average of the Perceptual Reasoning Index (PRI) and Verbal Comprehension Index (VCI) scores based on age norms using the Wechsler Intelligence Scale for Children, Fourth Edition (WISC-IV; Pearson Clinical Assessment UK). We administered the block design, matrix reasoning, similarities and vocabulary subtests. Raw scores from each subtest were converted into scaled scores based on age norms. For both the PRI and VCI, we calculated prorated sums of scaled scores and then converted these sums into index scores according to the WISC-IV manual. EA was assessed by self-report of the ‘average grade at the end of the last term completed’. The age- and sex-adjusted BMI Z-score at age 14 was calculated using the jBmi R package based on the Centers for Disease Control and Prevention recommendations.
Reporting summary
Further information on research design is available in the Nature Portfolio Reporting Summary linked to this article.
Responses