Resting-state fMRI reveals altered functional connectivity associated with resilience and susceptibility to chronic social defeat stress in mouse brain
Introduction
Major depressive disorder (MDD) is a debilitating psychiatric disorder projected to become the main disease burden by 2030 and is now the leading cause of years lived with disability (YLD) [1]. Approximately half of depressed patients do not reach a full recovery and relapse is common following treatment [2,3,4,5]. Chronic stress often precipitates the emergence of depression [6,7,8,9]. However, important individual differences exist in the susceptibility for depression following exposure to chronic stress [3, 10,11,12,13,14,15]. Identifying the mechanisms underlying such variation in susceptibility and resilience in response to chronic stress is critical for understanding the pathophysiology of depression. Analyses of relevant rodent models reveal specific transcriptomic profiles associated with both resilience and susceptibility to chronic stress [16, 17]. Importantly, profiles associated with resilience are distinct from those of both susceptible and control animals. These findings reinforce the perspective that resilience and susceptibility in the face of stress are distinct neural processes. However, a comprehensive understanding of the neural circuitry underlying each state remains incomplete.
The chronic social defeat stress (CSDS) model is a highly validated and widely-used rodent model for studies of the mechanisms of stress-induced depression- and anxiety-like behaviors. The CSDS model also reveals variation in susceptibility and resilience. Individual differences are apparent in multiple outcome measures including depressive- and anxiety-like behaviors, metabolic homeostasis, neuroendocrine and immune signals [18, 19]. CSDS has thus emerged as an important model for the study of epigenetic, transcriptional, and anatomical mechanisms associated with the pathophysiology of stress-induced depression [13, 18, 20,21,22,23]. A detailed analysis of transcriptional profiles revealed highly significant overlap in gene networks associated with MDD in post-mortem human brain and those resulting from exposure to CSDS in mice [24] attesting to the relevance of the model for studies of the biological basis of MDD.
Depression is a circuit level-wide disorder involving many interconnected brain regions [16, 25,26,27,28,29,30]. The hippocampus is a heterogeneous brain structure with the dorsal and ventral portions serving different functions [31, 32] including those related to mood disorders [33]. While the rodent dorsal hippocampus is involved in spatial learning/memory, the ventral hippocampus is integral for emotional processing. Circuit level analysis of activity patterns derived from exposure to CSDS reveal convergence on the ventral hippocampus [34]. Neuroimaging in CSDS-exposed mice showed that structural covariance between the hippocampus and the nucleus accumbens is significantly associated with susceptibility to the effects of CSDS [35], supporting the involvement of brain reward pathways in susceptibility to CSDS [36, 37]. Subsequent analyses identified projections specifically from the dentate gyrus of the ventral hippocampus (vDG) to the nucleus accumbens as a neural circuit that defines susceptibility to CSDS [38]. Anacker et al. showed how vDG activity directly mediates individual differences in the susceptibility to stress whereby activation of this region produces susceptibility, while silencing vDG excitability through enhanced neurogenesis produces resilience following CSDS [39]. Enhanced glutamatergic tone from ventral hippocampal afferents to the nucleus accumbens enhances susceptibility to CSDS [38, 40]. These convergent findings identify the vDG as a critical region for susceptibility to chronic social stress [41, 42].
In contrast, resilience to chronic stress is associated with regions that support effective emotional regulation. The anterior cingulate region is a central hub region that integrates decision-making and cognitive processing from the prefrontal cortex with information involved in emotionality and emotional learning processed through several limbic regions [43]. Accordingly, the anterior cingulate region is critical for ‘top-down’ regulation of emotional activity within the limbic system. Identifying individual differences in connectivity across these brain regions following exposure to chronic stress is a useful approach to identifying the neurobiological basis of susceptibility and resilience to chronic stress.
We used resting-state functional magnetic resonance imaging (rs-fMRI) and functional connectivity (FC) analyses to study brain network changes in susceptible and resilient mice following CSDS compared with control, non-stressed mice. Measures of rs-FC are an established approach to study whole brain network connectivity in mice [44]. Previous rs-fMRI studies report differences in network communication in response to psychosocial stress [45] and individual variability [46]. Our initial analyses using data-driven spatial independent component analysis (ICA) indicate resting-state brain activity in stress-relevant regions that were common across all mouse groups, including; the vDG, basolateral amygdala, nucleus accumbens, and anterior cingulate regions. Additionally, seed-seed FC analysis identified the vDG (top aspect) as the region showing the most FC group differences attesting to the role of this brain region as a hub in mediating susceptibility and resilience to CSDS. Accordingly, the vDG (top aspect) was used as a source seed to review whole brain seed-voxel FC. Overall, susceptible (SUS) mice exhibited hyperconnectivity between the vDG and other stress-related limbic brain regions. In contrast, resilient (RES) mice displayed enhanced FC between the vDG and prefrontal regions, including the anterior cingulate; implying the possibility of greater top-down cortical regulation of the vDG and perhaps other limbic structures in RES mice. These findings suggest important individual differences in corticolimbic connectivity between SUS and RES mice as the neurobiological basis for the development of resistance to the psychopathology underlying stress-induced depression.
Methods
Animals
C57BL/6 mice were obtained from Charles River Laboratories (Saint-Constant, Quebec, Canada) and bred at the Douglas Research Centre (Montréal, Quebec, Canada). Housing was maintained in a temperature (21 ± 1 °C) and humidity (55 ± 10%) controlled room with a 12 h light: 12 h dark light cycle (lights on 08:00). All procedures were performed according to guidelines of the Canadian Council on Animal Care with an animal use protocol (AUP #7239) approved by the McGill University and Douglas Research Centre Facility Animal Care Committees (FACC). Male mice were weaned at postnatal day 22 (PND22) and siblings were assigned to standard housing conditions with mouse chow and water available ad libitum for 8 weeks. Animals were raised in groups of three mice (from different litters) in a 30 × 18 cm cage with standard bedding, two nestlet squares, and Enviro-dri available as nesting materials. CD1 retired breeders were obtained from Charles River Laboratories (Saint-Constant, Quebec, Canada) and single-housed.
Chronic social defeat stress (CSDS)
CSDS followed procedures similar to those previously described [47] with some minor adjustments [48]. On PND 80 adult male mice were physically defeated for 10 days by a new, pre-screened CD1 aggressor mouse for 5 min. If an attack bout lasted longer than 10 s the mice were separated momentarily. If the C57BL/6 J mouse was wounded, the defeat session was terminated for the day. The number of attacks received during the defeat session was limited to 15 attacks on days 1–3, 12 attacks on days 4–5, and 10 attacks on days 6–10. After the defeat session, the C57BL/6 mouse was housed across a perforated plexiglass divider in the same cage with the aggressor for 24 h. To mimic these conditions, control mice were housed in a cage across a divider with a novel C57BL/6 mouse every day for 10 days. On day 11, animals were screened on the social interaction (SI) test. During the first trial, mice were allowed to explore an open field arena (42 cm × 42 cm × 42 cm) containing an empty wire mesh enclosure for 2.5 mins. During the second trial, a CD1 mouse was placed into the enclosure and the experimental mouse was reintroduced for 2.5 mins. SI ratios were calculated as time spent in the interaction zone during the second trial divided by the time spent in the interaction zone during the first trial. Typically, mice with SI ratios < 1 are allocated as “susceptible”; mice with SI ratios > 1 are allocated as “resilient” [47]. Defeated mice recruited for rs-fMRI satisfied more stringent inclusion criteria used previously [49] whereby a SI ratio greater than 1.2 or less than 0.8 determined RES and SUS experimental groups, respectively. Notably, all available RES mice were imaged. Control (CON) mice with a SI ratio greater than 1.0 were recruited for imaging. The final study population consisted of N = 44 mice; CON, n = 18, SUS, n = 20, and RES, n = 6, which, with exception of the RES mouse group, is consistent with the median n = ~15 traditionally used in preclinical rs-fMRI studies [50]. Animals were pair-housed with same group partners in standard cages until brain imaging. Group SI scores were assessed for normality using the Kolmogorov-Smirnov test and outlier analysis was performed accordingly using the interquartile range method for non-parametric data or group mean plus or minus two standard deviations for parametric data.
Resting-state functional magnetic resonance imaging (rs-fMRI)
Anesthesia and physiological maintenance
To remain consistent with previous CSDS studies [18, 22, 51, 52] and the lasting behavioural effects of CSDS procedures [52], rs-fMRI acquisition was completed by a group-blind experimenter approximately one week following SI testing (randomized across 3 days, i.e. 6-8 days following SI testing). Mice were first weighed (27.98 g ± 0.29 SEM) and then quickly anesthetized using isoflurane (ISO) (induction: 5% ISO; maintenance: 2% ISO volume mixed 100% oxygen) for a total of five minutes. Mice were then transferred to the scanner and Cryoprobe bed assembly while ISO anesthesia was applied between 1.0–1.5% in 20/80 oxygen/medical air [53]. ISO anesthesia was maintained at an average of 1.29% ± 0.04 SEM across rsfMRI sessions. Body temperature was maintained using a warm airflow over the animal set at 37 °C. Respiration rate was monitored using the 1025-IBP-50 Small Animal Monitoring Gating System (SAInstruments); averaging 91.2 ± 1.5 (breaths per minute ± SEM). Blood oxygen saturation was monitored in real-time using a pulse oximetry sensor clip (SAInstruments) secured to the right hind paw.
rs-fMRI acquisition
Data was acquired using a 7 T small animal scanner (BioSpec 70/30USR, Bruker) equipped with a Cryoprobe. All fMRI images were obtained following Spin Echo EPI pulse sequence with parameters: FOV: 3.5 × 1; matrix: 128 × 80; slices: 15; resolution: 139 × 125 × 700 μm3; TE/TR: 1/1.50 s; flip angle 90; repetitions: 400 [53].
rs-fMRI preprocessing
Preprocessing included: (i) denoising using Advanced Normalized Tools (ANTs,) (github.com/ANTsX/ANTs/blob/master/Examples/DenoiseImage.cxx); (ii) motion correction using ANTs and FSL (fsl.fmrib.ox.ac.uk/fsl/fslwiki) tools; (iii) co-registration was achieved using ANTs and MINC tools by first creating a functional template from all subjects’ mean volumes (antsMultivariatetemplateConstruction2.sh) to which each subject’s functional data was then normalized (antsApplyTransforms); (iv) bias field correction was applied using ANTs; (v) using the MINC tools’ register program (www.bic.mni.mcgill.ca/ServicesSoftware) registration was completed through affine transformation and manually ‘tagging’ corresponding points on subject fMRI volumes from step iv and a high-resolution Allen Mouse Brain template (http://help.brain-map.org/display/mouseconnectivity/API, annotation/mouse_2011) that was down-sampled for optimal fit as previously described [53]—achieving an isotropic voxel resolution 150 × 150 × 150 μm3 suitable for further analyses and referencing according to the Allen Mouse Brain Atlas (AMBA) (2011); (vi) ventricle signal regression was performed using Analysis of Functional NeuroImages (AFNI) tools (afni.nimh.nih.gov/) by regressing out signals from a cerebrospinal fluid mask; (vii) smoothing using AFNI tools with a Gaussian Kernel of full width half maximum (FWHM) at 0.6; (viii) cropping using a brain mask generated according to grey and white matter segmentation from AMBA template space and was applied to all subjects; (ix) bandpass filtering between 0.01 Hz to 0.1 Hz was applied by AFNI tools.
Post-processing
We applied three commonly used methods to investigate rs-FC; (i) low component spatial independent component analysis (ICA-20), (ii) seed-seed analysis, and (iii) whole brain seed-voxel analysis. All statistical tests were performed based on prior testing of the assumptions of normality, within-group variance, and homoscedasticity of study data.
Independent component analysis (ICA)
Data-driven ICA was performed separately in SUS, RES, and CON mouse groups using GIFT tools (Group ICA of fMRI Toolbox, v1.3i, www.nitrc.org/projects/gift/) in MATLAB to determine if identifiable components fit with stress-relevant regions previously identified using the CSDS model and if these were consistent across all mouse groups. ICA output was limited to 20 components to investigate both larger brain networks and regional activity in consideration of stress-relevant anatomy and appropriate decomposition of rs-fMRI data in the mouse brain [54]. ICASSO was used to examine the stability and reliability of the components by randomization and bootstrapping. ICA findings guided seed selection for subsequent seed-seed analysis.
Seed-seed analysis
We performed seed-seed analysis considering ICA findings and a priori interests of previously established stress-related brain regions. Bilateral seeds defined 14 brain regions of interest, including; the vDG—top and bottom aspects, medial prefrontal cortex subregions including the anterior cingulate, prelimbic, and infralimbic cortex, nucleus accumbens shell, bed nucleus of the stria terminalis, habenula, basolateral and central amygdalar nuclei, ventral tegmental area, periaqueductal gray, dorsal raphe nuclei, and the locus coeruleus. Seed masks of existing AMBA template labels lacked sufficient intra-regional specificity and required significant voxel-by-voxel parcellation using MINC tools Display with co-reference to the high resolution AMBA. Correlational analysis was completed using MATLAB (https://www.mathworks.com/help/matlab/ref/corrcoef.html). At the subject level, we extracted the mean time series from each seed region and computed the Pearson correlation coefficient (r) for seed pairs. Statistical significance of within-group seed pairs was determined using a simple in-house built MATLAB script employing a one-sample Student’s t-test; threshold T > 2; p < 0.05; FDR corrected and between-group seed pair differences were determined by a two-sample Student’s t-test; threshold T > 2; p < 0.05; FDR corrected [53].
Whole brain seed-voxel analysis
Seed-voxel analysis was performed to investigate brain-wide FC patterns with a vDG (top) seed. Using FSL tools, the mean time-series of the vDG (top) seed was correlated with whole brain activity (at the voxel level) for each subject; values were transformed into Fisher Z scores and group comparison analysis was performed using a two-sample Student’s t-test (threshold T > 2; p = 0.05). Results were corrected for family-wise error rate (FWER) following clustering with p = 0.05 [55]. Mango tools (http://ric.uthscsa.edu/mango/) were employed for 3D representation of the vDG (top) seed and to construct 3D correlation maps overlaid on the AMBA template image (help.brain-map.org/display/mouseconnectivity/ API,annotation/mouse_2011). We used an ‘in-house’ MATLAB script for subsequent quantification analysis of seed-voxel results within select brain regions [53]. BrainNet Viewer tools (www.nitrc.org/projects/bnv/) were used for 3D representation of findings overlaid on the AMBA image. Boxplots represent subject-level correlation coefficients (CC) illustrating FC group differences between the vDG (top) seed and a single (peak) voxel (highest t-stat value) or a common voxel within a specific brain region (i.e. ACA). R software package (R version 4.1.3, RMINC version 1.5.3.0, pyminc/v0.56, anaconda version 2022.05, minc-toolkit-v2/1.9.18.2, minc-stuffs version v0.1.25, rstudio version 2022.2.3 + 492, www.r-project.org) was used for plotting.
Results
The research design is summarized in Fig. 1, describing the CSDS model, MRI data acquisition and processing.
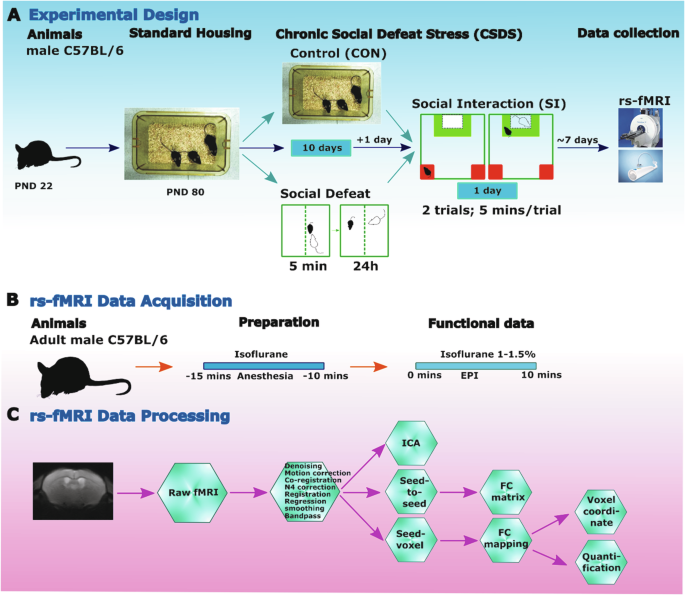
A Summary of the experimental design. B Schematic timeline of rs-fMRI acquisition with Cryoprobe technology. C rs-fMRI data processing and post analysis workflow.
Social interaction preference
Animals characterized on the basis of their SI ratio revealed evident clustering in defeated SUS and RES mouse groups (Fig. 2A-left.). A Kruskal-Wallis test showed a significant group effect (H(2) = 32.54, p < 0.0001) and Dunn’s pairwise testing indicated that SUS mice had a significantly lower SI ratio than CON and RES mouse groups (p < 0.0001) (Fig. 2A-left.). Inclusion of data from an outlying CON mouse had no effect on subsequent FC analyses (Supplementary Figure S2). Moreover, a Kruskal-Wallis test indicated a significant group effect (H(2) = 28.86, p < 0.001) and Dunn’s pairwise testing showed that SUS mice spent significantly less time in the SI zone when the CD1 attacker was present compared to both CON (***p < 0.0001) and RES (*p < 0.05) mouse groups (Fig. 2A–right).
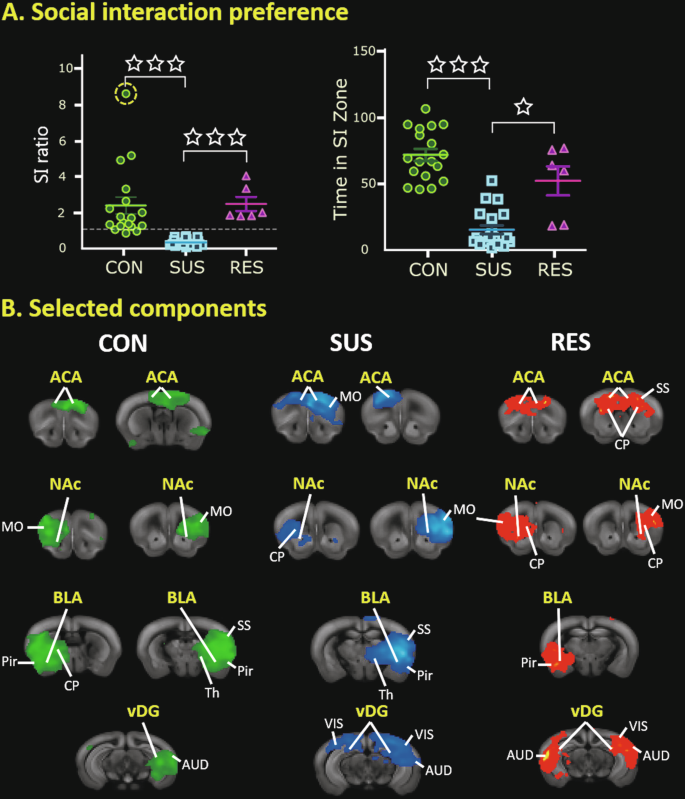
A-left) Representation of social interaction (SI) ratios (mean ± SEM) from undefeated control mice (CON, n = 18) as well as defeated ‘susceptible’ (SUS, n = 20) and ‘resilient’ (RES, n = 6) mouse groups. SI ratios were calculated as time spent in the interaction zone when the CD1 attacker was absent divided by the time spent in the interaction zone when the CD1 attacker was present. SUS mice scored significantly lower in SI ratio compared to both CON and RES mouse groups (***p < 0.0001). A data point from the CON mouse group is highlighted (encircled-yellow) as an outlier but was not excluded from analyses (Supplementary Figure S2). A-right) Representation of time spent in the interaction zone (mean ± SEM)—with the CD1 attacker mouse present—from identified mouse groups. SUS mice spend significantly less time in the interaction zone (when the CD1 attacker is present) compared to both CON (***p < 0.0001) and RES (*p < 0.05) mouse groups. B Selected findings from low component [20] spatial ICA performed on rs-fMRI data from individual mouse groups (left, CON; middle, SUS; right, RES) identify four common stress-related components in all animals; specifically, the ACA, NAc, BLA, and vDG regions. Prominent components are overlaid on corresponding template coronal brain slices in identified mouse groups. ACA anterior cingulate area, AUD auditory area, BLA basolateral amygdala, CON control, CP caudate putamen, MO somatomotor area, NAc nucleus accumbens, Pir piriform area, RES resilient, SS somatosensory area, SUS susceptible, Th thalamus, vDG ventral dentate gyrus, VIS visual area.
Spatial independent component analysis (ICA) of rs-fMRI data
Low component, spatial ICA performed separately in SUS, RES and CON mice indicated consistent resting-state brain activity across all mouse groups with identifiable components fitting with stress-relevant brain regions previously identified using the CSDS model (Fig. 2B). Comprehensive findings are also included (Supplementary Figure S1). In most cases, these regions displayed bilateral activation, including; the vDG, basolateral amygdala, nucleus accumbens, and the anterior cingulate area (Fig. 2B). Notably, we did not find evidence of consistent laterality in our ICA findings across all groups.
Seed-seed functional connectivity analysis amongst stress-related brain regions
Considering ICA findings and stress-related brain regions implicated in previous CSDS studies, we selected 14 regions to conduct seed-seed FC analysis. Bilateral/central seeds including, the anterior cingulate area, prelimbic and infralimbic prefrontal cortices, nucleus accumbens shell, bed nucleus of the stria terminalis, habenula, basolateral and central amygdalar nuclei, vDG (top) and vDG (bottom) regions, ventral tegmental area, periaqueductal grey, dorsal raphe and locus coeruleus regions are displayed as 3D representations in AMBA template space (Fig. 3A). Subject-level time-series of each seed region were extracted from rs-fMRI data and correlated with that of all other seeds to compute group mean correlation coefficients (Fig. 3B). Significant within-group seed-seed connectivity was evaluated using a one-sample Student’s t-test (p < 0.05, FDR cut-off 0.05) (Fig. 3C). Significant seed pair group differences were identified using a two-sample Student’s t-test (p < 0.05, −2 > t > 2, FDR cut-off 0.05) (Fig. 3D).
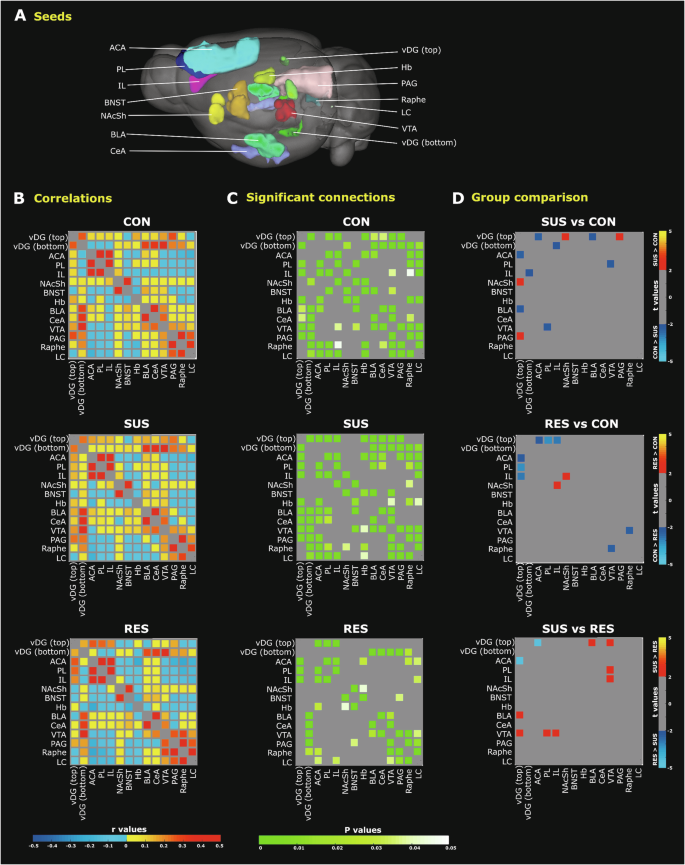
A 3D representation of 14 brain regions (seeds) overlaid on a whole brain image of the Allen Mouse Brain Connectivity Atlas (2011). B Matrices depicting group mean correlation coefficients (r values) indicate generally more negative correlations between seed pairs in RES mice (bottom panel; blue, cool colours). C Matrices depicting significant seed-seed connections determined by one sample Student’s t-tests (p < 0.05, FDR corrected) indicate stronger connectivity (green-white colour scaling) among stress-related brain regions in SUS mice (middle panel). D Statistically significant group differences for a particular seed pair as assessed by two sample Student’s t-tests (p < 0.05, −2> t > +2, FDR corrected) are indicated. SUS mice feature vDG hyperconnectivity with several subcortical stress-related brain regions (red-yellow colour) when compared to CON (top panel) and RES (bottom panel) mouse groups. Compared to SUS mice, preferential vDG–ACA connectivity (blue-light blue colour) is a common finding among both RES (bottom panel) and undefeated CON mice (top panel). ACA anterior cingulate area, BLA basolateral amygdala; BNST bed nucleus stria terminalis, CeA central nucleus amygdala, Hb habenula, IL infralimbic prefrontal cortex, LC locus coeruleus, NAcSh nucleus accumbens shell, PAG periaqueductal gray area, PL prelimbic prefrontal cortex, RES resilient, SUS susceptible, vDG ventral dentate gyrus, VTA ventral tegmental area.
When compared with CON mice, SUS but not RES mice showed significantly greater FC between the vDG and periaqueductal grey as well as the nucleus accumbens shell regions (Fig. 3D-top, middle). SUS mice also demonstrated significantly greater FC between the vDG and ventral tegmental area as well as the basolateral amygdala when compared to RES mice (Fig. 3D-bottom). Moreover, FC between the ventral tegmental area and the infralimbic and prelimbic prefrontal cortices was stronger in SUS compared to RES mice (Fig. 3D-bottom). Unlike SUS mice, the RES mice displayed mostly negative correlations (Fig. 3B-bottom) and reduced FC amongst stress-sensitive subcortical brain regions (Fig. 3C-bottom). The SUS mouse brain is thus best characterized by hyperconnectivity between the vDG and stress-related limbic regions. Notably, both SUS and RES animals showed reduced connectivity between the vDG and anterior cingulate area compared to CON mice (Fig. 3D-top, middle). Nevertheless, the RES mice showed significantly increased FC between the vDG and anterior cingulate regions compared to SUS mice (Fig. 3D-bottom). Interestingly, RES mice showed significantly increased FC between the nucleus accumbens shell and infralimbic prefrontal cortex compared to CON mice (Fig. 3D-middle). The RES, by comparison to the SUS mouse brain, is thus best characterized by functional hyperconnectivity between subcortical (vDG or nucleus accumbens shell) and cortical brain regions including the anterior cingulate and infralimbic cortices. Notably, findings from seed-seed analysis using select unilateral seed points were generally consistent with findings using bilateral seeds (Supplementary Figure S3). Subsequent FC analyses focused on the vDG (top) seed since this region showed the greatest number of significant FC group differences among selected seeds.
Whole brain vDG seed-voxel functional connectivity analysis
We reviewed brain-wide FC with a vDG (top-aspect) seed (Fig. 4A) at the voxel level. Group differences in vDG seed-voxel FC identified preferential connectivity patterns specific to individual mouse groups (Fig. 4B–D). We again found evidence for hyperconnectivity between stress-related subcortical regions in the SUS mouse brain revealing convergence across the analytical approaches. SUS mice showed significantly increased FC between the vDG seed and the nucleus accumbens region when compared to CON mice (Fig. 4B). SUS mice also showed significantly increased FC between the vDG seed and the basolateral amygdala, hypothalamus, ventral tegmental area, and periaqueductal grey regions when compared to RES mice (Fig. 4D).
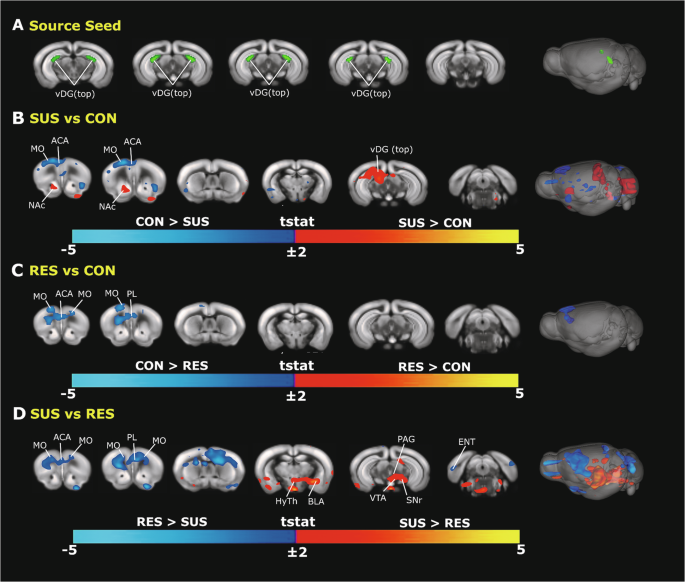
A Representations of a manually-generated vDG (top) seed overlaid on Allen Mouse Brain Connectivity Atlas (2011) 2D coronal slices and 3D whole brain image. B–D Significant group differences of vDG (top) seed-voxel FC are depicted as group contrast t-stat maps overlaid on Allen Mouse Brain Connectivity Atlas (2011) 2D coronal slices and 3D whole brain image; red-yellow (t > 2, cc = 0.05, FWER-corrected) and blue-light-blue colour intensity (t < −2, cc = 0.05, FWER-corrected). SUS mice display vDG hyperconnectivity with the NAc region when compared to CON mice (B) as well as with the BLA, HyTh, VTA, and PAG regions when compared to RES mice (D). Preferential connectivity between the vDG and prefrontal cortical regions (blue-light blue colour) differentiates undefeated CON mice (B) and RES mice (D) from SUS mice. ACA anterior cingulate area, BLA basolateral amygdala, BNST bed nucleus stria terminalis, ENT entorhinal area, HyTh hypothalamus, MO motor cortex, NAc nucleus accumbens, PAG periaqueductal gray area, PL prelimbic prefrontal cortex, RES resilient, SNr substantia nigra, SUS susceptible, vDG ventral dentate gyrus, VTA ventral tegmental area, CON control.
We also found FC group differences between the vDG seed and cortical regions. Importantly, RES mice again showed significantly stronger FC between the vDG seed and anterior cingulate as well as the prelimbic prefrontal regions when compared to SUS mice (Fig. 4D). Overall, seed-voxel findings support the seed-seed analyses and further demonstrate that the RES mouse brain is best characterized by functional hyperconnectivity between the vDG and cortical regions.
Functional connectivity contrasts between the vDG seed and peak anterior cingulate voxel
A common finding amongst vDG seed-voxel group contrasts performed above was that of significant differences in FC between the vDG and anterior cingulate area. To further examine these differences, we sought to evaluate connectivity between the vDG seed and the peak voxel (i.e. highest t-value) within the anterior cingulate cluster from each group contrast. We found that the location and magnitude of the peak anterior cingulate area voxel depended on the specific group contrast (Fig. 5A–C top panels). The peak anterior cingulate area voxel for the SUS versus RES group contrast was localized more posterior within this region with significantly reduced vDG connectivity seen in SUS mice (Fig. 5C-top). RES mice showed significantly increased FC between the vDG and anterior cingulate area peak voxel when compared to SUS mice (t(24) = 4.14, p = 0.0003, FDR cut-off 0.05) (Fig. 5C-bottom). These results further support functional hyperconnectivity between the vDG and anterior cingulate regions as a possible biological mechanism to achieve resilience following chronic stress.
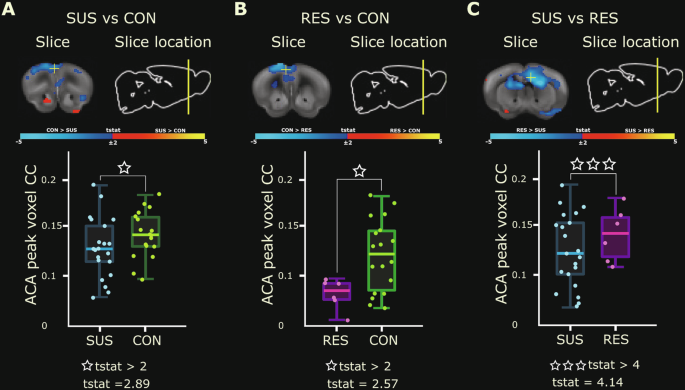
A–C Top panels: Group contrast t-stat maps illustrate vDG (top) connectivity overlaid on Allen Mouse Brain Connectivity Atlas (2011) coronal slice and the anatomical location of the peak voxel (highest t-stat value) within the ACA cluster (white +) for SUS versus CON (A), RES versus CON (B), and SUS versus RES (C) mouse groups. Significant group differences are displayed as spectral intensity: red-yellow (t > 2, cc = 0.05, FWER-corrected) and blue-light-blue (t < −2, cc = 0.05, FWER-corrected). Bottom panels: Subject-level box plots of vDG seed—ACA voxel correlation coefficients (CC) indicate a gradient effect of vDG–ACA connectivity that is generally stronger in undefeated CON mice compared to SUS (A, t(36) = 2.89, p = 0.006, FDR cut-off 0.05) or RES (B, t(22) = 2.57, p = 0.02, FDR cut-off 0.05) mice groups but is robustly increased in RES mice when compared to SUS animals (C, t(24) = 4.14, p = 0.0003, FDR cut-off 0.05). ACA anterior cingulate area, RES resilient, SUS susceptible, vDG ventral dentate gyrus, CON control.
Quantification of vDG seed-voxel findings with selected brain regions
We then sought to determine the magnitude of connectivity clustering between the vDG (top) seed and five target brain regions; including, the anterior cingulate area, nucleus accumbens, basolateral amygdala, ventral tegmental area, and periaqueductal grey (Fig. 6A). From group contrast t-stat maps, we quantified the number and percent of voxels (relative to total seed region size) from region-specific connectivity clusters that showed a significant FC difference with the vDG seed. The magnitude of FC was represented by the line thickness/colour bar between the vDG and other regions (Fig. 6B–D). In SUS compared to CON mice, the magnitude of the FC was significant and most robust between the vDG and nucleus accumbens as well as periaqueductal grey region (Fig. 6B). The magnitude of the FC difference was also significantly higher in SUS compared to RES mice between the vDG and several limbic structures, including; the basolateral amygdala, ventral tegmental area, and periaqueductal grey (Fig. 6D) supporting previous findings indicating vDG hyperconnectivity with other limbic regions in the SUS mouse brain. Quantification analyses further indicated a significantly increased magnitude of FC between the vDG and anterior cingulate area in RES compared to SUS mice (Fig. 6D). These analyses are supportive of previous seed-seed and seed-voxel findings and highlight an important biological mechanism by which resilience might emerge following exposure to CSDS.
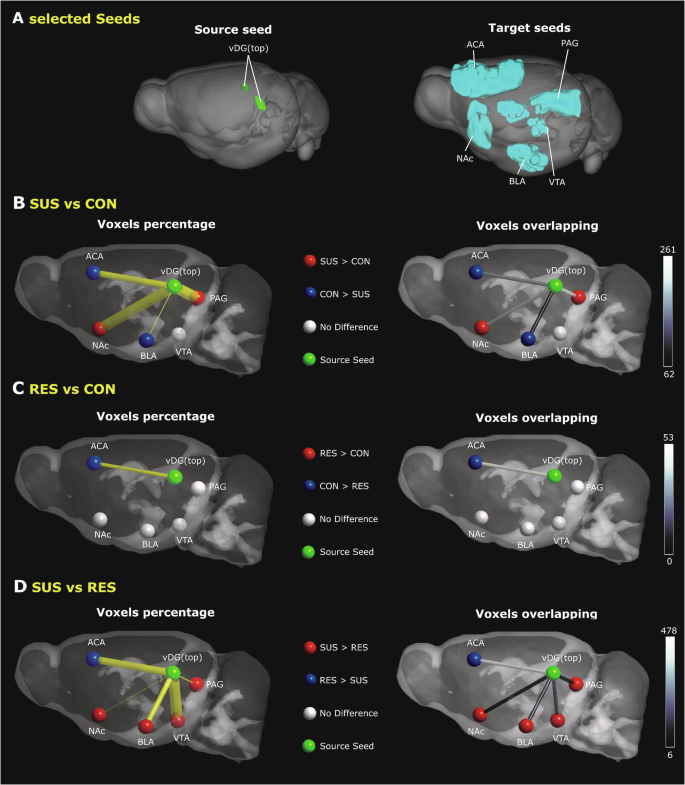
A 3D representations of a manually generated vDG (top) source seed (A-left) and 5 selected target regions (A-right) overlaid on Allen Mouse Brain Connectivity Atlas (2011) whole brain images. B–D Schematic illustrations outline a quantification of significant vDG seed-voxel FC findings from Fig. 4 with selected target regions between SUS versus CON (B), RES versus CON (C), and SUS versus RES (D) mouse groups. SUS mice show preferential FC between the vDG and subcortical regions with the strongest change between the vDG and VTA regions when compared to RES mice (41.79%). Prominent vDG FC with the ACA region is favoured in CON mice compared to both RES (3.03%) and SUS (9.89%) mouse groups; however, RES mice show the largest FC change between the vDG and ACA (27.32%) relative to SUS animals. Left panels indicate the percent of voxels within a specified target region that showed a significant FC group difference with the vDG source seed. The magnitude of this percentage is represented by the line thickness (yellow connectivity bar). Right panels indicate the number of voxels within a specified target region that show a significant change in vDG FC. The black-white colour scaling bar (right) indicates the total number of significant voxels. Green-coloured spheres indicate the anatomical location of the vDG region. The direction of group differences between the vDG and target regions is represented by a red or blue coloured sphere. Regions with no group difference are indicated by a grey-coloured sphere. ACA anterior cingulate area, BLA basolateral amygdala, CON control, NAc nucleus accumbens, PAG periaqueductal gray area, RES resilient, SUS susceptible, vDG ventral dentate gyrus, VTA ventral tegmental area.
Discussion
General summary
CSDS is a well-validated model system for studies of the molecular mechanisms underlying individual differences in stress reactivity, with potential implications for the pathophysiology of mood disorders [18, 19, 22, 24, 47]. The relevance of the model, particularly for the study of resilient versus susceptible animals, is based on the findings that 1) stress acts to precipitate MDD amongst a segment of the population and that 2) individual differences in stress reactivity moderate the impact of the stress on the risk for subsequent MDD. Molecular analyses of model systems thus focus on brain regions with known importance for the activation of behavioral responses to chronic stress. A particular strength of the CSDS model is the clear identification of molecular pathways that distinguish RES and SUS animals.
We sought to provide a comprehensive analysis of differences in brain connectivity that distinguish mice resilient or susceptible to the effects of chronic stress. We examined rs-FC in these animals focusing on the hippocampal vDG, a region critical for the expression of behavioral effects of CSDS [34, 35, 38, 41, 42, 56]. Consistent findings from a variety of analytical approaches to the rs-fMRI data distinguished SUS and RES phenotypes following CSDS. Specifically, the SUS mouse brain displayed enhanced FC between the vDG and limbic regions whereas RES mice showed stronger FC between the vDG and prefrontal regions, including the anterior cingulate, a region known to moderate responses to stress in humans.
Functional connectivity of the vDG in stress-susceptible animals
The rodent nucleus accumbens receives glutamatergic projections from the ventral hippocampus, which represents a primary input to the shell region [57,58,59]. Our specific interest in the vDG as a seed region was based on evidence of relevant connectivity with stress-related brain regions [33] as well as its essential role in emotional regulation [31] stress susceptibility, depression, and antidepressant effects [3, 39, 42, 60,61,62,63]. Of particular importance was the finding, across multiple analyses, of vDG hyperconnectivity with the nucleus accumbens in SUS animals. These findings are consistent with the wealth of studies showing that vDG projections to the nucleus accumbens are critical for the expression of depression- and anxiety-like behaviors following CSDS [38, 39, 41, 42, 64]. SUS mice exhibit greater glutamatergic tone between the nucleus accumbens and ventral hippocampus compared to RES mice [38]. Furthermore, excitation of the vDG increases susceptibility to social defeat in mice [39]. Importantly, Muir et al. [64] showed that activity along the vDG – nucleus accumbens path was predictive of susceptibility to chronic variable stress in both male and female mice [64]. These findings suggest that 1) the importance of the vDG – nucleus accumbens connectivity for stress susceptibility is not unique to the CSDS model and 2) that this pathway operates to define stress susceptibility in both males and females.
Our finding of increased FC between the vDG and ventral tegmental area (VTA) in SUS mice is consistent with the role of the mesolimbic dopamine circuit in stress susceptibility and depression [65]. Variation in dopamine neuron burst firing associates with susceptibility to stress in mice [18, 37, 66,67,68]. In the CSDS model, RES and SUS mice use different behavioural strategies and reveal distinct activity patterns in dopamine terminals in the nucleus accumbens [36]. Interestingly, the VTA and dopamine neuronal activity is influenced by communication between the ventral hippocampus and the nucleus accumbens [69].
Hyperconnectivity of the vDG with limbic regions previously implicated in the susceptibility to chronic stress also included the basolateral amygdala (BLA); a brain region that processes fear- and threat-related stimuli [70]. Hultman et al. [34] used machine learning modeling to identify a neural circuit that predicted depressive-like behavior following CSDS [34]. Increased activity within this network distinguished SUS animals. CSDS-related network activity was relayed through the amygdala (and VTA) to converge in ventral hippocampus, suggesting that greater amygdala – vDG connectivity associates with susceptibility. Chronic restraint stress in adult mice is also associated with greater amygdala connectivity to the ventral hippocampus [71, 72]. There is an analogy with human clinical studies. An extensive meta-analysis of neuroimaging studies showed hyperconnectivity between the amygdala and the right hippocampus among MDD patients compared with healthy controls [73]. Interestingly, the activation of stress responses is highly dependent upon activity in the right hemisphere, including the right hippocampus [74]. Notably, present ICA findings indicated predominant right hemisphere BLA rs-activity in SUS mice. These animals also featured stronger FC between the vDG seed and the (right) BLA; an effect that was supported by supplementary seed-seed analyses using unilateral seed points. Intriguingly, early life stress, which commonly associates with greater susceptibility to chronic stress in later life, also strengthens connectivity between the amygdala and hippocampus [75].
Functional connectivity of the vDG in stress-resilient animals
We identified significantly greater FC between the vDG and prefrontal regions, specifically the anterior cingulate area, in RES compared with SUS animals. We appreciate the debate concerning the alignment of the rodent and human prefrontal regions [76, 77]. There are clearly important caveats. We assume that the mouse prelimbic and anterior cingulate regions bear homology to the human anterior cingulate [76], a region strongly implicated in MDD [43, 78, 79]. Reduced prefrontal connectivity with the hippocampus is reported in patients with MDD [80, 81]. Studies with animal models show that experimental procedures that enhance connectivity between the ventral hippocampus and prefrontal cortex produce antidepressant and anxiolytic effects [41, 82]. For example, activity within the ventral hippocampus – medial prefrontal cortex pathway is essential for the antidepressant response to ketamine [82]. These findings are consistent with previous reports showing that hypoactivity in the mouse medial prefrontal cortex was associated with greater susceptibility to CSDS [83, 84].
The human anterior cingulate cortex is associated with MDD in structural MRI studies [85] and essential for emotional and cognitive functions disrupted in MDD [43, 86,87,88,89]. Alterations in anterior cingulate function and connectivity is proposed as a mechanism that manifests in features of MDD such as rumination, negative attentional bias, and emotion dysregulation that are characteristic features of depression. Importantly, anterior cingulate activity predicts treatment outcomes among depressed patients [90], a finding confirmed in an extensive meta-analysis [43]. While connectivity of the human anterior cingulate cortex to limbic regions is implicated in the emotional dysfunction characteristic of MDD, the precise role of altered connection with the ventral hippocampus remains to be clearly defined, although both regions are involved in emotional processing. One possibility is that increased connectivity between the ventral hippocampus and anterior cingulate may underlie improved emotional regulation associated with resilience.
The RES mouse brain was characterized by functional hyperconnectivity between subcortical (vDG or nucleus accumbens) and cortical regions including both the anterior cingulate and infralimbic prefrontal regions. Notably, MDD patients show reduced FC between the nucleus accumbens and connecting reward, executive, default mode, and salience networks [91]. More specifically, FC strength between the nucleus accumbens shell and the subgenual/pregenual anterior cingulate regions associates with anhedonia in MDD patients [92]. Enhanced activity between the infralimbic prefrontal cortex and nucleus accumbens regions may be a mechanism that supports resilience following exposure to CSDS. Indeed, direct glutamatergic projections exist between the medial prefrontal cortex and the nucleus accumbens in rodents [93, 94] and stimulation of the medial prefrontal region elicits increased extracellular glutamate levels in the nucleus accumbens [95]. Acute optogenetic stimulation of medial prefrontal afferents in the nucleus accumbens reduced social avoidance during SI testing in CSDS mice [38]; an effect that further defined previous work of increased medial prefrontal activity as pro-resilient [83].
Together, these findings support a consensus view that enhanced connectivity with prefrontal regions is protective and that effective coordination between this area and at least some connections, specifically hippocampal and nucleus accumbens regions, represents a tractable and translatable mechanism underlying a resilience to the developments of depression-related pathophysiology.
Limitations
While the CSDS paradigm represents an impressive model for the mechanistic study of depression detailing distinct transcriptional profiles in mice with significant overlap to post-mortem human brains of depressed patients [24], this model remains less appropriate for females. Alternative paradigms have been implemented in females with comparable depressive-like effects to those obtained by CSDS in males [96]. Comparing sex effects between different models remains challenging to interpret [97]. Stressors, particularly social stress, may have very different functional significance for males and females even with the same experimental protocols. We acknowledge the exclusive use of male animals as a limitation and suggest these findings are considered preliminary requiring replication and extension with females using appropriate chronic stress protocols. Additionally, it is important to replicate these findings using alternative chronic stress models to ensure comparable results across various models of resilience.
The preference for medetomidine with ISO as sedative agents in rs-fMRI [50] was not ignored in designing the present study. Low dose ISO was chosen to mitigate concerns regarding the unknown sensitivity of defeated mice to medetomidine administration considering evidence of unexpected mortality seen previously in a mouse model of chronic pain [53]. Evidence indicates that interhemispheric, cortico-cortical, and cortico-subcortical rs-networks, while supressed, remain detectable under low dose ISO (~1%) anesthesia [53, 98,99,100].
Conclusions
We found distinct patterns of FC between animals defined as susceptible or resilient using a well-established rodent model. The enhanced connectivity in SUS animals of the ventral hippocampus to limbic regions implicated in the activation of stress is consistent with existing chronic stress literature. A highly novel finding here is that of the hyperconnectivity of ventral hippocampus to prefrontal cortex as a consistent feature of RES animals. Neuroimaging analyses of clinically-relevant animal models thus allow for identification of novel pathways underlying individual differences in responses to chronic stress. An advantage of the neuroimaging approach is that it is operationally and analytically comparable across rodents and humans, thus providing translational value to the study of the neural basis for psychiatric disorders.


Responses