Revealing the hidden diversity of Chlorella heliozoae-infecting giant viruses

Introduction
The genus Chlorovirus comprises icosahedral giant viruses that infect eukaryotic green algae, playing a fundamental role in the Earth’s geochemical cycle1. Their linear dsDNA contains more than 300 genes encoding proteins and tRNAs, some of which include intronic regions2,3,4,5. The genomes of these ubiquitous giants can reach up to 410 kbp, with a GC content ranging from 40% to 52%1,6. These Chlorellaceae-infecting viruses exhibit a narrow host range and are generally classified into three clades, commonly known as the NC64A, Pbi, and SAG viruses, corresponding to the three known host species: Chlorella variabilis, Micractinium conductrix, and Chlorella heliozoae, respectively7,8. Recently, our group proposed that the genus Chlorovirus would be better classified into three subgenera, named “Alphachlorovirus,” “Betachlorovirus,” and “Gammachlorovirus”6, to avoid a strict association between viruses and their known hosts for classification purposes7. In this study, we will focus on gammachloroviruses.
The International Committee on Taxonomy of Viruses (ICTV) recognizes six species of Chlorovirus, with only one corresponding to a virus isolated using Chlorovirus heliozoae SAG 3.83 (ICTV, 2023). This 160 nm isolate, named Acanthocystis turfacea Chlorella virus 1 (ATCV-1), has a 288 kbp genome that shares less than 75% identity with the most studied isolate of the genus, Paramecium bursaria Chlorella virus 1 (PBCV-1)9,10. Interestingly, ATCV-1 has been associated with the human oropharyngeal virome and has been linked to changes in cognitive functions and motor deterioration11,12. These findings raise questions about the implications of chloroviruses and other algal viruses in human and animal health. In addition to ATCV-1, the genomes of 12 other Chlorella heliozoae-infecting isolates obtained between 2006 and 2008 have been sequenced and are available in the NCBI database, yet they remain to be fully characterized. These thirteen gammachlorovirus isolates were collected from samples in Germany, Brazil, Canada, Guatemala, and the United States7. The discovery of new isolates represents significant potential for genetic innovation and may expand the open pan-genome of the genus Chlorovirus13.
In this study, we confirm this potential by presenting and describing 24 complete genomes of the new subgenus “Gammachlorovirus.” Through phylogenomics and comparative genomic analyses, we demonstrate the greatest genetic diversity among chloroviruses yet, revealing nine new viral species with distinct and, in most cases, unique genomic features. Furthermore, we evaluate whether ecological barriers shape the diversity of these large algal viruses.
Materials and methods
Virus Isolation and Purification
Water samples were collected from various regions in three countries to investigate the presence of chloroviruses. Collection sites included Sisimiut (Greenland), Aysén (Chile), Colorado, and the Crescent Lake National Wildlife Refuge in Nebraska (USA). Samples were collected between 2013 and 2020. The samples were filtered through a 0.45 µm membrane and plaque-assayed using Chlorella heliozoae SAG 3.83 cells, incubated for up to two weeks at 25°C under constant light. Viral production and purification on sucrose density gradients were performed as previously described8.
Genomic Dataset: Genome Sequencing and Assembly
This study utilized genome sequences from 37 Chlorella heliozae-infecting viruses. The genome sequences of thirteen gammachloroviruses isolated before 2008 were downloaded from public databases7. The viral genomes of the other 24 isolates were sequenced and assembled as previously described6,7. Briefly, most new isolates were sequenced using PacBio technology. Raw long-read data were assembled de novo using Canu version 2.214, and genomes resulting in multiple contigs were organized using MeDuSa15, with a gammachlorovirus genome as the reference. One new isolate (GNLD-22) was sequenced using Illumina HiSeq 2500, and data were assembled using SPAdes assembler version 3.12.0. The new viral genomes were deposited in the NCBI GenBank database with accession numbers PQ067543 to PQ067566.
Gene Prediction and Annotation
Coding sequences (CDS) were predicted using GeneMarkS16 online software with “Prokaryotic” and “genetic code 11” parameters. tRNA prediction was performed using ARAGORN17 and tRNAscan-SE18. Results were processed by removing predicted CDSs shorter than 40 amino acids19 or less than 150 nucleotides from strand ends. CDSs overlapping tRNA regions or containing stop codons were also excluded. Ambiguous tRNAs predicted by both softwares were removed from the final dataset, as well as pseudo tRNA predicted by either software. The CDSs were annotated as previously described6,20. Briefly, the NCBI nr database was queried using the Diamond algorithm, considering only results with an e-value lower than 10-5. Protein domains were identified using HHpred, with results accepted only if the probability was ≥80%. Both results were compared to determine the best final hit. In cases of discordance, InterProScan software was used. For functional characterization, final hits were classified based on the Nucleocytoviricota orthologous groups of genes (NCVOG) database into ten categories13.
Phylogenetic Analyses
Alignments of amino acid sequences of the NCLDV hallmark genes21—packing ATPase A32, DNA polymerase family B, SNF2-like helicase, transcription initiation factor IIB, DNA topoisomerase II, and poxvirus late transcription factor VLTF3 (hereinafter A32, pDNA, SFII, TFIIB, Topo, VLTF3)—were concatenated to construct a phylogenetic tree of C. heliozoae-infecting viruses. In addition to the 37 gammachloroviruses (Table S1), three betachloroviruses were included as outgroups (Can18-4, accession code: JX997157.1; CVB-1, accession code: JX997160.1; CVM-1, accession code: JX997163.1). The six datasets were aligned using Muscle22 and then concatenated in Mega1123. The alignments were analyzed using the maximum likelihood method in IQ-TREE 224,25, with 1000 bootstrap replicates for statistical support of the nodes. Substitution models and site rate heterogeneity were set to Q.yeast+F + R3. The concatenated tree was visualized using iToL26.
Species Demarcation Criteria
The average nucleotide identity (ANI) of the 37 whole genomes was calculated using FastANI, hosted on the European Galaxy server (usegalaxy.eu). The results were organized into a similarity matrix that served as input for constructing a heatmap using in-house scripts written with the numpy27, seaborn28, and matplotlib29 packages for Python. Based on the heatmap, the species of gammachloroviruses were demarcated using a cutoff of 94% identity6.
Genomic Collinearity
To examine the genomic organization among gammachloroviruses, we selected one representative from each demarcated species (Table S2). The selection was random, except for tRNA organization, where the representative with the most numerous and diverse anticodons was chosen. In order to evaluate the synteny and the alignment of genomic elements, the Dynamic Genomic Alignment server (DiGAlign) version 2.0 was employed30. The nucleotide sequences of all representatives were utilized as the input for DiGAlign. In this server, gene prediction was conducted using Prodigal, and gene functional prediction was performed by searching against GenomeNet nr-aa using GHOSTX, with “The Standard Code” genetic code31,32. To evaluate local differences, alignments were performed using BRIG33.
The similarity of tRNA organization was assessed by listing all predicted tRNAs that were not excluded across the 37 genomes. These were grouped by species, and a representative containing the most numerous and diverse anticodons was selected. To evaluate tRNA synteny, the anticodons were aligned, and the distances between consecutive tRNAs were manually calculated.
Ortholog Clustering and Pan-Genome Construction
Predicted CDSs were clustered into orthologous groups (COGs) using the OrthoFinder tool34, with an MCL inflation parameter of 4. Each OrthoFinder run included sequential groups of multi-fasta files as input, containing nucleotide sequences. Data from the 37 genomes were progressively included in the runs (full run mode), following the same order as the organized ANI matrix, with dendroblast used for gene tree inference. In constructing the pan-genome of Chlorella heliozoae-infecting viruses, both the number of core genes (those shared by all isolates) and total COGs were considered. Results from each run were organized and plotted using GraphPad Prism 9, generating a pan-genome evolution graph. Additionally, a bipartite network graph was created to facilitate the comparison of COG sharing among viral species using Gephi35. The graph was built using the ForceAtlas2 algorithm to generate the final layout, with minimal manual adjustments to the nodes to highlight the singletons.
Statistical Analysis
We compiled all metadata generated in this study, including genome size, CDS count, tRNA count, and GC content into datasets for each genome. The viruses were grouped based on species demarcated in section 2.5. To assess the behavior of the datasets, we conducted Shapiro-Wilk tests for normality and Levene’s tests for homogeneity of variance, using a significance level of α = 0.05 for both tests. Following this, analysis of variance was performed to identify any differences between the means or medians of each group. If the p-values from the Shapiro-Wilk and Levene tests were > 0.05, we conducted one-way ANOVA tests, followed by Tukey’s multiple comparisons of means post-hoc tests. If those p-values were < 0.05, we performed Kruskal-Wallis rank sum tests, followed by pairwise comparisons using the Wilcoxon rank sum test with the Benjamini-Hochberg p-value adjustment. All tests were performed in R Studio, utilizing the native statistical tools in R version 4.2.236. Graphics were generated using the ggplot237 and ggsignif38 packages for R. To enhance the exploratory analysis of the data, we performed a principal component analysis (PCA) to identify possible clusters of genomes, using the factoextra package for R39.
Results
Genomic landscape of gammachloroviruses
The “Gammachlorovirus” subgenus was increased to 37 isolates with fully sequenced genomes (Table S1). The viral genomes range from approximately 283 to 385 kilobase pairs (kbp) (mean = 324,071 kbp), and the coding sequences (CDSs) range from 322 to 420 (mean = 380) (Fig. 1a; Table S1). Among all C. heliozoae isolates, S-NE-20 has the highest number of CDSs and the largest genome, while NES-4A-S1 has the fewest CDSs and the smallest genome identified in chloroviruses to date. The GC content ranges from approximately 48% to 52% (mean = 49.36%). The new isolate S-NE-7 has the lowest GC content at 48.03%, closely followed by NTS-1 at 48.18% (Fig. 1a; Table S1). The isolate MN0810.1 exhibits the highest GC content at 52.09%, approximately 1% higher than the second highest value. Unlike genome size, the addition of new isolates did not expand the range of GC content among the SAG-viruses40.

a Distribution plots of general genomic features of 37 gammachlorovirus isolates. Each point represents an isolate and the bars represent the standard deviation; b Distribution of tRNA anticodons encoded by each isolate. The width of the lines reflects the number of elements (raw data included in Table S3); c Functional characterization of viral genomes based on NCVOG. Around 40% of the genes encoded in each genome have no defined function (uncharacterized or miscellaneous).
All chloroviruses encode tRNAs. The number of tRNAs encoded by each genome in the gammachloroviruses varied from 6 in the isolates NES-5A-M1 and S-NE-18 up to 13 in isolates NES-5A-S1, Can0610SP, OR0704.3, and NE-JV-2 (mean = 10) (Fig. 1a; Table S1). The lowest tRNA count in “Gammachlorovirus” matched that of “Alphachlorovirus,” while “Betachlorovirus” NE-JV-1 encodes by far the fewest tRNAs (n = 3) among the genus Chlorovirus6,7.
Most tRNA genes found in “Gammachlorovirus” isolates shared similar anticodons (Fig. 1b; Table S3). We identified 18 anticodons cognate to 13 amino acids (5 pairs of synonymous codons) encoded in at least one of the 37 chlorovirus genomes. Together with the alphachloroviruses, which encode up to 18 tRNAs cognate to 12 amino acids in a single genome, these findings support the notion that chloroviruses possess a greater diversity of tRNAs than other phycodnaviruses6,41. Although two different clades of prasinoviruses comprise seven viral isolates from Ostreococcus lucimarinus green algae, all their ~190 kbp genomes encode the same five tRNAs42. The transporters for Arg, Lys, Leu, Pro, and Ile each have two synonymous anticodons, with one of them being more common in “Gammachlorovirus.” The only exception is the tRNA for Pro, which was detected with two equally present anticodons (AGG and CGG) in the only two genomes where they were found (in NES-4A-M1 and NES-5A-L1). The tRNAAsp (GTT) was the most prevalent in “Gammachlorovirus,” appearing one to four times in all genomes, consistent with findings across all clades of chloroviruses5.
Regarding functional annotation, 14,062 CDSs were predicted across the 37 isolates, averaging 1.17 CDS/kbp, similar to the ~1.1 CDS/kbp observed for PBCV-16,42. The most prominent functional categories of the proteins encoded by gammachloroviruses were DNA replication, recombination, and repair, followed by carbohydrate metabolism and virion structure and morphogenesis (Fig. 1c). DNA metabolism-related genes are also the most numerous in “Alphachlorovirus,” although the total number of genes in the other two categories remains lower than in the first6. Chloroviruses are known to encode many enzymes related to carbohydrate metabolism and possess a robust glycosylation machinery involved in synthesizing glycans, including those attached to their major capsid proteins43,44,45. Other categories with a moderate number of genes include virus-host interactions, nucleotide metabolism, protein metabolism, RNA processing, transcription, other metabolic functions, and miscellaneous functions. The smallest number of genes pertains to regulation, signal transduction, and translation, with lipid metabolism being the least represented category, which aligns with the hypothesis that this protein group is not abundant in many giant viruses of protists43.
Functional characterization of the CDSs also revealed that approximately 40% of genes were uncharacterized, with nearly 300 of them classified as ORFans (genes not previously observed in any other viral genome) accounting for 2% of all predicted genes in gammachloroviruses. Among the 13 previously described genomes, 69 ORFans were identified, averaging 5.3 per genome, while the 24 new genomes contained 219 ORFans, yielding a higher average of 9.1 per genome, with the GNLD-22 isolate having 16 ORFans. These findings underscore the importance of proteomic characterization, not only of at least one representative virion from each subgenus but also of the complex protein machinery expressed during the replication cycle of chloroviruses18.
Phylogeny of “Gammachlorovirus”: pros and cons for species demarcation
Seven hallmark genes are considered the most reliable for constructing phylogenies of Nucleocytoviricota, and the six present in chloroviruses (A32, pDNA, SFII, TFIIB, Topo, VLTF3) were utilized to reconstruct the phylogeny of extant gammachloroviruses45. The phylogenetic trees were rooted using betachloroviruses as outgroups, as they are phylogenetically closer to gammachloroviruses than alphachloroviruses6,7. The concatenated tree indicates that Chlorella heliozoae-infecting viruses have a single origin, supported by a high bootstrap value (>95) (Fig. 2). This suggests a common ancestor for all gammachloroviruses that underwent mutations enabling these viruses to specifically infect Chlorella heliozoae, rather than C. variabilis or M. conductrix. Phylogenetic reconstruction by Quispe et al.8 also proposed a single point of origin for the viruses previously known as SAG viruses.
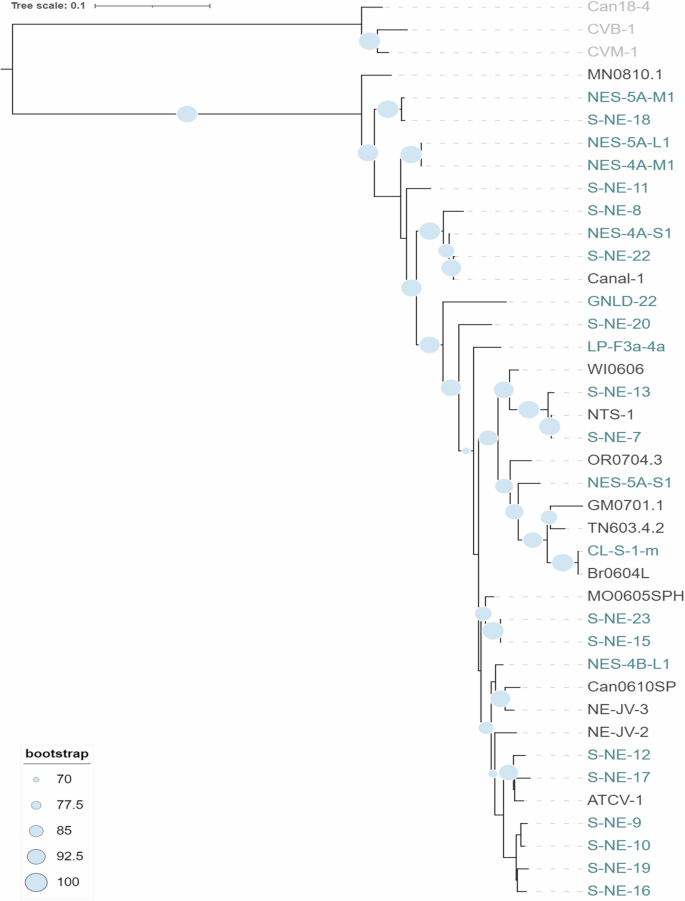
Phylogenetic tree based on the concatenation of six hallmark genes (A32, pDNA, SFII, TFIIB, Topo, VLTF3) in amino acids from Nucleocytoviricota. Viruses belonging to the proposed subgenus “Betachlorovirus” were used as an outgroup, indicated in light gray label. New isolates are indicated in green labels, while the other isolates are represented in black. Bootstrap values above 70 are shown. The scale bar refers to the substitution rate.
During the construction of the dataset, we noted several peculiarities in some genes that merit description. The dataset for DNA polymerase included only partial pDNA sequences for approximately 13% of the genomes (GM0701.1, S-NE-8, NES-4A-S1, Canal-1, and S-NE-22). For topoisomerase, the isolates GM0701.1, Br0604L, and CL-S-1-m (totaling 8% of the 37 genomes) also showed only partial hits among the predicted CDSs. This may result from intronic interruptions in the genes, which are already known for chloroviruses, particularly for pDNA2,3. More than one gene was annotated as SNF2-like helicase, with one of these duplicated in half of the genomes and absent in two isolates (NES-5A-M1 and NES-4A-S1). Consequently, the SFII dataset was constructed using the ATCV-1 Z643L protein (YP_001427124.1) as a reference, whose homologous sequence is duplicated only in S-NE-20. These limitations in dataset construction for chlorovirus hallmark genes and the variation in the topology of the individual trees (Fig. S1) underscore the importance of using combined hallmark genes for a more accurate understanding of the evolutionary history of Nucleocytoviricota viruses6,45,46.
The phylogeny reconstruction segregates the isolate MN0810.1 from all others, with bootstrap support exceeding 90%. The isolates S-NE-11, S-NE-20, and GNLD-22 are also distinct from other members of their respective clusters, with the latter located at the end of the longest branch of the tree. The hierarchical organization of some isolates was not clearly resolved, indicating a close relationship between pairs of approximately one-third of the isolates (e.g., NES-5A-M1 and S-NE-18, NTS-1 and S-NE-7, Br0604L and CL-S-1-m, Canal-1 and S-NE-22). Furthermore, some very short branches with low statistical support complicate the clear delineation of “Gammachlorovirus” clusters. To improve data resolution and delineate the species more effectively, we conducted an ANI analysis to compare the nucleotide composition of the entire genomes.
The new species of “Gammachlorovirus”
The average nucleotide identity (ANI) of “Gammachlorovirus” ranges from 81% to 100%. Two subgroups of isolates share more than 85% of their nucleotides and are separated from each other by the isolate GNLD-22, which will be considered the third subgroup (Fig. 3). An ANI cutoff of >94% was used for demarcating species of “Alphachlorovirus” and is proposed for other groups of chloroviruses6. In this study, we applied the same strategy and defined a total of ten species. Half of these consisted of only one isolate each (species II, V, VI, IX, and X), while the other five species comprised 3 (I, IV), 4 (VII, VIII), and 18 isolates (III) (Fig. 3). Some species include exclusively new isolates presented here for the first time (V, VI, VII, and IX), while other species (I, III, IV, and VII) gained representatives with the addition of the new isolates.
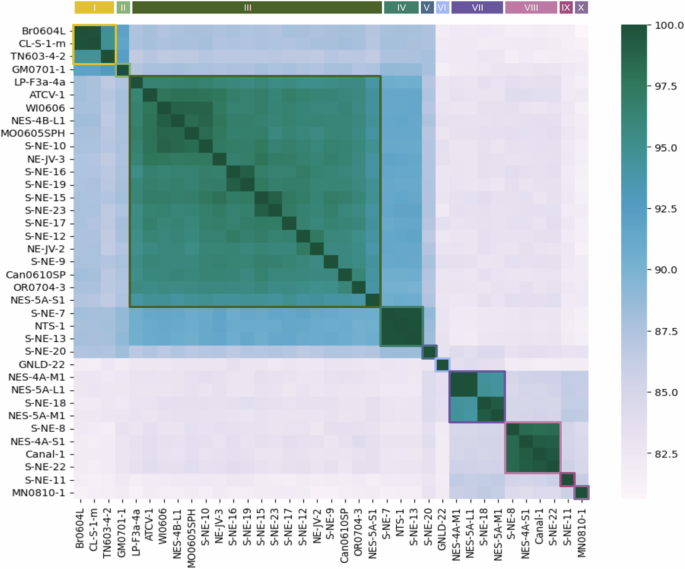
Average Nucleotide Identity (ANI) analysis comprising all 37 isolates. Identity values range from 81 to 100%. Based on the cutoff value of 94%, it is possible to observe 10 viral clusters (species), comprising 1 to 18 isolates. Viral species are indicated by Roman numerals and colored lines.
There are several correspondences between the phylogenetic and ANI results (Figs. 2 and 3). The isolates identified as separate from the others in the tree are the only representatives of their respective species: MN0810.1 (X), S-NE-11 (IX), S-NE-20 (V), and GNLD-22 (VI). GNLD-22, which has the longest branch in its clade, corresponds to an isolate that constitutes not only a species but an entire subgroup itself (Fig. 3). The isolates with close proximity that prevented their clustering in the phylogenetic tree share an average genomic similarity exceeding ~99%. However, distinct datasets are used for phylogenetic and ANI analyses. For phylogenetic reconstruction, the dataset comprises only six genes, which account for less than 2% of the predicted CDSs and ~3% of the gammachlorovirus genomes, whereas the nucleotide identity analysis is broader, based on the comparison of entire genomes. Consequently, it is anticipated that each analysis will present its own limitations and strengths, which may explain the few divergences observed between these results.
In terms of species demarcation, subgroup 1 consists of species I to V (average identity of 86.39%); subgroup 2 includes species VII to X (average identity of 83.98%); and subgroup 3 comprises only species VI. Notably, species VI shares nucleotides with all other isolates, showing no more than 84% and no less than 81.6% similarity with any of them, making it the most diverse “Gammachlorovirus” species in terms of nucleotide identity. Interspecific nucleotide identity is highest in subgroup 1, with a genomic similarity of ~91% between species III and IV and ~92% between species I and II. There is no significant similarity among species in subgroup 2, which exhibit identities near 85% among species VII, VIII, IX, and X. The greatest interspecific divergence occurs between species I and X, differing by at least 19% of their nucleotides. As expected, the species with the highest number of isolates (species III) shows the lowest intraspecific average identity (~96.5%). Species I, III, and VII have isolates with nucleotide sharing close to the 94% cutoff, suggesting a higher level of intraspecific diversity.
Given the recent increase in available chlorovirus genomes, it may be beneficial to select one representative from the nearly identical genomes to simplify datasets for further analysis. For example, 21 of the 37 “Gammachlorovirus” isolates share at least 98% of their nucleotides with at least one other isolate. This is observed across all species with multiple isolates in both “Gammachlorovirus” and “Alphachlorovirus,” with nearly 75% of genomes in C. variabilis-infecting viruses also exhibiting this similarity6. Although likely true for betachloroviruses, further investigation is needed. A non-redundant genomic database for Chlorovirus could be established using a ~ 99% identity cutoff, similar to previous database curation efforts for polinton-like viruses and giant viruses, including Algavirales47,48. By excluding genomes with as little as 1% dissimilarity, about 75% of chlorovirus genomes could be retained while maintaining reliability. This new approach may be particularly useful for broader analyses, including those involving metagenomic data. Here, we explored a similar strategy by selecting a representative of each proposed species for comparative genomic analysis.
Interspecific Diversity and Genomic Organization of Gammachloroviruses
The proposed definition of “Gammachlorovirus” species allows for a deeper investigation into the genomic properties of these viral species and the identification of unique features among them. For this purpose, one isolate was randomly selected as a representative of each species: Br0604L (I), GM0701.1 (II), ATCV-1 (III), S-NE-7 (IV), S-NE-20 (V), GNLD-22 (VI), NES-4A-M1 (VII), S-NE-22 (VIII), S-NE-11 (IX), and MN0810.1 (X).
Evaluating genomic features by species resulted in a compelling genomic landscape of “Gammachlorovirus” (Fig. S2). Principal component analysis (PCA) demonstrated a correlation between the number of CDSs and genome size (Fig. S2B). This mutual analysis of genome size, GC content, CDS, and tRNA count variation supports the ANI results, organizing C. heliozoae viruses isolates into two main subgroups (Fig. S2B, Fig. 3).
The representatives were also compared in terms of genomic organization, which is known to be well-conserved within each clade of chloroviruses7,49. A multiple alignment of the representatives’ genomes revealed a high degree of synteny among “Gammachlorovirus” species at the interspecific level. The observed percentage of identity between all genomes was consistently high, never dropping below 70% (Fig. 4). A significant level of conservation was evident in the central region of most genomes, while greater variability was observed at the extremities. Notably, certain transposition and inversion events were identified at the terminal regions of the genomes of representatives from species III, IV, V, VI, VII, VIII, IX, and X, with variations in size and position. With the exception of species VI, these events involved only small genome fragments.
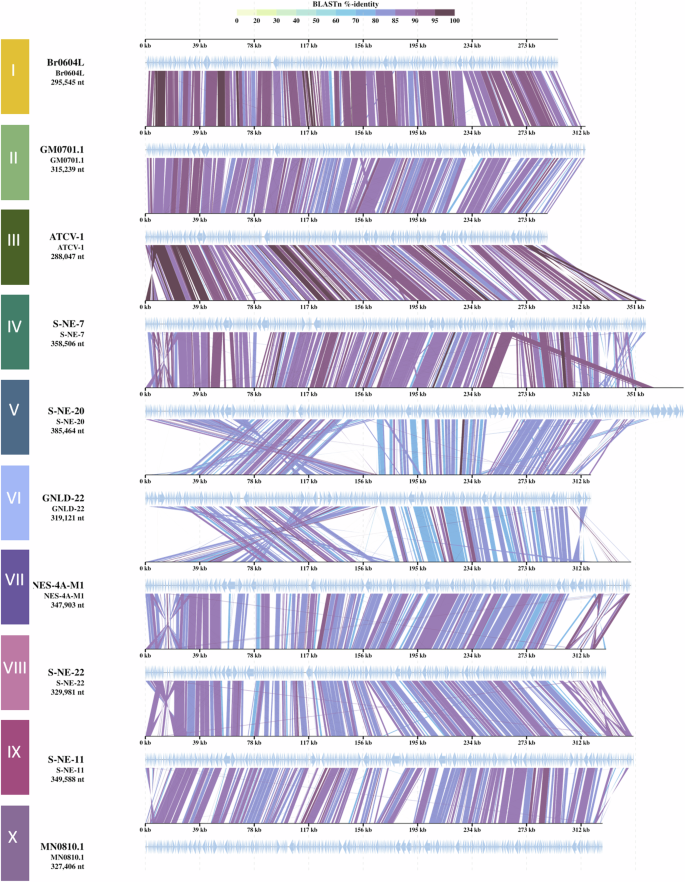
One representative isolate of each species, as defined by ANI analysis (Fig. 3), was selected for the synteny analysis. The isolates were designated as follows: I: Br0604L, II: GM0701.1, III: ATCV-1, IV: S-NE-7, V: S-NE-20, VI: GNLD-22, VII: NES-4A-M1, VIII: S-NE-22, IX: S-NE-11, and X: MN0810.1. The colored lines represent different genes, with the color indicating the percentage of identity.
Interestingly, the representative of species V had the largest genome among gammachloroviruses, exceeding the subgenus average by over 60 kbp (Fig. 1). This may explain the presence of an intriguing terminal region at the right end of the genome that showed no similarity to any other genome. These findings are supported by local alignment analyses, which highlighted extensive regions of low similarity in genomes exceeding 300 kbp, particularly in the 385 kbp genome of species V (Fig. S3). Overall, the genomic plots showed more regions of high similarity when compared across all species. Additionally, the data indicate a higher degree of identity among representatives of subgroup 1 (species I, II, III, VI, and V) compared to subgroup 2 (species VII, VIII, IX, and X), aligning with the results of the average nucleotide identity analyses (Fig. 3).
The greatest degree of variation in genomic organization is observed in species VI. Two inverted regions are observed in species VI, one situated in the first half of the genome (under 170 kb) and the other at the genome’s end (above 312 kb). In general, the percentage of identity is also lower when compared to the other species. Additionally, several gap regions are observed, as well as in the local alignment (Fig. S3). Interestingly, one transposition event relocated a tRNA cluster from its expected midpoint position to a site closer to the left end. These substantial genomic changes have only been documented in one species, and their biological implications, if any, are yet to be explored.
This unique organization of tRNA genes into clusters is also seen in certain other Phycodnaviridae viruses. For example, some prasinoviruses exhibit clusters of 2 to 5 consecutive tRNA genes5,50. In Ostreococcus lucimarinus virus 7 (OlV7), four out of five tRNA genes are clustered with a 1.5 kbp gap, while Micromonas pusilla virus 12 T (MpV12T) has a tRNAThr gene separated from its cluster by approximately 27 kbp42. This genomic trait may be an ancestral feature predating the divergence of chloroviruses into three major clades, as a tRNA cluster is located near the genome’s midpoint in chloroviruses5,51.
To investigate tRNA diversity within “Gammachlorovirus” species, the isolates with the greatest variability in predicted tRNAs were selected: Br0604L/CL-S-1m (species I); GM0701.1 (species II); ATCV-1 (species III); S-NE-7, S-NE-13, NTS-1 (species IV); S-NE-20 (species V); GNLD-22 (species VI); NES-4A-M1/NES-5A-L1 (species VII); NES-4A-S1/Canal-1/S-NE-22 (species VIII); S-NE-11 (species IX); and MN0810.1 (species X). For species I, IV, VII, and VIII, multiple isolates share the same tRNA organization.
The tRNA synteny in gammachloroviruses is well conserved both intraspecifically and among species (Figs. S4 and 5). Three amino acids – Arg, Gly, and Asp – are consistently encoded by tRNAs in all gammachlorovirus genomes (Figs. 1b and 5). Intronic regions are present in tRNATyr across all Chlorovirus genomes and in some algae-infecting viruses, such as those associated with Ostreococcus lucimarinus5,42. In addition to tRNATyr, some gammachlorovirus species exhibit intronic regions in two other tRNA genes: tRNAPro (species VII) and tRNAArg (species IX) linked to CGG and GCG anticodons, respectively. OlV7 also has tRNA genes with potential introns, including tRNAIle and tRNAGln. With some exceptions, OlV7 shares all five tRNAs with species III of “Gammachlorovirus” in the same order42. Notably, species IV is the only representative lacking tRNALeu, while species VIII uniquely encodes a tRNAMet. The tRNAPro was predicted for the first time in a C. heliozoae isolate (species VII), thereby expanding the tRNA repertoire in chloroviruses.
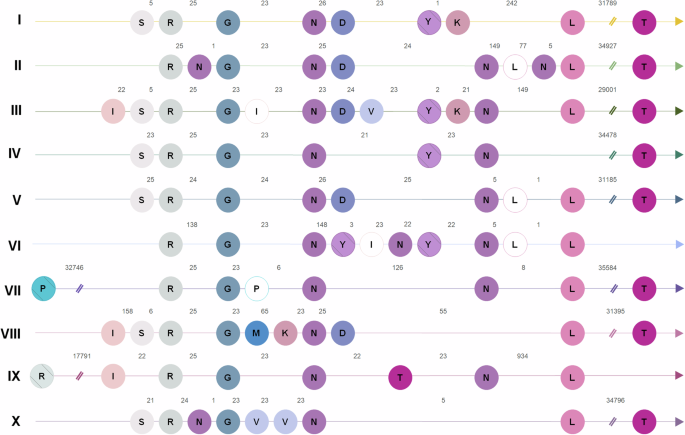
Schematic alignment of tRNAs found in representatives of each “Gammachlorovirus” species. Each line represents the genome of the isolate with tRNA’s greatest number and diversity. The isolate’s species is indicated by Roman numerals (I. Br0604L, CL-S-1-m; II. GM0701.1; III. NE-JV-2; IV. S-NE-7, S-NE-13, NTS-1; V. S-NE-20; VI. GNLD-22; VII. NES-4A-M1/NES-5A-L1; VIII. NES-4A-S1/Canal-1/S-NE-22; IX. S-NE-11; X. MN0810.1). Each tRNA is indicated by a circle and the letters in the circle correspond to the amino acid related to the tRNA. The arabic numbers indicate the distance between two consecutive tRNAs. The tRNA separated for the double slash is far from the tRNA cluster. Empty circles represent the use of a less frequent anticodon. Hatch circles represent tRNAs where introns are found. The alignment is scale-free, with the sole purpose of illustrating the positions of the tRNA in the genome among the different species.
Previous analyses of 13 gammachlorovirus genomes indicated that all C. heliozoae-infecting viruses have a tRNAThr gene located ~30 kbp downstream from the tRNA islet, similar to findings in MpV12T5. However, with the addition of 24 new genomes, we observed that this displacement occurs in only 80% of species. In species IX, tRNAThr is centrally located within the tRNA cluster, while species VI lacks a tRNAThr altogether, highlighting significant genomic differences among gammachlorovirus isolates. Some tRNAs exhibit redundancy, with two synonymous codons each (e.g., tRNAArg, tRNAPro, tRNALys, tRNALeu, tRNAIle). All tRNA genes, except for tRNAThr, are found within the islet (Fig. 1). Notably, tRNAPro and tRNAArg with intronic regions located at least ~17 kbp from the cluster, marking the first upstream displacement of a tRNA in Chlorovirus.
Distribution and Evolution of the Open Pan-Genome of Gammachloroviruses
With a robust dataset of 37 genomes, including 24 new isolates, we assessed the impact of these genomes on identifying new clusters of orthologous genes (COGs) in “Gammachlorovirus”. This analysis is crucial for evaluating the genomic novelty from ongoing isolation efforts. We grouped over 14,000 gammachlorovirus genes into 681 COGs, of which 130 are singletons. A core genome of 237 COGs was present in all 37 genomes.
Each of the ten species contained unique COGs, underscoring the genomic diversity of “Gammachlorovirus” (Fig. 6a). As anticipated, species IV, the least diverse with multiple isolates, had the fewest singletons (n = 2), while species III, with the most isolates, had the most singletons (n = 43). The other three species with multiple isolates had 7 to 14 singletons each, indicating some intraspecific diversity. Among single-isolate species, species II (n = 7) and V (n = 5) had the fewest singletons, while species VI (n = 15) and X (n = 17) had the most. Interestingly, species II and V are part of subgroup 1, which aligns with their lower number of exclusive COGs compared to more genetically diverse subgroup 2.
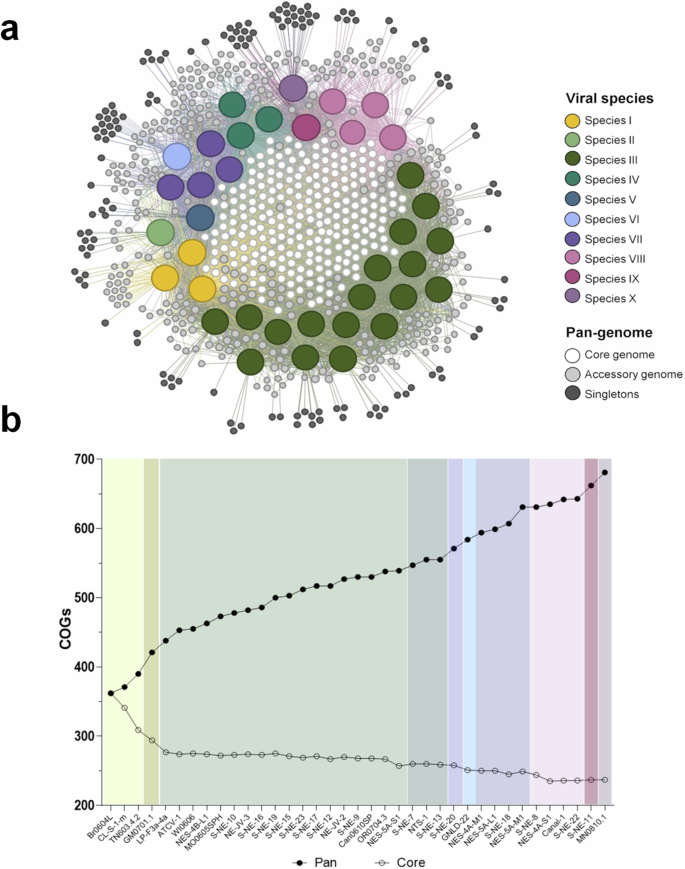
a COG-sharing network including the 37 gammachloroviruses and all COGs constructed using OrthoFinder, employing bidirectional Blastp with e < 1e-5. Each species is indicated as a bigger spot with different colors. COGs were categorized as: Core genome, as white nodes in the middle of the graph; Accessory genome as light gray nodes around viral species nodes, consisting of COGs found in at least 2 at most 36 viral isolates; and Singletons as dark gray nodes, corresponding to exclusively COGs found in a virus isolate. The graph was generated using a force-based algorithm, with minimal manual organization to allow clear visualization of singletons connections. b Evolution of pan-genome in gammachloroviruses. Pan: number of COGs in pan-genome. Core: number of COGs in core-genome. Viral isolates from the same species are demarcated with different colors. 237 COGs were found in all viruses (core) and 681 COGs were obtained comprising 14062 genes distributed among the 37 isolates.
As new viruses were incorporated, the total number of COGs increased, suggesting an open pan-genome (Fig. 6b). A recent study on “Alphachlorovirus” also identifies an open pan-genome, indicating potential for discovering new COGs by isolating chloroviruses from different algal species6. Open pan-genomes have also been noted in other NCLDVs, including mimiviruses and prasinoviruses52,53,54. In contrast, Coccolithovirus, predominantly sampled from similar regions, exhibited a closed pan-genome55. This suggests that ecological constraints may influence genomic diversity, although contrasting genetic characteristics among gammachlorovirus isolates from the same region indicate that genomic diversity is not always linked to environmental factors in the family Phycodnaviridae.
Absence of Ecological Barriers for Gammachlorovirus Diversity
Gammachlorovirus isolates sequenced to date have been collected from a wide range of geographical locations, including Germany, Brazil, Canada, Chile, Guatemala, and various states in the USA, as well as Greenland (Fig. 7). Notably, two-thirds of these isolates (n = 25) are from Nebraska, primarily from the Crescent Lake National Wildlife Refuge (CLNWR), an area rich in biodiversity with minimal environmental disturbance. Extensive searches for algal viruses have been conducted in Nebraska; however, C. heliozoae-infecting viruses remain unreported in many regions worldwide, including Africa, Asia, Oceania, and Antarctica.
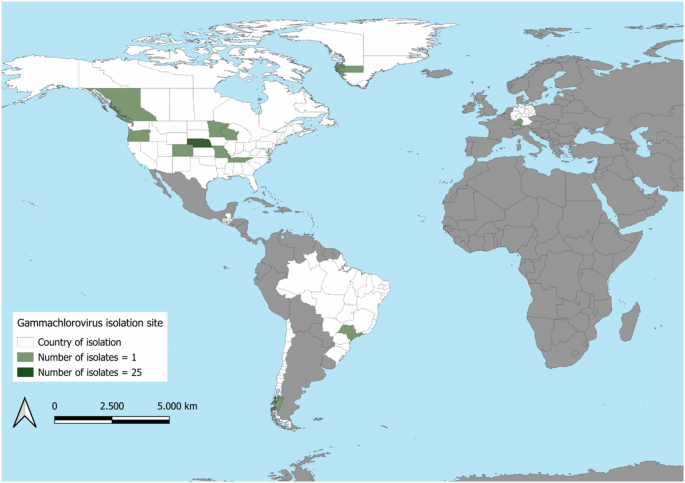
Location of isolation sites of all gammachloroviruses included in this manuscript. Countries of at least one isolate are indicated in white. Green indicates the number of isolates in each state/province: medium green indicates one isolate and dark green indicates twenty-five isolates.
Only two isolates from the Southern Hemisphere have been identified: CL-S-1-m from Chilean Antarctica and Br0604L from São Paulo, Brazil, both classified under species I. These locations, 3,500 kilometers apart, have starkly different climates: Chile being temperate and rainy, while São Paulo is subtropical. This suggests no ecological barrier driving gammachlorovirus diversity, a pattern also seen in alphachlorovirus, where isolates from vastly different locations show high genetic similarity6. Interestingly, southern isolates exhibited a higher coding density (1.25 CDS/kbp) compared to their northern counterpart (1.14 CDS/kbp), despite sharing over 94% nucleotide similarity.
Three species with multiple isolates (IV, VII, and VIII) comprised only CLNWR viruses, suggesting environmental factors may influence diversity. However, geographical location may not be the primary factor driving variation of genetic and biological traits of chloroviruses, as shown by the distinct genomic features of isolates from the same sampling site. For example, S-NE-13 and S-NE-17 were isolated from the same lake yet belong to different species. Notably, some species consist solely of isolates from the same region (species IV, VII, and VIII), underscoring that the exploration of factors influencing genetic diversity is in its early stages and requires careful consideration and further analysis.
Species VI, represented by the first giant virus isolated from Greenland (GNLD-22), exhibits significant genetic differences from other chloroviruses, potentially due to a genetic drift process over millions of years56,57. This raises questions about geographical barriers, particularly when comparing isolates from the Americas, as the geological conditions of Greenland may provide a different context for viral diversity.
Recent metagenomic studies have found Chlorellaceae and NCLDV in ice samples from Greenland, highlighting unexplored viral diversity in Arctic environments58,59. Exploring these regions is crucial for understanding the evolutionary history and diversity of Arctic giant viruses. Additionally, the natural distribution of Chlorella heliozoae, the in vitro host for gammachloroviruses, is poorly understood, reinforcing the need to use genomic criteria for defining species and subgenera of Chlorovirus, rather than relying on host-related criteria. The considerable genetic variability within this subgenus indicates that the major factors driving chlorovirus diversity are yet to be identified. New isolates from underexplored regions could provide valuable insights into the mechanisms of diversity in these viruses.
Discussion
Our results highlight significant genomic diversity within the subgenus “Gammachlorovirus”. Among the 24 new viruses described, we identified the smallest genome in the genus, along with over 200 unique ORFans and previously undetected tRNAs. C. heliozoae isolates are the most genetically diverse chloroviruses, with 10 proposed species identified among 37 isolates. This diversity can be further explored through in-depth analyses of highly variable genomic regions and by linking genomic features to other biological traits.
Our findings indicate that relying solely on isolated hallmark genes for phylogenetic reconstruction does not adequately represent chlorovirus evolutionary history. We stress the importance of using whole-genome similarity analyses, in addition to phylogenetics, for defining Chlorovirus species, a standard that could also benefit other NCLDVs. We introduce a new perspective on tRNA cluster organization and spark discussions on the factors influencing genetic variability in chloroviruses. We believe that geographical location is unlikely to dictate this variability, suggesting that future investigations should also evaluate the physicochemical and geographic parameters of aquatic environments where chloroviruses are isolated.
Currently, Chlorella heliozoae-infecting viruses have been found in only a limited number of regions across seven countries, leaving much of the world unexplored and rich with potential for new discoveries. The Greenlandic species highlights the need for further exploration and isolation of new chloroviruses to enhance our understanding of their diversity and evolutionary history. This study lays the groundwork for important questions regarding the hidden diversity within this significant group of microalgae viruses, with implications for other giant viruses in the Nucleocytoviricota.

Responses