Revealing the hidden link of the Walker circulation on heavy rainfall patterns in the Eastern Pacific
Introduction
Diabatic heating, driven mainly by latent heating from precipitation processes, shapes the large-scale circulation over the Pacific Ocean and subsequently climatological stationary waves that influence regional climate variability1,2,3,4,5,6,7. Rising warm, moist air in the western Pacific contrasts with lower-level heating in the eastern Pacific, establishing the east-west Walker circulation8,9,10. Studies have explored relationships between latent heating distribution and Walker circulation11,12. The contrasts in various parameters between the western and eastern Pacific are also noted (e.g., heating contrast, sea surface temperature (SST) control of convection, cloud-associated radar reflectivity profile, cloud types). At the same time, however, an intriguing question arises: can deviations in the Walker circulation intensity influence mesoscale deep convection activity over the eastern Pacific, where the Walker circulation-induced sinking motion predominates? Variations in the intensity of the Walker circulation suggest different sinking motions over the eastern Pacific, potentially affecting locally originated convection-induced vertical motion. Yet, this question remains unanswered due to a lack of observational evidence.
The question is of particular importance because it points to potential variations in rainfall patterns with the vertical distribution of diabatic heating, which significantly influences the global weather and climate conditions by altering the structures of atmospheric waves13,14. Furthermore, interactions between the Walker and Hadley circulations affect the subtropical high-pressure system, and associated cloud feedbacks within the climate system15,16,17. Moreover, future projections suggesting a potential weakening of the Walker circulation under global warming scenarios18,19 make this topic ever more relevant.
Climatological rainfall, reflecting convective activity and vertical motion patterns over tropical oceans, is commonly classified into two main modes: the ‘deep mode’ and the ‘shallow mode’20,21. The former is characterized by deep convective clouds, while the latter typically involves shallow cumulus clouds, often associated with congestus formations20. The shallow mode tends to occur in warm oceanic regions driven by low-level boundary layer convergence21,22. In contrast, the deep mode over the Pacific Ocean is predominantly associated with large-scale dynamics16,21, suggesting that deep and shallow modes can be treated separately. In this study, we first attempt to examine the potential influence of Walker circulation intensity on the convection activity over the eastern Pacific, focusing specifically on the deep convection mode. Instead of counting the total convection activity, which includes both deep and shallow modes, we isolate the deep convection mode and relate it to the Walker circulation. To do this, we identify rainfall events with intensities exceeding the rain rate of 10 mm hr−1 using satellite observations (see Methods). This effectively filters out precipitation from weaker convection or convection with lower tops, which may include precipitation associated with both shallow mode and deep convection-related stratiform clouds, but with the shallow mode dominating. However, if we take a long-term average, as we did in this study for six years, the results can be interpreted as deep convection-related precipitation while removing shallow mode precipitation. In this way, we can investigate the relationship between the intensity of the large-scale Walker circulation and the mesoscale deep convection activity over the eastern Pacific, and discuss implications of the results in the climate.
Results
Two types of deep convective heavy rainfall over the Pacific
In order to examine the relationship between the Walker circulation change and rainfall variability over the eastern Pacific, we select heavy rain events over two selected analysis domains (i.e., Western Pacific (WP) and Eastern Pacific (EP) in Supplementary Fig. 1), using rainfall rates derived from the Global Precipitation Measurement (GPM) satellite. A rain rate of 10 mm hr−1 is used as the criterion for determining a heavy rain event23,24,25,26, and GPM-derived rain drop size distributions for the selected heavy rain events (i.e., grid mean values of the DSD parameters) are analyzed to classify rain characteristics using the Gaussian mixture model (Methods).
Distributions of GPM Dual-frequency Precipitation Radar reflectivity profiles (Fig. 1a–d) clearly exhibit that two classified heavy rain types can be distinguished: one with deeper vertical extent and higher surface reflectivity (Fig. 1a and 1c), and the other with less deep vertical extent and relatively weaker surface reflectivity (Fig. 1b and 1d). Similar features were reported in Ryu et al. 27. Since these two types are for heavy rainfall ( > 10 mm hr−1), they can be referred to as “strong oceanic deep convection” and “moderately strong oceanic deep convection” types. In this study, we call these “Type 1 deep convection” and “Type 2 deep convection”, respectively, and in brevity, Type 1 and Type 2 are used hereafter.

a–d Reflectivity profiles for two heavy rainfall types over the western Pacific (WP) and eastern Pacific (EP) domains, and (e–h) associated drop size distributions. Vertical and horizontal bars given in (e–h) are standard deviations centered at mean values of Dm and log Nw.
The probability distributions of Type 1 and Type 2 reflectivity profiles in WP and EP are much alike, in case of the same rain type (Fig. 1a–d). Frequencies of mass-weighted mean diameter (Dm) and normalized intercept parameter (log Nw) of rain drop size distribution (DSD) for Type 1 and Type 2 – detailed explanation is provided in Methods – are given in Fig. 1e–h. Dm reduces from the strong type to the moderate type in both WP and EP (Fig. 1e–h), whereas log Nw increases. This means that the distributions of the calculated number density using the normalized form Testud et al. 28 of the gamma distribution function29 indicate that Type 1 has more of larger particles than Type 2. However, the general features of the DSD are nearly the same between WP and EP, for both Type 1 and Type 2.
Even though probability density function distributions of the Type 1 and Type 2’s intensity depend on the rain type and geographical region, their normalized values with respective total pixel numbers are found to be remarkably similar exponentially decreasing probability with the Type 1 and Type 2’s intensity (Supplementary Fig. 2). The very similar microphysics and statistical behaviors found in both WP and EP strongly suggest that Type 1 and Type 2’s associated microphysics are ubiquitous over the tropics.
Note that the grid mean values of DSD parameters for heavy rain pixels at a specific time were used in the type classification process. Since Fig. 1 shows results for all individual pixels, some overlap is observed, however, the grid mean values of Dm and Nw used for clustering are not overlapped27.
Contrasting two types of deep convective heavy rainfall over the Pacific
Despite very similar characteristics of the Type 1 and Type 2’s microphysics and the vertical distribution of reflectivity profile between WP and EP (Fig. 1), the satellite observation reveals that the Type 1 and Type 2’s frequency shows a sharp contrast in between WP and EP (Fig. 2), which is based on zonally averaged frequencies obtained from the two-dimensional distributions (Supplementary Fig. 3).
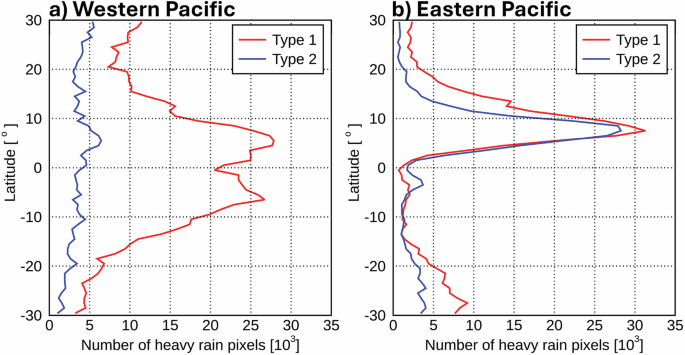
a The occurrence frequency of Type 1 (red) and Type 2 (blue) heavy rainfall averaged over the Western Pacific domain (see Fig. S1). Note that x– and y– axis indicates the number of heavy rain pixels and the latitude, respectively. b is the same as (a) except for the Eastern Pacific domain.
Over the WP domain, Type 1 is predominant: 80% of 1,066,288 total heavy rain pixels are found to be Type 1. Latitudinally near symmetric distribution is shown for Type 1 in the WP, with two peaks and an equatorial dip in the 10°N–10°S belt (Fig. 2a). About 20% of heavy rain pixels are found to be Type 2 with no clear latitudinal variation (Fig. 2a). In contrast, occurrence frequencies for both types in the EP are found to be comparable to each other (58% for Type 1 vs. 42% for Type 2 amongst total 700,054 heavy rain pixels) (Fig. 2b). Also noted are the similar latitudinal variations of the occurrence frequency between two heavy rain types, with peaks at about 8°N which corresponds to the annual mean position of ITCZ in the EP, indicating that Type 2 becomes important as well, compared to the smaller fraction shown in the WP domain. Note that Type 2 rainfall is predominantly prevalent over the subtropical oceanic subsidence regions, located at the flanks of highly convective areas where Type 1 dominates—except in the eastern Pacific (Supplementary Fig. 4).
Different rain types imply different vertical distributions of the diabatic heating including latent heating within the atmosphere (Methods) (Supplementary Fig. 5), as in different vertical extents of storm height (see Fig. 1a–d). Given the fact that the vertical distribution of the diabatic heating, especially in tropical regions, acts as a dominant force in inducing atmospheric circulation2,4,7,30,31,32,33,34, different heavy rain types suggest different diabatic forcings for the atmospheric circulation. In particular, the vertical motion in the EP ITCZ and its associated heavy rains are considered to be a crucial factor influencing the cloud distribution over the subtropics35,36. Recognizing that cloud feedback mechanisms over the EP subtropics are not well understood, causing significant challenges in climate simulations37,38,39, better representation of heavy rain types over the EP can lead to more precise feedback mechanisms and improved climate simulations.
Deep convective heavy rainfall modulated by Walker circulation over the EP
While the microphysical properties and storm intensities of Type 1 and Type 2 are similar between the WP and EP, there may be various environmental factors that could potentially favor the formation of specific heavy rain types in the EP (see Fig. 2). In this study, we hypothesize that subsidence associated with the large-scale Pacific Walker circulation, as one of the possible favorable conditions, may suppress deep convection driven by the local Hadley circulation. This suppression could lead to a higher occurrence of Type 2 in the EP.
To examine this notion, we construct zonally-averaged (150°W–90°W) meridional and vertical wind profiles and relative humidity over the EP domain that may be associated with Type 1 and Type 2 rainfall. Note that we use the pixel-based data obtained for the heavy rainfall cases (Fig. 3) (Methods). The circulation for Type 1 in the EP ITCZ is characterized with strong updraft motion throughout the troposphere in a narrow zone centered at 8°N (i.e., ITCZ), with a maximum upward motion at 850 hPa level and a second maximum at 320 hPa level (Fig. 3a). Outside the narrow zone of upward motion there is mainly weak sinking motion. With strong horizontal convergence in the lower layer below 850 hPa level toward the ITCZ and horizontal divergence above 300 hPa level out of the ITCZ, the overall zonal mean circulation represents the local Hadley-type circulation. On the other hand, the wind field for Type 2, presented as a deviation (i.e., Type 2 minus Type 1), shows that the vertical velocity at the ITCZ is weakened over the entire troposphere, with a maximum deviation at about 350 hPa level (Fig. 3b). Based on our findings that the dynamic conditions for the Type 2 over the EP are correlated with increased upper-level convergence and increased sinking motion over the ITCZ (Fig. 3b), we propose that the increased subsidence at the ITCZ could be caused by the strengthened large-scale Pacific Walker circulation. The proposed process may play a role in negating the deep convection generated by the local Hadley circulation in the EP. As a result, this could lead to the more occurrence of Type 2 in the EP than that in the WP. It is also worth noting that an intensified Walker circulation corresponds to a weakened Hadley circulation, as indicated by increased convergence above 400 hPa and increased divergence below 500 hPa, driven by the north-south wind component changes associated with Type 2 (Fig. 3b).

The 6-year mean cross-section of the zonally-averaged (150°W–90°W) meridional wind (m s−1; contours) and vertical velocity (Pa s−1; color grades) for (a) Type 1 and (b) deviation of Type 2 from Type 1 (i.e., Type 2 minus Type 1). In (b), grey circles and green dots indicate that meridional wind difference and vertical velocity difference, respectively, are significant at 95% confidence level. c, d are same as in (a, b) except for the relative humidity. Note that the unit for the vertical velocity is in negative, therefore, red (blue) color in this figure denotes an upward (downward) motion. In (d), green dots represent that relative humidity difference are significant at 95% confidence level.
The increased sinking motion induced by the strengthened Walker circulation (if there is any) may facilitate the more intrusion of dry air toward the lower altitudes, significantly affecting humidity levels. This dynamic is particularly evident when examining the moisture contrasts between Type 1 and Type 2 (Fig. 3d). A striking feature is the correlation between the moisture contrasts and their associated vertical motions across the ITCZ (Fig. 3b, d), despite the broader moisture shape. Note that the atmospheric conditions in the ITCZ depicted in Fig. 3, where deep convection dominates within the region, likely coincide with heavy rain events. Therefore, the observed moisture differences over the ITCZ are not only influenced by the different convection intensities between the two types, but also by the sinking motion induced by the Walker circulation. Deep convection keeps the cloud layers saturated, and thus without downward intrusion of dry air, the primary differences in moisture content between Type 1 and Type 2 would be located above the cloud top of the Type 2. We expect the cloud top for Type 1 is higher than that for Type 2 over the EP (see also Fig. 1g, h). Minimal differences would be present below Type 2 cloud top where cloud layers of both types exist. Therefore, the identification of drier layers extending into the 700–800 hPa levels in Fig. 3d underscores the critical influence of the Walker circulation-induced sinking motion in the formation of drier layers throughout the troposphere. More importantly, a stronger Walker circulation can lead to a greater intrusion of dry air towards lower altitudes, which in turn suppresses deep convective activity. This suppression could lead to a higher frequency of Type 2 over the EP, highlighting the significant interplay between the large-scale Walker circulation and precipitation dynamics.
Regarding the influence of the Walker circulation on convection suppression, stability change can serve as another significant factor, in the context of a stronger Walker circulation and increased Type 2 abundance. With the intensified Walker circulation, enhanced downward motion is anticipated over the tropical eastern Pacific. This anomalous downdraft associated with a stronger Walker circulation has the potential to enhance atmospheric stability across the Eastern Pacific region (Supplementary Fig. 6), thereby impeding the development of deep convection.
To further examine the role of large-scale Pacific Walker circulation, we show the composite field of the divergent wind when a particular heavy rain type occurs in the EP ITCZ area (4°N–12°N, 90°W–150°W) (Details in Method). The vertical cross-section of the mean divergent wind over the tropical Pacific is given for Type 1 in EP ITCZ area (Fig. 4a) while deviation field of (Type 2 minus Type 1) is given for Type 2 (Fig. 4b). The mean divergent wind field for the case of Type 1 in the EP shows the pattern of a typical Pacific Walker circulation. The air diverges from the WP and descends over the EP where the upper-level convergence is connected to the lower-level divergence (Fig. 4a). The circulation pattern for the Type 2, which is expressed as a deviation field, shows increased divergent winds in the upper layer over 140°E–170°E (westerlies) and in the lower layer over 150°W–120°W (easterlies), with the Walker circulation being more intensified in the case of the Type 2 over the EP than in the case of the Type 1 (Fig. 4b). This means that the intensified Walker circulation, which is associated with strengthened zonal SST gradient (Supplementary Fig. 7), can contribute to the enhancement of upper-level convergence and lower-level divergence over the EP region and thus to the anomalous sinking motion. Consequently, weakened upward vertical velocity in the EP ITCZ is characteristic feature of Type 2.

Vertical cross sections of east-west component of the divergent wind (arrow) and velocity potential (color shade) averaged over the 15°N–15°S latitudinal band for (a) Type 1 and (b) Type 2 expressed as a deviation from Type 1. In (b), black arrows and the green dots represent the places where the difference is significant at the 95% confidence level.
Summary and discussion
We first revealed a close link between large-scale Walker circulations and mesoscale heavy rain types, with a focus on the EP domain where both atmospheric diabatic heating and SST significantly influences the global climate14,40. It is noteworthy that this study does not begin by defining the intensity of the Walker circulation over the Pacific and subsequently analyzing the rainfall types in the eastern Pacific based on its variations. Instead, it investigates the east-west circulation over the Pacific in case of instances of Type 1 and Type 2 rainfall patterns in the eastern Pacific. Type 1 was predominant in the WP domain, while the EP domain had comparable frequencies of Type 1 and Type 2. The followings are key mechanisms for Type 2:
• Stronger downward motion: For Type 2 rainfall, intensified subsidence from the strengthened Walker circulation is evident, which limits the development of strong updrafts compared to Type 1 (Fig. 3b).
• Stronger dry air intrusion: Type 1 convection typically features stronger upward vertical velocities, leading to deeper cloud tops. This is also associated with weaker subsidence and less dry air intrusion, allowing the convection to develop more fully. In contrast, Type 2 events experience more pronounced sinking motion due to the strengthened Walker circulation, which extends dry air into deeper tropospheric layers (Fig. 3d).
• Enhanced stability: The anomalous downdraft associated with a stronger Walker circulation in Type 2 has the potential to enhance atmospheric stability across the Eastern Pacific region (Supplementary Fig. 5), thereby impeding the development of deep convection.
In summary, intensified subsidence (a dynamic process) leads to dryness in the lower layers (a thermodynamic process). This subsequently enhances stability (a thermodynamic process) across the Eastern Pacific region, thereby impeding the development of deep convection. A close link of mesoscale heavy convective rainfall and large-scale circulations over the EP domain should be incorporated into Earth system models. Therefore, it is worthy to explore how well current models capture these rainfall-circulation dynamics, which may give some guidance to specifically recommend to improve the model development. The Walker circulation is projected to weaken under global warming in most Coupled Model Intercomparison Project-type climate models41,42. Therefore, we speculate that a future weakening of the Pacific Walker Circulation under global warming acts to increase the frequency of Type 1 in the EP, more than in the WP for the tropical peak around 8°N. Subsequently, this phenomenon would significantly influence the diabatic heating structures and its associated atmospheric teleconnections from the tropics to the extratropics in a warmer climate. Future climate change simulations need to include the cloud-precipitation mechanisms reflecting the large-scale circulation influences over the EP.
Before closing, it should be noted that our main findings are largely based on limited satellite data for six years (2014–2019), which may affect the robustness of their conclusions. For example, a short period of six years may not adequately capture the long-term variability of the Walker circulation, especially considering interannual variability, such as El Nino and Southern Oscillation. In addition, it is not long enough to draw statistically significant conclusions about any long-term climate trends although it is not the purpose of the current study. Therefore, we may not rule out the possibility that the relationship of rainfall-circulation dynamics is different when the analysis period is extended.
Methods
Global Precipitation Measurement
Global Precipitation Measurement (GPM) Dual-frequency Precipitation Radar (DPR)-retrieved near-surface rain rate (RR), mass-weighted mean diameter (Dm), and normalized intercept parameter (Nw) at clutter-free bottom level43 for heavy rainfall ( > 10 mm hr−1) are used for characterizing the heavy rainfall types over two regions in the tropical Pacific. The clutter-free bottom level refers to the lowest altitude where DPR is not affected by ground clutter. In addition, attenuation-corrected radar reflectivity profiles at the Ku-band (version 6) are used for examining the vertical structure of reflected precipitation signal. Details of the DSD parameter retrieval methods, uncertainty levels are found44.
Heavy rainfall clustering in the western and eastern Pacific
The rainfall is composed of a variety of raindrop spectra, which can be well represented by drop size distributions (DSD, i.e., Dm and Nw) of droplets. The DSD is known to be valuable as one of parameters characterizing the precipitation, because DSDs are largely determined by cloud-scale processes and mesoscale thermodynamic and dynamic environmental conditions45. The detailed analysis methods for separating the heavy rainfall into characteristic types are found in Ryu et al. 27. Here we briefly introduce how the heavy rain types are clustered with DSD parameters (Dm and Nw). Heavy rain pixels and associated Dm and Nw are collected at each equal-area grid, equivalent to the 5° × 5° grid area over the equatorial region, at a given satellite overpass time. Heavy rain event is assumed to exist in the 5° × 5° grid box if any heavy rainfall > 10 mm hr−1 pixel is detected in the box. After selecting heavy rain pixels for the given grid box over the six-year period from 2014–2019, a raw data set containing the Dm, Nw (“paramDSD”), RR (“precipRateNearSurface”), and Ku-band radar reflectivity (“zFactorCorrected”) is constructed from the DPR level-2 product. Quality control was performed to remove bad pixels using the data quality information (“qualityFlag”) provided by the DPR product. Because of the relatively short data period, the annual cycle or inter-annual variability is not considered in the analysis. Instead, we present results as an annual mean feature. Each heavy rain pixel and associated DSD parameters are tagged with heavy rain occurring time and grid location. Geographically uneven samplings caused by the latitude-dependent frequencies of the GPM satellite visit are taken into account, to avoid latitudinally varying sampling bias. Selected heavy rain pixels within a grid are averaged to yield mean RR, Dm, and logNw for a specific grid and for a given day. The DPR Ku-band reflectivity profiles for heavy rain pixels are also compiled.
Classifying heavy rain types, the Gaussian mixture model (GMM)46 is applied to the constructed data of Dm and logNw for heavy rain events. The GMM is a probabilistic clustering method that classifies subpopulations within a dataset by assuming the data is generated from a mixture of multiple Gaussian distributions. This clustering method makes it essential to specify the number of clusters. The number of clusters was set to three as in Ryu et al. 27, and two ocean-related types were selected. Classification is done separately at two chosen analysis domains, namely the western Pacific domain (30°N–30°S, 120°E–180°E) and the eastern Pacific domain (30°N–30°S, 90°W–150°W) (see Supplementary Fig. 1). Those two analysis domains are referred to as the WP domain and the EP domain, and those are generally referred to as two epicenters of the Pacific Walker circulation cell. The global heavy rainfall distributions show wide-spread heavy rainfall in the WP domain, in contrast to the narrowly concentrated equatorial rain band in the EP domain (Supplementary Fig. 1). Also noted in the rainfall distributions in the EP domain are rare heavy rains in northern and southern flanks of the narrow equatorial rain belt, which are largely coincident with large-scale sinking areas of the climatological north-south Hadley circulation cell.
Constructing atmospheric variables between two deep convective rainfall over EP
To understand the atmospheric environmental conditions linked to GPM DPR-observed specific heavy rain types over the Eastern Pacific (EP) domain, we construct atmospheric wind fields and humidity corresponding to each heavy rain event over the EP domain, using the ERA5 reanalysis datasets. When a GPM DPR rain pixel exhibiting a particular rain type (Type 1 or Type 2 heavy rainfall) is identified at any given time and location over the EP, the temporally collocated ERA5 reanalysis 1° × 1° wind field47 and humidity for 23 vertical levels from 1000 hPa to 200 hPa over the entire EP domain is saved for that specific pixel. This process is repeated until the collocation is completed for all heavy rain pixels in the EP domain over a 6-year period.
To derive the mean wind field and humidity representing a particular type of heavy rainfall, all collected three-dimensional wind and humidity distributions are averaged, effectively weighting the wind field and humidity with the number of heavy rain pixels over the EP. Since heavy rain pixels are most abundant over the EP ITCZ region, the averaged wind field and humidity can be interpreted as the synoptic wind field, mostly responsible for heavy rains over the EP ITCZ. Finally, the zonal mean cross section of the horizontal and vertical winds and humidity over the EP domain are obtained. In the EP domain, where the occurrence frequencies of the two heavy rain types are similar, and the composite fields are derived from wind and humidity data coinciding with heavy rain pixels, the latitudinally averaged wind fields and humidity should not show significant differences between the strong and moderate types. Therefore, instead of providing separate cross sections of composite mean wind field and humidity for each rain type, we present a mean field for Type 1 and the deviation of Type 2 from Type 1.
Cross-section of the east-west divergent wind over the tropical Pacific
Examining the east-west circulation present at the time when heavy rain event occurred in the EP domain, we construct a composite cross-section of the divergent wind over the Pacific Ocean. In this case, instead of considering heavy rain events over the entire EP analysis domain, it is examined for the events occurred only over the EP ITCZ area (4°N–12°N, 90°W–150°W). In this composite analysis, if there a specific rain type is found at a pixel at a specific time in the selected EP ITCZ area, then temporally collocated divergent wind field over the entire tropical Pacific is saved for the next averaging process. After completing the searching process to find the divergent wind fields corresponding to all heavy rain pixels over the EP ITCZ area over the six-year period (2014–2019), the 6-year mean divergent wind field is obtained by taking a simple mean of all selected divergent wind fields. Again, the resultant mean divergent wind is the mean weighted with the number of pixels for certain type of heavy rainfall. Finally, the vertical cross section of the divergent wind at a given longitude is obtained by taking the latitudinal band average over a band between 15°N and 15°S.
Diabatic heating
To understand the difference in thermodynamic effects caused by the rain clouds of strong and moderate convective types, we calculate the diabatic heating profile for each type. For the large-scale tropical circulation, thermodynamic equation can be simplified as a balance between diabatic heating and adiabatic cooling48,49,50 (44–46). Therefore, diabatic heating equation can be written as (-{S}_{p}omega =Q), where ({S}_{p}equiv -(T/theta )(partial theta /partial p)) is the static stability parameter, (omega equiv {dp}/{dt}) is the vertical velocity, and (Q) represents diabatic heating. The mean diabatic heating profile fields for the strong and moderate types are calculated using a daily ERA5 reanalysis data constructed in the same method as when calculating the atmospheric wind fields.
Responses