Reversible downregulation of MYC in a spheroid model of metastatic epithelial ovarian cancer
Introduction
Ovarian cancer is the fifth leading cause of cancer deaths across females of all ages and ethnicities based on recent US data [1]. Amongst ovarian cancers, epithelial malignancies are the most common, making up 90% of cases [2], of which most are high-grade serous carcinomas [3]. Risk factors include age, mutations in BRCA1 or BRCA2 [4,5,6], family history of ovarian/breast/colorectal cancer [7], post-menopause hormone-replacement therapy [8], and nulliparity [9]. Most ovarian cancer patients are diagnosed at an advanced stage, and recurrence of chemoresistant disease is common. As such, outcomes are typically poor, with a five-year survival rate of 50% [1]. Advanced-stage epithelial ovarian cancer (EOC) is frequently characterized by an accumulation of fluid within the peritoneal cavity known as malignant ascites [10, 11], the presence of which is associated with particularly poor outcomes [12]. In addition to malignant cells, a number of non-malignant cell types are also typically present in ascites, such as mesothelial cells [13], fibroblasts, and immune cells [14, 15].
Multicellular aggregates of EOC cells, also known as spheroids, are frequently present in ascites from advanced-stage patients [16]. These structures possess the capacity to adhere and implant onto peritoneal surfaces, leading to the establishment of metastases at distant sites [17, 18]. Numerous studies in cell culture models have shown that adherent EOC cells and spheroids differ in their molecular profiles [19,20,21], and consequently have distinct characteristics. Compared to adherent cells, EOC spheroids exhibit features of quiescent cells, suggesting that EOC cells enter a state of dormancy during transit that is reversed upon reattachment at peritoneal surfaces [22]. EOC spheroids also exhibit increased resistance to anoikis [23] and chemotherapeutic agents [24]. It is plausible that such properties, acquired by EOC cells upon spheroid formation, may contribute to the challenges associated with treating EOC.
MYC encodes a transcription factor that promotes cell growth and proliferation by regulating the expression of genes involved in the cell cycle, metabolism, apoptosis, and other cellular functions, and is amplified and/or overexpressed in the majority of cancers [25]. MYC is particularly relevant in the context of ovarian cancer, where amplification occurs in nearly half of cases [26]. Regulation of MYC abundance occurs at the transcriptional and post-translational levels, with additional effects on MYC activity mediated by interaction partners. In particular, phosphorylation of MYC at Thr58 is associated with proteasomal degradation, while phosphorylation at Ser62 is associated with increased stability and transcriptional activity [27]. While the pro-proliferative effects of MYC confer growth advantages to malignant cells, this comes at the cost of elevated metabolic requirements [28].
We previously performed transcriptomic analyses indicating that MYC-associated transcriptional signatures are attenuated in EOC spheroids compared to adherent cells [29]. Given the well-established role of MYC in promoting cell proliferation, we thus hypothesized that attenuation of MYC activity is a common molecular feature of EOC spheroids. In this study, we present evidence indicating that MYC is rapidly downregulated via proteasomal degradation in EOC spheroid cells, but is restored upon reattachment to an adherent surface. We propose that MYC downregulation in this context represents part of an adaptive strategy used by EOC cells to acquire a reversible state of dormancy during metastatic transit.
Results
MYC-associated gene expression is altered in EOC spheroids
In order to identify molecular pathways that are differentially regulated in EOC spheroids and adherent cells, we had previously performed microarray-based transcriptomic profiling of OVCAR8 and iOvCa147 ovarian cancer cell lines cultured in ultra-low attachment (ULA) or adherent conditions [29]. Gene set enrichment analysis [30] using the MSigDB Hallmark Collection [31] revealed that MYC-associated gene sets were enriched in adherent cells as compared with ULA cultures in both cell lines (Fig. 1A, B). To confirm these results, we assessed expression of several canonical MYC-activated (BYSL, NOLC1, PPRC1, and NDUFAF4) and MYC-repressed (SKIL, ARRDC3, and AKR1C3) genes by RT-qPCR using five EOC cell lines (OVCAR8, iOvCa147, COV362, OVCAR4, 105C) cultured under adherent and ULA conditions. Overall, EOC spheroids exhibited decreased expression of canonical MYC-activated genes and increased expression of MYC-repressed genes (Fig. 1C). In addition, we queried a recently-published single-cell RNA-Seq dataset [32] to compare MYC-associated transcriptional signature scores in primary tumour- and ascites-derived EOC cells from HGSOC patient samples. For the two samples in which there were sufficient EOC cells analysed in ascites (HGSOC5 and HGSOC8), MYC TARGETS V1 and V2 signature scores were significantly decreased in ascites-derived EOC cells as compared with matched primary tumour EOC cells (Fig. 1D and Supplementary Fig. 2). Together, these data suggest that there is a general suppression of MYC transcriptional activity during active metastatic transit.

A MSigDB Hallmark gene sets enriched (p < 0.05, FDR < 0.01; top 10 by magnitude of Normalized Enrichment Score are shown) in EOC adherent cells (adh) or spheroids (sph), with MYC-associated gene sets highlighted with blue and red bars. B Enrichment plots for significantly-enriched MYC-associated gene sets in A. “NES” indicates Gene Set Enrichment Analysis Normalized Enrichment Score. C Expression of selected MYC-activated (blue) or MYC-repressed genes (red) in EOC cell lines as assessed by RT-qPCR. Gene expression data were grouped by gene, where each data point represents the average expression across 3 biological replicates for each of 5 cell lines (105C, COV362, iOvCa147, OVCAR4, OVCAR8). GAPDH was used as an internal control for normalization. Data are shown as mean ± SEM, n = 5. D MYC-associated transcriptional signature scores for primary tumour- and ascites-derived “epithelial cells (Cancer cells)” in samples from two patients (HGSOC5 and HGSOC8); for each group, quartiles are separated by dashed lines. For C, log2fold-change values (sph/adh) for each gene were compared by two-tailed, one-sample Student’s t test to 0. For D, the mean signature scores for site-of-origin groups were compared by Welch’s t test. (****p < 0.0001; **p < 0.01; *p < 0.05.
MYC protein levels are decreased in spheroids
MYC activity is tightly regulated at transcriptional, translational [33], post-translational [34], and protein-protein interactional [35] levels. Thus, we first sought to determine whether MYC protein abundance differs between adherent cells and spheroids by expanding our analysis to a panel of 29 cell lines representing high-grade serous (HGSC), clear cell carcinomas (OCCC), endometrioid carcinoma (EC), and their respective precursor cell models. Generally, HGSC frequently features mutations in the TP53 gene and a high degree of genomic instability [36], as well as Wilms’ tumour gene 1 (WT1) positivity [37]. OCCC commonly feature mutations in the ARID1A [38] and PIK3CA [39] genes and are typically WT1-negative and napsin A (NAPSA)-positive [37]. EC commonly feature mutations in the PTEN, CTNNB1, ARID1A [38], KRAS, and PIK3CA genes [40], are typically WT1- and NAPSA-negative, and progesterone receptor (PR)- positive [37]. We found that in samples collected at d3-post seeding, MYC protein abundance was decreased in spheroids as compared with adherent cells in most cell lines tested irrespective of histotype (Fig. 2A–C), and altogether MYC exhibited a statistically significant reduction in spheroids (Fig. 2D). Similarly, MYC mRNA was significantly downregulated in EOC spheroids (Fig. 2E). Notably, a subset of cell lines, including ES-2, RMG-II, OVTOKO, and COV318 did not exhibit an appreciable decrease in MYC protein levels in spheroids. We also assessed abundance of MYC-associated factor X (MAX), a MYC dimerization partner that is required for activation of MYC target gene transcription [41]. Changes in MAX protein abundance were similar to those of MYC, with a significant decrease in spheroids for COV362 and OVCAR4 cell lines by d3 post-seeding (Fig. 2F, G). These results establish that MYC and MAX protein are less abundant in EOC spheroids compared to adherent cells, a result which is consistent with the observed decrease in MYC transcriptional activity.

A Survey of MYC protein abundance in spheroids relative to adherent cells for a panel of 29 EOC cell lines; densitometry data from immunoblot analysis are shown. Bars indicate mean MYC protein expression (sph/adh). B MYC protein abundance in spheroids relative to adherent cells for a representative panel of EOC cell lines; representative immunoblots and (C, D) densitometry (for C, data are shown as mean ± SEM, n ≥ 3; for D, n = 29). ◆ indicates band likely corresponding to cross-reactivity with CRMP2 [70]. E MYC mRNA in EOC spheroids vs. adherent cells as determined by RT-qPCR. Each data point represents the mean log2fold-change (sph/adh) for a single cell line from 2 independently repeated experiments. Data are shown as mean ± SEM. MAX protein abundance in spheroids relative to adherent cells for several EOC cell lines are shown with (F) representative immunoblots and (G) densitometry. Data are shown as mean ± SEM. For C–E, and G, log2fold-change (sph/adh) values were compared to 0 by two-tailed, one-sample Student’s t test (n ≥ 3); ****p < 0.0001, ***p < 0.001; **p < 0.01; *p < 0.05; ns not significant. All protein lysate samples were collected at day 3 post-seeding. Actin or vinculin were used as loading controls for all immunoblot analyses.
Rapid proteasomal degradation of MYC protein in EOC spheroids
As a first step towards identifying the primary mechanisms regulating MYC abundance in EOC spheroids, we assessed MYC protein abundance and its phosphorylation status at Thr58 and Ser62 in EOC adherent and spheroid cells over an early time course of up to 8 h post-seeding. MYC protein abundance was significantly decreased in spheroids as compared with adherent cells as early as 2 h, indicating that depletion of MYC protein occurs rapidly after cell detachment (Fig. 3A). Phosphorylation of MYC at Thr58, which is associated with its ubiquitylation and proteasomal degradation [42], was elevated in EOC spheroids but reached significance only by 6 h post-seeding (Fig. 3B). We observed no difference in phosphorylation of MYC at Ser62, which is associated with enhanced stability [42] (Fig. 3C). Taken together with our previous data, MYC protein is rapidly depleted in EOC cells upon detachment, with elevated phosphorylation at Thr58 suggesting a ubiquitin-proteasome-mediated mechanism.

A MYC protein abundance in COV362 adherent cells (A) and spheroids (S), assessed by immunoblot analysis using vinculin as a loading control. B p-MYC (Thr58) levels in COV362 adherent cells and spheroids assessed by immunoblot analysis. C p-MYC (Ser62) levels in COV362 adherent cells and spheroids assessed by immunoblot analysis. ◆ indicates band likely corresponding to cross-reactivity with CRMP2 [70]. For A–C, data are shown as mean ± SEM, n = 3, and log2fold-change (sph/adh) values at each time point were compared by two-way ANOVA and Sidak’s multiple comparisons test. ****p < 0.0001, ***p < 0.001; *p < 0.05.
To test the idea that proteasomal degradation is the primary mechanism underlying decreased MYC protein abundance in EOC spheroids, COV362 and OVCAR4 EOC cells were treated with the proteasome inhibitor MG132 at early (2 h post-seeding) or late (66 h post-seeding) time points during ULA culture. Consistent with a proteasomal mechanism of depletion, MG132 treatment resulted in a significant accumulation of MYC protein in EOC spheroids for all conditions (Fig. 4A–D). Notably, the MG132-induced increase in MYC protein was greater in OVCAR4 spheroid cells at the early time point (6.7-fold) than the later time point (1.7-fold). This may be a consequence of MYC mRNA downregulation in EOC spheroids (Fig. 2E), which we suspect contributes to sustained MYC protein depletion. In adherent cells, MG132 also increased MYC protein abundance, with the exception of OVCAR4 cells subjected to late treatment (Fig. 4A–D). For both COV362 and OVCAR4 cell lines, two-way ANOVA revealed a significant main effect of culture condition (spheroid vs. adherent) on MAX protein levels in the late treatment design (Fig. 4G–H). However, subsequent pairwise comparisons using Tukey’s multiple comparisons test did not show any significant differences between the experimental groups. Additionally, our analysis found no significant main effect of MG132 on MAX protein levels, suggesting that depletion of MAX protein in EOC spheroids is not mediated by proteasomal degradation (Fig. 4E–H). Additionally, given that we observed increased phosphorylation of MYC at Thr58 in EOC spheroids by 6–8 h post-seeding, we also assessed the effect of MG132 on p-MYC (Thr58) and p-MYC (Ser62) under the early-treatment design. MG132 had no notable effects on MYC phosphorylation at Thr58 in COV362 or OVCAR4 cells (Supplementary Fig. 4A, B) but did significantly decrease phosphorylation at Ser62 in OVCAR4 adherent cells (Supplementary Fig. 4C, D). Overall, these data suggest that detachment-induced depletion of MYC protein in EOC cells is mediated primarily by proteasomal degradation, whereas MAX protein follows an independent mechanism.
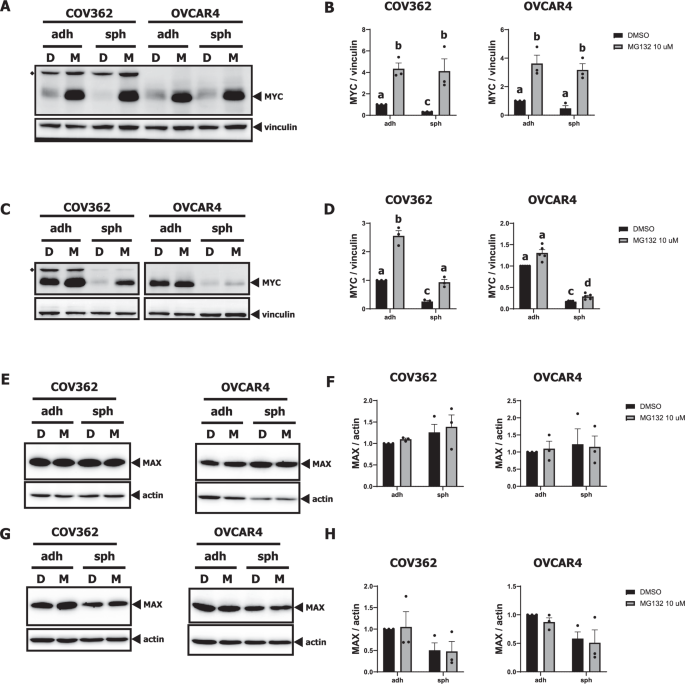
A, B MYC protein abundance in COV362 and OVCAR4 adherent cells (adh) and spheroids (sph) treated with DMSO (D) or 10 μM MG132 (M) 2 h post-seeding and collected 6 h later, or (C, D) treated 66 h post-seeding and collected 6 h later, as assessed by immunoblot analysis using vinculin as a loading control. ◆ indicates band likely corresponding to cross-reactivity with CRMP2 [70]. E, F MAX protein abundance in COV362 and OVCAR4 adherent cells (adh) and spheroids (sph) treated with DMSO (D) or 10 μM MG132 (M) 2 h post-seeding and collected 6 h later, or (G, H) treated 66 h post-seeding and collected 6 h later as assessed by immunoblot analysis using actin as a loading control. In all bar graphs, data are shown as mean ± SEM. n = 3 for all groups except for OVCAR4 in D, where n = 5. For B, D, F, and H, log2fold-change values relative to DMSO-treated adherent cells at each time point were compared by two-way ANOVA and Tukey’s multiple comparisons test, performing all pairwise comparisons; when present, letter labels above bars indicate the presence (the groups being compared have different letter labels) or absence (the groups being compared have the same letter label) of significant (p < 0.05) pairwise differences between groups.
MYC protein and activity are restored in EOC spheroids upon reattachment
Upon reattachment, EOC spheroid cells typically disperse into a proliferative monolayer-like arrangement surrounding the attached spheroid. Given that MYC protein abundance is elevated in adherent cells as compared with spheroids in nearly all tested cell lines, we surmised that MYC protein and activity would be restored upon spheroid reattachment. To test this idea, COV362 and OVCAR4 cells cultured as spheroids for 3 d were transferred to standard adherent culture vessels. Indeed, reattached COV362 and OVCAR4 spheroids had significantly increased MYC protein abundance (Fig. 5A, B) and expression of canonical MYC-activated genes (Fig. 5C). We also assessed phosphorylation of MYC at Thr58 and Ser62, given the roles of these post-translational modifications in regulating MYC protein stability. In OVCAR4 cells, reattached spheroids exhibited decreased phosphorylation of MYC at Thr58 compared to d3 spheroids, a trend not observed in COV362 cells (Supplementary Fig. 5A, B). Conversely, in COV362 cells, reattached spheroids exhibited decreased phosphorylation of MYC at Ser62 compared to d3 spheroids, but this pattern was not observed in OVCAR4 cells (Supplementary Fig. 5C, D). These results indicate that while changes in post-translational regulation of MYC occur upon spheroid reattachment, they vary across EOC models, which may reflect the heterogeneity of the disease. Overall, these data suggest that depletion of MYC protein and its associated transcriptional activity in EOC spheroids is reversible upon reattachment.

A, B MYC protein abundance in COV362 and OVCAR4 adherent cells (adh), spheroids (sph), and reattached spheroids as assessed by immunoblot analysis using vinculin as a loading control. ◆ indicates band likely corresponding to cross-reactivity with CRMP2 [70]. C Expression of selected canonical MYC-activated or MYC-repressed genes in EOC cell lines as assessed by RT-qPCR, using GAPDH as an internal control. For each gene, data are shown as relative quantitation (RQ) to d3 adh. For B & C, data are shown as mean ± SEM, n = 3, and log2fold-change values relative to the d3 adherent condition were compared by one-way ANOVA and Tukey’s multiple comparisons test, performing all pairwise comparisons; letter labels indicate significant differences (p < 0.05) between groups.
Unexpectedly, expression of the MYC-repressed genes AKR1C3, SKIL, and NRP1 did not increase in OVCAR4 spheroids compared to adherent cells, despite the significant decrease in MYC protein levels in spheroids. This discrepancy likely arises from the complex and multifactorial nature of gene regulation, where factors other than MYC may be involved. The AKR1C3 promoter, for example, contains potential binding sites for the transcription factors Sp1, HNF-1, GATA-1, Cart-1, MRF-2 and p53, as well as multiple antioxidant response elements [43, 44]. SKIL expression is suppressed by the nuclear SKI and SKI-novel (SNON) proteins, with repression alleviated by transforming growth factor-beta signalling [45]. Similarly, NRP1 expression is influenced by the Wnt/β-catenin pathway [46], and may be activated by heat-induced factor 1, as demonstrated using a luciferase reporter model [47]. Therefore, expression of these MYC-repressed genes in OVCAR4 spheroids may depend on additional regulatory mechanisms, making MYC depletion alone insufficient to drive their upregulation.
Given that cell detachment can arrest cell cycle progression, we investigated whether MYC downregulation in EOC spheroids is a direct consequence of detachment or an indirect result of cell cycle inhibition. To test this idea, we treated a panel of EOC cell lines in adherent culture with vehicle control (PBS) or colcemid, an M-phase cell cycle inhibitor, for 8 h. Histone H3 is phosphorylated at Ser10 during mitosis and is dephosphorylated thereafter. Cell cycle inhibition was confirmed by immunoblot analysis of this post-translational modification, which showed that phospho-histone H3 (Ser10) was significantly elevated in 3/5 cell lines tested (COV362, 105C, and OVCAR8), with a strong similar trend in OVCAR4 cells (Supplementary Fig. 6A, B). We subsequently assessed MYC protein by immunoblot analysis and found no evidence that MYC levels changed in response to treatment with colcemid (Supplementary Fig. 6C, D). Thus, MYC depletion in EOC spheroids is unlikely to result indirectly from cell cycle inhibition.
MYC depletion contributes to reduced growth and proliferation of EOC cells and spheroids
MYC is a well-established oncogene that acts as a key driver of cancer cell growth and proliferation. As such, downregulation of MYC activity would be consistent with a state of tumour cell dormancy, which is a defining phenotype of EOC spheroids. We sought to confirm whether decreased MYC protein on its own will reduce cell proliferation in COV362 cells, a cell line with detachment-induced MYC depletion, and ES-2 cells, a rare cell line that does not. MYC knockdown (Fig. 6A) significantly increased the doubling time of adherent COV362 cells and produced a similar trend for ES-2 cells (Fig. 6B). ES-2 cells represent an aggressive EOC cell line, that has the capacity for maintained cell proliferation in spheroids, and we have evidence now that this is associated with sustained MYC protein abundance. As predicted, MYC knockdown in ES-2 cells significantly decreased spheroid size (Fig. 6C, D) and was accompanied by reduced viable cells as determined by CellTiter-Glo assay (Fig. 6E). Overall, our results confirm that MYC activity drives cell proliferation in EOC cells and its controlled degradation is required to maintain a dormant phenotype in spheroids.

A Confirmation of MYC knockdown in COV362 and ES-2 cells transfected with non-targeting siRNA control (NT) or MYC-targeting siRNA (MYC) by immunoblot analysis using vinculin (vin) as a loading control. ◆ indicates band likely corresponding to cross-reactivity with CRMP2 [70]. B Doubling times were determined by fitting an exponential growth model to confluence data acquired using an IncuCyte S3 Live-Cell Analysis Instrument. C Phase-contrast micrographs of day-3 spheroids (sph; 96-well round-bottom ULA plates) described in A. D Spheroid size assessed using an IncuCyte S3 Live-Cell Analysis Instrument and E relative viability assessed by CellTiter-Glo assay. In all bar graphs, data are shown as mean ± SEM. n = 4 for all groups, except for E, where n = 3. For B, mean doubling times for each group were compared by two-tailed unpaired Student’s t test (p < 0.01, **; p < 0.05, *). For D, mean spheroid size for each group was compared by two-tailed, unpaired Student’s t test. For E, mean log2fold-change (siMYC/siNT) was compared to a theoretical value of 0 by one-sample two-tailed Student’s t test. *p < 0.05.
Discussion
Multicellular aggregates of malignant cells, or spheroids, are frequently present in ascites of patients with advanced-stage EOC. These structures facilitate metastatic transit and promote secondary tumour establishment, and many molecular features of spheroid cells define their dormant, chemo-resistant phenotype. As such, a more complete understanding of EOC disease progression requires knowledge of the molecular changes that occur during metastasis, from detachment and spheroid formation to establishment of secondary tumours. We have discovered many altered biological pathways in our spheroid model of EOC metastasis, and herein we describe how MYC oncoprotein abundance and its transcriptional activity are rapidly and reversibly downregulated in EOC spheroids to contribute to their dormant state.
While MYC has been extensively studied in the context of cancer, little is known about its regulation within the three-dimensional context of EOC spheroids. However, several stress response pathways that we have characterized in the context of EOC spheroids have been shown to impact MYC protein abundance in other studies. AMP-activated protein kinase (AMPK) is a central mediator of energy homeostasis [48] and is canonically activated by Liver Kinase B1 (LKB1) [49] in response to decreased ATP levels [50, 51]. We have demonstrated previously that EOC spheroids exhibit decreased ATP with concomitant elevated AMPK activation [52], that occurs rapidly after cell detachment in a LKB1-independent and CAMKK2-dependent manner [53, 54]. In addition, metformin, an indirect activator of AMPK, leads to increased phosphorylation of MYC at Thr58 to decrease MYC abundance in prostate cancer cells [55]. Thus, MYC depletion in EOC spheroids may occur due to AMPK activation upon cell detachment.
Oxygen gradients have been reported in the context of multicellular spheroids, with cells situated in the spheroid interior often exposed to diminished oxygen levels compared to cells at the periphery. Particularly in larger spheroids, this feature may be accompanied by the formation of a hypoxic core [56]. Low oxygen levels promote stabilization of HIF-1 [57,58,59], leading to broad changes in gene expression that enable adaptation to hypoxic conditions [60]. Independent of HIF-1-mediated transcriptional responses, hypoxia has been shown to induce phosphorylation of MYC at Thr58 and resultant proteasome-mediated MYC depletion in osteosarcoma (U2OS), cervical cancer (HeLa), and lung cancer (H460) cells [61]. Consequently, intracellular stress responses to energy depletion and hypoxia may contribute to sustained MYC suppression in EOC spheroids.
Nevertheless, while such stressors associated with multicellular spheroids can affect MYC levels, they are unlikely to be the primary immediate triggers in our model, given the rapid depletion observed in our time course studies. As such, our findings underscore a functional relationship between cell attachment and proteasomal degradation of MYC in EOC cells, and implicate detachment as the main immediate trigger for MYC degradation in EOC spheroids. While our study has not determined the precise signalling mechanisms linking cell attachment to MYC abundance in EOC, plausible factors include signalling mediators downstream from cell adhesion molecules (CAMs) and their extracellular matrix (ECM) substrates as these would be immediately perturbed upon cell detachment. For example, glycogen synthase kinase 3-beta (GSK3-beta) [62], a kinase known to phosphorylate MYC at Thr58 [63], is negatively regulated by integrin-linked kinase (ILK) [62, 64, 65], suggesting a possible mechanism whereby loss of cell-matrix attachment would promote degradation of MYC in EOC cells. In a reciprocal fashion, breast epithelial cells utilize beta-1-integrin-dependent cell adhesion to the ECM proteins fibronectin and collagens type I and IV to induce MYC protein levels [66]. Further mechanistic investigation of cell adhesion and MYC protein regulation in EOC is warranted, since it may improve our understanding of how the seeding of spheroids at metastatic sites trigger their renewed growth potential.
As mentioned above, downregulation of MYC protein and its transcriptional activity that we observed in EOC spheroids parallels other molecular mechanisms aligned with tumour dormancy. EOC spheroid cells exhibit a reversible dormancy phenotype characterized by reduced proliferation, increased resistance to anoikis and chemotherapeutic agents, and several molecular changes that control cellular quiescence. These include decreased p-AKT (S473) and p54/SKP2 along with increased p130/RBL2 and p27Kip1, all of which are reversed upon reattachment [22]. Given MYC’s central role in promoting cell proliferation, its suppression would be a plausible strategy for EOC spheroids to adopt during acquisition of dormancy. MYC depletion has been shown to inhibit proliferation in numerous human tumour cell lines [67], and our data show that MYC knockdown increases doubling time in COV362 and ES-2 cells. Important to our working model of reversible dormancy, MYC depletion occurs rapidly upon cell detachment but its expression and transcriptional activity are restored by reattachment, strengthening the idea that these properties are connected. As such, suppression of MYC activity may have numerous consequences controlling dormancy in EOC spheroids.
Notably, while our results indicate decreased MYC activity in spheroids for the majority of EOC cell lines, a small subset of lines exhibit little or no change. We noted a similar trend in our analysis of published HGSOC scRNA-Seq data, where MYC-associated transcriptional signature scores were substantially decreased in ascites-derived as compared with matched primary tumour-derived EOC cells in one patient, but this effect was less so for the other. Given the central role of MYC in promoting cell proliferation and metabolism, a lack of MYC downregulation in some EOC patient ascites cells could serve as a biomarker indicating their reduced spheroid dormancy status and thus have retained sensitivity to cytotoxic chemotherapies.
Our findings suggest a scenario where MYC activity promotes EOC cell proliferation within primary tumours, but this is transiently suppressed upon detachment during metastatic transit, and is restored upon reattachment and establishment of metastases. We propose that reversible, detachment-induced downregulation of MYC is a key feature of EOC spheroid dormancy contributing to their quiescent-like phenotype. If MYC downregulation is an essential response to loss of EOC cell anchorage, elucidating the molecular mechanisms that link cell detachment to MYC downregulation may reveal novel ways of impacting both metastatic potential and chemotherapy resistance.
Materials and methods
Cell culture
All cell line cultures were grown in DMEM/F12 medium (cat. 11330057; Gibco) except for OVCAR3, OVCAR5, OVCAR8, and HeyA8, which were grown in RPMI 1640 medium (cat. 350-005-CL; Wisent). All cell lines were cultured in medium containing 10% fetal bovine serum (Wisent; cat. 098150), and maintained in a humidified incubator at 37 C, 5% CO2. All cell lines were validated by short tandem repeat profiling and tested by PCR to confirm lack of mycoplasma contamination. Cell line sources are shown in Supplementary Table S1.
Reagents and antibodies
Antibodies against MYC (cat. 5605; 1:1000 dilution), p-MYC-Thr58 (cat. 46650; 1:1000), p-MYC-Ser62 (cat. 13748; 1:1000), MAX (cat. 4739; 1:1000), and p-Histone H3 (Ser10) (cat. 9701, 1:1000) were purchased from Cell Signaling Technology (Danvers, MA). Antibody against actin (cat. A2066; 1:500) was purchased from Millipore (Temecula, CA). Antibody against tubulin (cat. T5168; 1:20000) was purchased from Sigma. Antibody against vinculin (cat. V9264; 1:20000) was purchased from Sigma. HRP-conjugated antibodies against mouse IgG (cat. NA931; 1:10000) and rabbit IgG (cat. NA934, 1:10000) were purchased from Cytiva. All antibodies were diluted in 5% bovine serum albumin (BSA) or 5% non-fat milk in tris-buffered saline containing 0.1% Tween-20 (TBST). MG132 (cat. C2211) was purchased from Sigma. KaryoMAX Colcemid Solution in PBS (cat. 15212012) was purchased from Thermo Fisher.
Extraction and purification of RNA
RNA was extracted using the RNEasy Spin Column kit (cat. 74104; Qiagen) according to the manufacturer’s protocol, with the optional DNaseI (cat. 79254; Qiagen) treatment. Adherent cells were collected by aspirating medium and scraping cells into 600 µL Buffer RLT and stored at −80 °C until processing. Spheroids were pelleted at 800 g at 4 °C, medium was aspirated, and cells were lysed in 350 µL Buffer RLT and stored at −80 °C until processing. RNA concentration, A260/280, and A280/230 were determined using a NanoDrop One Microvolume UV-Vis Spectrophotometer (Thermo Scientific).
Transcriptional signature scoring of HGSOC scRNA-seq data
Published scRNA-seq data (HGSOC_All.rds, version 2) was retrieved from https://data.mendeley.com/datasets/rc47y6m9mp/2 [32]. Data was loaded using the Seurat R package (version 4.3.0.1), and subsetted to cells annotated as both “Epithelial cells” and “Cancer cells”. The data were further subsetted to exclude cells annotated as “Lymph Node” or “PBMC”. MYC_TARGETS_V1 and MYC_TARGETS_V2 signature scores were calculated using the UCell R package [68] (version 2.4.0); signatures contained the same genes as the “HALLMARK_MYC_TARGETS_V1.v2023.1.Hs” and “HALLMARK_MYC_TARGETS_V2.v2023.1.Hs” files, respectively, maintained by MSigDB [30, 31]. Analysis was restricted to patients HGSOC5 and HGSOC8 due to insufficient numbers of ascites-derived epithelial cancer cells in other patient samples.
Reverse transcription and quantitative PCR
cDNA synthesis was performed using the High Capacity cDNA Reverse Transcription Kit (cat. 4368814; Thermo Fisher) according to the manufacturer’s protocol using 1 or 2 µg RNA per reaction, yielding a final volume of 20 µL per reaction. Reactions were incubated in a MyCycler thermocycler (Bio-Rad) using the following settings: 25 °C for 10 min, 37 °C for 120 min, 85 °C for 5 min, hold at 4 °C until sample retrieval. Each reaction was then diluted with an equal volume of nuclease-free water. qPCR was performed using the Brilliant III SYBR Green QPCR Master Mix (cat. 600882; Agilent Technologies) according to the manufacturer’s protocol scaled to a 10 µL reaction volume. Reactions were assembled in a 96-well plate, sealed with adhesive plastic film, and then centrifuged for 20 s to remove bubbles. Cycling was performed in a QuantStudio 3 RT-PCR System (Thermo Fisher) using built-in settings for SYBR Green Chemistry, Fast mode. Data analysis was performed using QuantStudio Design and Analysis Software 1.4.3. Fold-change values relative to controls were calculated using using the 2−ΔΔCT method [69]. Primer sequences (Supplementary Table S2) were obtained from https://www.origene.com and purchased from Invitrogen.
Time course protein isolation
Cells were seeded into 10 cm tissue culture-treated dishes at a density of 1.25 × 10⁶ cells in a volume of 10 mL (adh) or 35 mm ULA wells at a density of 7.5 × 10⁵ cells in a volume of 6 mL (sph) complete medium. Lysates for immunoblot analysis were then collected at 2, 4, 6, and 8 h post-seeding as described in Preparation of whole-cell lysates.
MG132 treatment
Early treatment
Cells were seeded into 10 cm tissue culture-treated dishes at a density of 2.5 × 10⁶ cells in a volume of 8 mL (adh) or 35 mm ULA wells at a density of 7.5 × 10⁵ cells in a volume of 4 mL (sph) complete medium. After 2 h, 2 mL (adh) or 1 mL (sph) 50 µM MG132 in complete medium was added, for a final concentration of 10 µM. Cultures were harvested 6 h later.
Late treatment
Cells were seeded into 10 cm tissue culture-treated dishes at a density of 8.25 × 10⁵ (COV362) or 5.75 × 10⁵ (OVCAR4) cells in a volume of 11.2 mL (adh) or into 35 mm ULA wells at a density of 7.5 × 10⁵ cells in a volume of 4.8 mL (sph) complete medium. After 66 h, 2.8 mL (adh) or 1.2 mL (sph) 50 µM MG132 in complete medium was added, for a final concentration of 10 µM. Cultures were harvested 6 h later.
Colcemid treatment
Cells were seeded into 10 cm tissue culture-treated dishes at a density of 2.0 × 10⁶ cells in a volume of 12 mL complete medium. The following day, the medium was removed and replaced with 9 mL complete medium containing 60 nM colcemid (105 C and OVCAR8 cell lines), 65 nM colcemid (iOvCa147 cell line), 75 nM colcemid (COV362 and OVCAR4 cell lines), or vehicle control (PBS). Lysates for immunoblot analysis were collected 8 h later as described in Preparation of whole-cell lysates.
Spheroid reattachment
ULA cultures (5 mL in 35 mm) were transferred to 10 cm dishes containing complete medium to a total volume of 13 mL, and then agitated to distribute spheroids uniformly. Reattached spheroid cultures were then harvested 24, 48, and 72 h later.
siRNA-mediated knockdown
Cells were seeded into 35 mm wells (2.5 × 10⁵ COV362 cells/well, 1 × 10⁵ ES-2 cells/well; 2 mL). Transfection was performed the following day using DharmaFECT1 reagent (cat. T-2001-03; 1/500 final dilution) as per manufacturer’s protocol (Dharmacon) using a final siRNA concentration of 10 nM. MYC ON-TARGETplus SMARTpool (cat. L-003282-02-0005) or ON-TARGETplus Non-targeting Pool (cat. D-001810-10) were used. The day after transfection, 3 mL of complete medium were added to each well, for a total volume of 5 mL. 48 h later, cells were lifted using trypsin/EDTA, counted and seeded for experiments.
Protein isolation
Whole-cell lysates
Adherent cells grown in tissue culture-treated plates or dishes were collected by aspirating medium, washing 2x with cold PBS, and scraping into modified RIPA buffer. Spheroids (at least 1.5 × 10⁶ cells per sample) were collected by transferring the cell suspension into a conical tube on ice, pelleting by centrifugation in a swinging bucket rotor (800 × g at 4 °C for 4 min), aspirating medium, resuspending in at least 10 mL cold PBS, pelleting, resuspending again in cold PBS, pelleting, and aspiration of PBS. Cell pellets were then lysed in modified RIPA buffer, vortexed, subjected to one freeze-thaw cycle, and clarified by centrifugation (max × g at 4 °C for 20 min). Modified RIPA buffer contained 50 mM HEPES (pH 7.4), 150 mM NaCl, 10% glycerol, 1.5 mM MgCl2, 1 mM EGTA, 1% Triton X-100, 0.1% SDS, 1 mM Na3VO4, 10 mM NaF, 1 mM PMSF, 1x SIGMAFAST protease inhibitor cocktail (cat. S8820; Sigma), 10 mM beta-glycerophosphate. Total protein concentration was determined using the Bio-Rad Protein Assay according to manufacturer’s instructions (cat. 5000006; Bio-Rad).
Immunoblotting
Lysates (10–25 µg/lane) were resolved using the Bio-Rad Mini-PROTEAN II Electrophoresis System (Bio-Rad) according to manufacturer’s instructions using gels cast in-house (30% acrylamide/bis solution 37.5:1, cat. #1610158; Bio-Rad). Resolved lysates were then transferred to a polyvinylidene difluoride membrane using the Mini Trans-Blot system (105 V, 65 min; Bio-Rad). Membranes were blocked by incubating for 1 h at room temperature with gentle rocking in TBST containing 5% bovine serum albumin, and then incubated in primary antibody overnight at 4 °C with gentle rocking using the same blocking buffer. Membranes were then washed 3 times in TBST (20 min per wash, room temperature), incubated in HRP-conjugated secondary antibody diluted in blocking buffer (1 h, room temperature), and washed another 3 times in TBST (20 min per wash, room temperature). Membranes were then incubated in a minimal volume of Luminata HRP Chemiluminescence Substrate (5 min, room temperature; Fisher Scientific) and imaged using a ChemiDoc imaging system (Bio-Rad). Densitometry was performed using the Image Lab 6.0.1 software package (Bio-Rad). For immunoblots probed for MYC (antibody cat. 5605), membrane regions containing protein size markers were cut away prior to incubation in primary antibody due to strong reactivity. Membranes were then reassembled prior to ChemiDoc imaging.
CellTiter-Glo assay
CellTiter-Glo Luminescent Cell Viability Assay reagent (100 µL; cat. G7572, Promega) was added to 100 µL spheroid cultures in 96-well round-bottom ULA plates, frozen on dry ice and stored at −80 °C wrapped in aluminum foil. On the day of the assay, the frozen plates were thawed at room temperature with gentle rocking. Samples in the plate were mixed by pipetting up and down several times, and 180 µL from each well were transferred to an opaque white plate. Sample luminescence was then measured using a Biotek Synergy H4 plate reader (auto sensitivity setting, 1 s integration time).
Microscopy
Phase-contrast images were captured using a DMI 4000B inverted microscope (Leica).
Statistical analysis
Statistical analyses were performed using GraphPad Prism 10 (GraphPad Software) and the UCell [68] R package. Experiments were independently repeated at least three times, except for Fig. 2A, D, where experiments were performed one to five times for each of 29 cell lines, and Fig. 2E, where experiments were repeated two times for each of 5 cell lines, with each cell line considered a single biological replicate. In general, the number of independent replicates and sample sizes were chosen based on observations from earlier studies. Appropriate statistical tests were selected based on experimental design and sample size. The mean was used as the center value in all tests, although in Fig. 1D, violin plots display the median. All t-tests were two-tailed. The Shapiro-Wilk test and/or normal quantile–quantile (Q-Q) plots were used to assess data or residual normality, as appropriate. Variance similarity was evaluated using the F-test and/or graphical examination of residuals, as appropriate. Where applicable, all groups include estimates of variation, displayed in figures as error bars representing the standard error of the mean. A p-value < 0.05 was considered statistically significant. Additional details of statistical analyses performed are described in each figure legend.
Responses