Rising importance of agricultural nitrogen oxide emissions in China’s future PM2.5 pollution mitigation

Introduction
Fine particulate matter (PM2.5), which describes inhalable particles with an aerodynamic diameter equal to or less than 2.5 μm, is a major pollutant that has been proven to increase susceptibility to respiratory diseases1. In China, severe PM2.5 pollution contributed to 1.1 million excess deaths in 20152. The anthropogenic emission control strategies implemented by the Chinese government, such as the ‘Three-year Action Plan Fighting for a Bule Sky’ issued in 20183, have significantly reduced PM2.5 pollution4,5. However, most of the Chinese population is still exposed to PM2.5 levels much higher than that recommended by the World Health Organization’s Air Quality Guidelines (AQG, annual mean PM2.5 of 5 μg m−3)6.
As an important PM2.5 precursor, the nitrogen oxides (NOx = NO + NO2) emissions from combustion sources have been effectively reduced with the implementation of clear air actions in China7,8. Besides combustion sources, agricultural soil is also recognized as an important NOx source and can have a significant influence on ozone air quality9,10,11, even in regions that already have a high level of NOx emissions from fuel combustion, such as North China Plain (NCP)12,13,14. Although the NOx emissions from agricultural soils are mainly induced by agricultural fertilizer application14,15, they are usually treated as natural emissions. Recent studies suggest that reducing agricultural NH3 emissions through agricultural nitrogen management is needed to further control PM2.5 pollution in China15,16,17,18,19. Agricultural nitrogen management can also reduce NOx emissions20. However, the influence of controlling agricultural NOx emissions on mitigating PM2.5 pollution is rarely recognized in air quality strategies.
The agricultural emissions of NH3 and NOx contribute to the formation of secondary inorganic aerosols (sulfate, nitrate, and ammonium aerosols, SIAs) through nonlinear chemistry. SO2 and NOx emitted to the atmosphere can be oxidized to sulfuric acid (H2SO4) and nitric acid (HNO3), respectively. NH3 first forms ammonium sulfate aerosol by reacting with H2SO4, and then the excess NH3 will form ammonium nitrate aerosol by reacting with HNO3. When NH3 is excessive, which is commonly found in agricultural-intensive areas, controlling NH3 emissions will first reduce the NH3 concentrations rather than SIAs21. As the SIA formations are more sensitive to HNO3 than NH3 over the NH3-excessive regions, we propose here the effectiveness of controlling agricultural emissions on PM2.5 reduction might be underestimated if agricultural NOx emissions are not considered.
In this study, we investigate the role of agricultural NOx emissions in mitigating PM2.5 pollution during the crop-growing season over eastern China at present and under future scenarios by conducting a set of atmospheric model simulations. We show that over the North China Plain, including agricultural NOx emissions will shift the optimal reactive nitrogen (Nr) control pathway toward controlling more agricultural emissions and will achieve more effective PM2.5 mitigation. Given that most agricultural nitrogen management practices aimed at controlling NH₃ emissions also regulate agricultural NOₓ emissions, changes in agricultural NOx emissions associated with these agricultural management strategies should also be considered when developing emission control strategies for intensive agricultural areas like North China Plain.
Results
Anthropogenic NOx emissions from agricultural and combustion sectors
Figure 1a and Supplementary Fig. 1 show the spatial distribution and seasonal variation of agricultural NOx emissions (ENOx_agri) over China in 2019, as estimated by the Berkeley–Dalhousie Soil NOx Parameterization (BDSNP)22 with fertilizer application provided by Chen et al.23 (Supplementary Fig. 2; Methods). The annual total Chinese ENOx_agri estimated by BDSNP is 0.3 Tg N yr−1, consistent with the ENOx_agri given by the sixth Coupled Model Intercomparison Project (CMIP6) scenarios (also 0.3 Tg N yr−1, Methods). The highest agricultural NOx emissions are found over the North China Plain (NCP), reaching 9 kg N ha−1 yr−1, and contributing 35% of the total Chinese agricultural NOx emission in 2019. In other regions of China, agricultural NOx emissions are typically less than 1 kg N ha−1 yr−1. Significant seasonal variations exist, with the ENOx_agri mainly occurring over May-August, which accounts for 65% of the annual total ENOx_agri (Supplementary Fig. 1). Higher ENOx_agri during May-August can be attributed to high temperature and intensive fertilizer application during these months10,24.

a The spatial distribution of agricultural NOx emissions in China was estimated by BDSNP in 2019. The total agricultural NOx emission over China is shown inset. b, c The bar plots show the anthropogenic NOx emissions from each emission sector in 2019 and 2030–2060 under SSP2-45 (b) and SSP1-26 (c) scenarios (left axis). The lines show the percentage contribution of agricultural NOx emissions to annual (gray) and May-August (black) total anthropogenic NOx emissions (right axis).
We evaluate the contribution of ENOx_agri to total anthropogenic NOx emissions in China in 2019, and the future by comparing with NOx emissions from combustion sectors (ENOx_comb, including industrial, power plant, transportation, and residential burning) in Fig. 1. The ENOx_comb in 2019 is derived from the Multi-resolution Emission Inventory for China (MEIC)7,25,26, and in the future (Fig. 1) derived by applying the anthropogenic emission changes (including the agricultural sector) given in the CMIP6 scenarios (Methods). In 2019, the ENOx_agri (0.3 Tg N yr−1) contributes to 5% of annual total anthropogenic NOx emissions (6.6 Tg N yr−1). In the future, the emission mitigation scenarios in CMIP6 (SSP1-26 and SSP2-45) predict substantial decreases in ENOx_comb but only slight changes in ENOx_agri. The SSP1-26 scenario (strict mitigation pathway scenario), which predicts a sharp reduction of NOx emissions from industry and transportation, shows ENOx_agri accounting for 11% of the annual total anthropogenic NOx emissions in 2040 and 27% in 2060. The SSP2-45 scenario (middle road scenario), predicts lower decreases in industry and transportation NOx emissions compared to the SSP1-26 scenario, resulting in ENOx_agri contributions of 7% in 2040 and 10% in 2060.
The contribution of agricultural NOx emissions is more significant during the crop-growing season (May-August) (Fig.1 and Supplementary Fig. 3). In 2019, the contribution from ENOx_agri (53 Gg N month−1) reached 10% of total anthropogenic NOx emissions during May-August, which is significantly higher than the residential sector. The ENOx_agri would contribute 43% and 19% of the total anthropogenic NOx emissions under SSP1-26 and SSP2-45 scenarios in 2060, respectively. Remarkably, under the SSP1-26 scenario, ENOx_agri (50 Gg N month−1) during May-August in 2060 would be even higher than the transportation (19 Gg N month−1) and industry (31 Gg N month−1) sectors, making ENOx_agri a primary contributor to anthropogenic NOx emissions in China (Supplementary Fig. 3).
The contribution of agricultural NOx emissions to PM2.5 pollution
We use the atmospheric chemistry transport model GEOS-Chem to simulate the PM2.5 components in 2019 and the future under SSP2-45 and SSP1-26 scenarios during crop-growing season over East Asia (Methods). The base simulation can generally capture the spatial distribution of the PM2.5 concentrations in 2019 observed by the surface network (Supplementary Fig. 4). Our analysis mainly focuses on the SIAs, which are directly impacted by NOx emissions. The contributions of ENOx_agri and ENOx_comb to SIAs are calculated as the difference between model simulations with all emissions turned on (base simulations in Supplementary Table 1) and simulations with corresponding emissions turned off (sensitivity simulations Group I and II in Supplementary Table 1).
Figure 2 shows the spatial distribution of simulated surface SIA concentrations during the crop-growing season (May-August) of 2019 and under future emission scenarios. In 2019, the model simulated SIA concentrations are more than 20 μg m−3 over the majority of eastern China except for northeast China and southern coastal regions (5–15 μg m−3). With the reduction of NOx (Fig. 1) and SO2 emissions (Supplementary Fig. 5) from combustion sectors, the model simulated significant decreases in SIA concentrations in the future. However, despite these reductions, the formation of SIAs still hinders eastern China from meeting the AQG level (annual mean PM2.5 of 5 μg m−3)6. Under the SSP2-45 scenario, the SIA concentrations are more than 20 μg m−3 in 2040 and 10 μg m−3 in 2060 over the NCP, implying that SIAs alone (excluding primary aerosols and secondary organic aerosols) could result in PM2.5 levels exceeding the AQG level. Under the SSP1-26 scenario, the SIA concentrations in 2060 would decrease to 2–5 μg m−3 over most regions of eastern China. Given that SIAs account for 30-50% of PM2.5 in eastern China27,28,29, further reducing SIAs is essential to ensure PM2.5 concentrations below the AQG level.
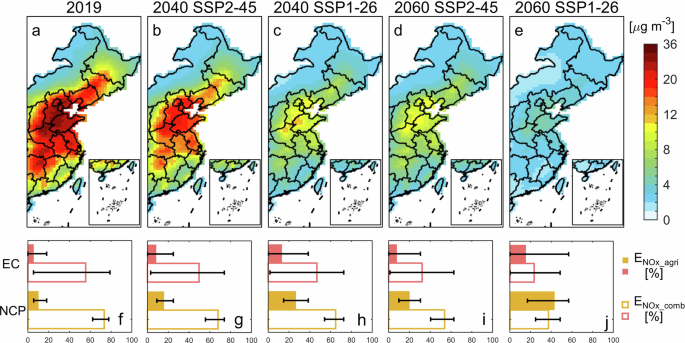
a–e Spatial distribution of SIA concentrations over eastern China simulated by GEOS-Chem averaged over the crop-growing season (May-August) in 2019 (a) and under SSP2-45 and SSP1-26 emission scenarios for 2040 and 2060 (b–e). f–j The corresponding contribution of agricultural NOx emissions (ENOx_agri) and combustion NOx emissions (ENOx_comb) to SIA concentrations over East China (EC, red) and North China Plain (NCP, yellow). The bar plots show the median values, and the error bars show the ranges.
We compare the contribution of ENOx_agri and ENOx_comb to SIA concentrations over NCP and the whole of eastern China (EC). The spatial distributions of the contribution of ENOx_agri and ENOx_comb to SIA concentrations are shown in Supplementary Fig. 6, and the median values and ranges over NCP and EC are summarized in Fig. 2. The contribution of ENOx_agri to SIA concentrations in 2019 during the crop-growing season is usually below 10% across most regions in eastern China. Over the NCP, where the highest ENOx_agri levels occur, the contribution to surface SIA concentrations reaches about 10-20%. In comparison, the contribution of ENOx_comb can reach more than 50% over most regions in eastern China, much larger than the contribution from ENOx_agri. However, model simulations for future emission conditions indicate a significant increase in the contribution of ENOx_agri to SIAs, particularly over the NCP. In 2060, the ENOx_agri contributions will further increase to 15% over most of eastern China. Over the NCP, the contribution of ENOx_agri will exceed 20% under the SSP2-45 scenario and 40% under the SSP1-26 scenario. Under the SSP1-26 scenario, ENOx_agri contributions will be even larger than those from total ENOx_comb. Additionally, we compare the contributions of ENOx_agri with NOx emissions from the industrial sector (ENOx_ind), which is the largest combustion source in China (Fig. 1). As shown in Supplementary Fig. 7, under the SSP1-26 scenario, the contribution of ENOx_agri will become roughly equal to that of ENOx_ind from 2040 onwards across eastern China. Over the NCP, the contribution of ENOx_agri will be twice that of ENOx_ind in 2060. Under the SSP2-45 scenario, where industrial emissions are less reduced, the contribution of ENOx_agri will exceed half of ENOx_ind in 2060 over the NCP. Thus, as more stringent measures are expected to be implemented to reduce the emissions from fuel combustion in the future, there will be a growing significance of ENOx_agri in the formation of SIAs. ENOx_agri will serve as a pivotal factor in SIA formations during crop-growing season over eastern China.
The role of controlling agricultural NOx emissions on PM2.5 pollution mitigation
Despite the future reduction of emissions from fossil fuel combustion, eastern China still experiences a substantial level of SIA formations. Since the agricultural emissions show slight changes under the future emission scenarios (Fig. 1 and Supplementary Fig. 8), controlling agricultural emissions could be crucial for further mitigating PM2.5 pollution and achieving more stringent air quality targets such as the AQG level6. We further evaluate the efficacy of controlling ENOx_agri on PM2.5 pollution by comparing the reduction of SIA concentrations resulting from agricultural NH3 and NOx emission controls.
Agricultural nitrogen management practices, such as using enhanced-efficiency fertilizers, reducing fertilizer application rate, machine application, and improving manure management, have the potential to reduce NH3 emissions by ~40%20,30,31. A recent study32 also reported that NH3 emissions could be mitigated by 49% for wheat and 39% for maize under a county-wide NH3 reduction campaign in the NCP. In addition to NH3, agricultural NOx emissions can also be reduced by about 40% through improved nitrogen management practices20. We posit that this potential for a 40% reduction in agricultural NH3 and NOx will persist in the future, given the relatively small changes in agricultural emissions predicted by future scenarios (Fig. 1 and Supplementary Fig. 8). Here, we focus our analyses on May as a representative month of the crop-growing season and the results for June-August are shown in the Supplementary Materials.
Figure 3 shows the decline in SIA concentrations resulting from a 40% reduction of agricultural emissions over NCP. The results for the entire eastern China are shown in Supplementary Fig. 9. In May 2019, reducing 40% of agricultural NH3 emissions would lead to an up to 4.6 μg m−3 decrease in SIA concentrations over eastern China (Supplementary Fig. 9). Over the NCP, where the agricultural emissions are most intensive, the SIA concentrations only decrease by 0.5–3.3 μg m−3 (Fig. 3). We estimate the G ratio33 (Supplementary Text 1) to describe the chemical regime of SIA formations, of which the value large than 1 indicates excessive NH3 for SIA formations (Supplementary Fig. 10). The limited response of SIA concentrations to NH3 emission reductions over NCP can be attributed to highly saturated NH3 simulated by GEOS-Chem sensitivity simulations, where the G values are larger than 1 even with a 40% reduction of ENH3_agri. In the future, the CMIP6 scenarios predict minor changes in agricultural NH3 emissions (Supplementary Fig. 8). NH3 will be more excessive in eastern China with reductions of NOx and SO2 from fuel combustion under future scenarios (Supplementary Fig. 10), leading to a significant decline in the SIA concentration decreases associated with a 40% reduction in ENH3_agri (Fig. 3). Both the SSP2-45 and SSP1-26 scenarios predict that the corresponding mean SIA decreases in 2060 would be less than 1.0 μg m−3 over NCP (Fig. 3).

a The decrease in SIA concentrations in response to a 40% reduction in agricultural NH3 emissions (gray) and a 40% reduction in both agricultural NH3 and NOx emissions (blue) over the North China Plain in May 2019 and under SSP2-45 and SSP1-26 emission scenarios. The solid dots are the median values, and the error bars are the ranges over the North China Plain. The pie plots show the corresponding contribution of population-weighted SIA concentration reductions led by a 40% reduction of agricultural NOx (yellow) and NH3 emissions (gray). b The efficiency of controlling agricultural NH3 emissions (({beta }_{{{mathrm{NH}}}3}), gray) and agricultural NOx emissions (({beta }_{{NOx}}), yellow) in reducing SIA concentrations in May 2019 and under SSP2-45 (left) and SSP1-26 (right) emission scenarios for 2040 and 2060. The error bars show the ranges estimated by assuming a factor of 2 (50–200%) uncertainties in agricultural NOx emissions. c The same as (b) but for absolute efficiencies (({beta }_{{{mathrm{NH}}}3}^{{prime} }) and ({beta }_{{{mathrm{NOx}}}}^{{prime} })).
When both ENH3_agri and ENOx_agri are concurrently reduced by 40%, the response of SIA concentrations to agricultural emission reductions will be more significant than reducing ENH3_agri alone, especially over the NCP (Fig. 3 and Supplementary Fig. 9). This reflects a substantial contribution from ENOx_agri reduction on mitigating SIA formations. In May 2019, ENOx_agri reduction contributed 15% of the overall decrease in SIAs resulting from the total reduction in agricultural Nr (both NH3 and NOx) emissions averaged over the NCP (Fig. 3). Under future scenarios, there will be a noticeable increase in the contribution of ENOx_agri (Fig. 3 and Supplementary Fig. 9). By 2060, the contribution of ENOx_agri reduction to the decrease in SIA concentrations led by total agricultural emission reduction is 34% under the SSP2-45 scenario and 46% under the SSP1-26 scenario averaged over the NCP, implying that reducing ENOx_agri by 40% can lead to similar SIA mitigation as ENH3_agri. Over most of the other regions in eastern China, the contribution of ENOx_agri also increases from around 5–15% in 2019 to 20–30% and 30–40% in 2060, respectively, under SSP2-45 and SSP1-26 scenarios (Supplementary Fig. 9).
The rising importance of ENOx_agri can be further quantified using the efficiency of controlling ENH3_agri (({beta }_{{{mathrm{NH}}}3})) and ENOx_agri (({beta }_{{{mathrm{NOx}}}})) to mitigate SIA formations over NCP21,34. Efficiencies ({beta }_{{{mathrm{NH}}}3}) and ({beta }_{{{mathrm{NOx}}}}) are calculated as the ratio of relative changes in population-weighted regional mean SIA concentrations ((delta {C}_{{{mathrm{SIA}}}})) over the North China Plain to the relative changes in ENH3_agri (left({beta }_{{{mathrm{NH}}}3}=left(frac{delta {C}_{{{mathrm{SIA}}}}}{{C}_{{{mathrm{SIA}}}}}right)/left(frac{delta {E}_{{{mathrm{NH}}}3{_agri}}}{{E}_{{{mathrm{NH}}}3{_agri}}}right)right)) and ENOx_agri (left({beta }_{{{mathrm{NOx}}}}=left(frac{delta {C}_{{{mathrm{SIA}}}}}{{C}_{{{mathrm{SIA}}}}}right)/left(frac{delta {E}_{{{mathrm{NOx}}_agri}}}{{E}_{{{mathrm{NOx}}_agri}}}right)right)), respectively. As shown in Fig. 3, in May 2019, ({beta }_{{{mathrm{NH}}}3}) is 0.35%/%, which is about five times of ({beta }_{{{mathrm{NOx}}}}) (0.07%/%). Projecting to future emission scenarios, ({beta }_{{{mathrm{NH}}}3}) shows only slight variations, remaining around 0.35%/%. Different from ({beta }_{{{mathrm{NH}}}3}), ({beta }_{{{mathrm{NOx}}}}) increases with the reduction of NOx and SO2 emissions from combustion sources. In 2060, the ({beta }_{{{mathrm{NOx}}}}) 0.18%/% (0.10–0.29%/% considering a factor of two uncertainty in agricultural NOx emissions) under SSP2-45 and 0.36%/% (0.21–0.55%/%) under SSP1-26, become comparable to ({beta }_{{{mathrm{NH}}}3}).
We also calculate the absolute efficiency ({beta }_{{NH}3}^{{prime} }) and ({beta }_{{NOx}}^{{prime} }) (({beta }_{{{mathrm{NH}}}3}^{{prime} }=delta {C}_{{{mathrm{SIA}}}}/delta {E}_{{{mathrm{NH}}}3{_agri}}), ({beta }_{{{mathrm{NOx}}}}^{{prime} }=delta {C}_{{{mathrm{SIA}}}}/delta {E}_{{{mathrm{NOx}}_agri}})) over NCP in Fig. 3, which describe the SIA changes in response to unit mass changes in agricultural NH3 and NOx emissions. ({beta }_{{{mathrm{NH}}}3}^{{prime} }) is much smaller than ({beta }_{{{mathrm{NOx}}}}^{{prime} }), reflecting the lower sensitivity of SIAs to NH3 emissions due to the high saturation of NH3 over the North China Plain. However, the relative efficiency ({beta }_{{{mathrm{NH}}}3}) is higher than ({beta }_{{NOx}}), as agricultural NH3 emissions are much larger in magnitude compared to NOx. The decrease of ({beta }_{{{mathrm{NH}}}3}^{{prime} }) reflect that as combustion emissions are reduced, NH3 becomes more excessive for SIA formation. In 2060, ({beta }_{{{mathrm{NOx}}}}^{{prime} }) is 0.089 μg m−3/Gg N (0.085–0.090 μg m−3/Gg N) and 0.062 μg m−3/Gg N (0.059–0.065 μg m−3/Gg N) for the month of May under SSP2-45 and SSP1-26 scenarios, respectively. In comparison, ({beta }_{{{mathrm{NH}}}3}^{{prime} }) is only 0.008 μg m−3/Gg N under SSP2-45 and 0.004 μg m−3/Gg N under SSP1-26. The model simulations for other months of the crop-growing season under the SSP1-26 scenario in 2060 also show comparable ({beta }_{{{mathrm{NH}}}3}) and ({beta }_{{{mathrm{NOx}}}}) and much higher ({beta }_{{{mathrm{NOx}}}}^{{prime} }) than ({beta }_{{{mathrm{NH}}}3}^{{prime} }) (Supplementary Fig. 11). The results indicate that during the crop-growing season, as NH3 is saturated for future SIA formations over most of eastern China, the SIA concentrations are projected to be much more sensitive to per unit reduction of ENOx_agri than ENH3_agri.
Implications for future emission control strategies
Choosing an optimal pathway for controlling combustion and agricultural Nr emissions can help achieve the most efficient PM2.5 mitigation34. As aforementioned, the ENOx_agri are usually treated as natural sources and are not considered in emission control strategies. However, our model sensitivity simulations show that in the future, controlling ENOx_agri can lead to similar SIA reductions to that controlling ENH3_agri. The results imply that ENOx_agri should not be neglected when designing Nr control strategies. Here we further examine the influence of ENOx_agri on the design of efficient emission control pathways for combustion and agricultural reactive nitrogen emissions.
To estimate the optimal Nr emission control pathways, we conducted sensitivity simulations Group V-VII, which gradually reduced Nr emissions from agricultural and combustion sources by 20, 40, 60, and 80% (Supplementary Text 2 and Supplementary Table 1). We focus the analysis on NCP during the crop-growing season. To evaluate the influence from ENOx_agri, we estimate the population-weighted regional mean SIA reductions by only reducing ENH3_agri as well as reducing both ENH3_agri and ENOx_agri in the agricultural Nr experiments. In the combustion Nr experiments, we consider the combined reductions in NOx and NH3 emissions from combustion sources. These experiments are designed to represent the most simplified case, in which the NH3 and NOx are reduced synchronously for each source. The optimal pathway is estimated for 2019 and for the case that the anthropogenic emissions are changed to 2040 levels predicted by the SSP1-26 scenario. The influence from ENOx_agri is evaluated by estimating the optimal pathways with/without including ENOx_agri in agricultural Nr emission control.
We first compare the decline in SIAs due to reducing Nr from combustion sources and agricultural emissions with/without considering ENOx_agri. As shown by Fig. 4a, when ignoring ENOx_agri, the decline in population-weighted regional mean SIA concentrations over NCP due to reducing agricultural Nr emissions is smaller than reducing combustion Nr emissions. We define R as the ratio of SIAs decline due to controlling agricultural and combustion Nr emissions, which represents the relative importance of controlling agricultural Nr emissions in SIA mitigations. We estimate that without considering ENOx_agri, R gradually increased from around 0.5 to 0.8, with the emission reduction increasing from 20 to 80% for both the 2019 and 2040 cases. Such an increase in R reflects that with a deeper reduction in ENH3_agri, the SIA changes from NH3 saturated to NH3 limited situation (Supplementary Fig. 12), and the SIA formations will be more sensitive to NH3 emissions21. However, controlling reactive nitrogen emissions from combustion sources is more effective than agricultural emissions (R < 1), even with 80% emission reductions. Including ENOx_agri in agricultural Nr emissions reduction can obviously raise the relative importance of controlling agricultural emissions. Particularly, when anthropogenic emissions are reduced to the 2040 level, R for 20% and 80% Nr emission reduction becomes 0.8 and 1.0, making the agricultural Nr emission control able to achieve similar SIA mitigations as combustion Nr for a wide range (20–80%) of Nr emission control process.

a, d The bar plots show the decline in population-weighted SIA concentrations ((Delta {PWC})) due to 20–80% reductions in emissions from agricultural NH3 (gray), agricultural Nr (NOx and NH3) (yellow), and combustion Nr emissions (red) (left axis). The blue (green) lines show the ratio of SIAs decrease due to reductions of agricultural Nr (NH3) and combustion Nr emissions (right axis). b, c, e, f Diagrams illustrating the effectiveness of controlling Nr emissions from agricultural and combustion sources in mitigating population SIA concentrations. The background color indicates the population-weighted SIA concentrations over NCP, and the red lines show the optimal emission reduction pathways. Panels (b, e) are based on estimates that include only agricultural NH3 emission reductions, while panels (c, f) include both NH3 and NOx emissions in agricultural emission reductions. The arrows indicate the relative magnitude of SIA reductions contributed by reductions in agricultural and combustion reactive nitrogen emissions. The top panels (a–c) use 2019 emissions, and the bottom panels (d–f) use emissions reduced to the 2040 level predicted by the SSP1-26 scenario.
We examine the influence of ENOx_agri on designing the optimal Nr emission control pathway following Liu et al.34 (Supplementary Text 2) in Fig. 4. The optimal pathway is estimated following the direction of the gradients of the SIA concentrations mitigation. If ENOx_agri is not considered, under both 2019 and the 2040 anthropogenic emission conditions predicted by the SSP1-26 scenario, the optimal emission control pathway tends to reduce much more combustion Nr emissions than agricultural NH3 emissions. The gradients suggest that to achieve the most efficient SIA mitigation, a 20–80% reduction in combustion Nr emissions should be along with 10–26% and 8–26% agricultural NH3 emissions, respectively, under 2019 and 2040 anthropogenic emissions. Such reduction of Nr emissions will respectively achieve 3.6–13.7 μg m−3 and 1.6–5.3 μg m−3 population-weighted mean SIA mitigations. When including ENOx_agri reduction, we find that the optimal pathway significantly shifts toward controlling agricultural emissions. Particularly, for the 2040 anthropogenic emission case, we estimate that the agricultural Nr emissions should almost be reduced simultaneously with combustion Nr emission reductions to achieve the most efficient SIA reductions, where the 20–80% reduction in combustion Nr emissions is suggested along with 14–59% agricultural Nr reduction. The associated population-weighted mean SIA mitigations are increased to 2.0–6.3 μg m−3, which are 16–38% higher than the case that ENOx_agri is neglected.
Discussion
In summary, our study reveals the crucial role of controlling NOx emissions originating from agricultural activities in mitigating future PM2.5 pollution over eastern China during crop-growing season, particularly in regions characterized by intensive agricultural practices, such as NCP. Despite the substantially lower magnitude of agricultural NOx (0.3 Tg N yr-1) emissions compared to NH3(8.5 Tg N yr-1), we find that the efficiency of reducing agricultural NOx emissions in mitigating SIAs will become comparable to reducing NH3 emissions over the North China Plain when fossil fuel emissions decrease to 2060 levels predicted by future emission scenarios, reflecting the nonlinear chemistry mechanisms of SIA formations. As a result, when designing optimal emission control pathways, including agricultural NOx emissions will shift the emission control strategies more towards reducing agricultural sources, and will achieve more efficient SIA mitigations.
In this study, we consider a simplified scenario, in which agricultural NOx and NH3 are synchronously controlled. This assumption is reasonable for a quick evaluation of the implications of agricultural NOx emissions on emission control strategies, since most of the nitrogen management practices, such as reducing the overuse of chemical fertilizer, can collectively reduce NH3 and NOx emissions. By synthesizing a wealth of field measurements, previous studies have summarized the impact of 11 different reactive nitrogen management practices on nitrogen loss20. These practices vary in terms of technical thresholds, mitigation efficacy, and implementation costs. Most of the practices affect both NH₃ and NOₓ emissions, but the reduction in NH3 and NOx emissions in response to a single practice can differ significantly (Supplementary Table 2). For example, using enhanced-efficiency fertilizers can reduce NH₃ emissions by 69% and NOₓ emissions by 46%, while irrigation management (e.g., reduced irrigation or drip irrigation) can reduce NH₃ emissions by 36% and NOₓ emissions by 93%20. The increased contribution of agricultural NOx emissions does not only occur in Eastern China. As predicted by SSP scenarios, over the anthropogenic emissions hotspots, such as India, Southeast Asia, and Western Europe, the contribution of agricultural sources to total anthropogenic sources will reach ~20% by 2060, similar to the contribution over Eastern China (Supplementary Fig. 13). Thus, to meet more stringent air quality standards and achieve continuous air quality improvement over agricultural-intensive areas in Eastern China and in other regions, we call for a detailed consideration of how nitrogen management practices can influence agricultural NOx emissions for designing future agricultural emission control strategies.
Methods
GEOS-Chem model description
We use the global three-dimensional chemistry transport model GEOS-Chem (version 12.9.3) to simulate the PM2.5 concentrations and their response to emission changes over China during the crop-growing season in 2019. We use the nested version of GEOS-Chem with a horizontal resolution of 0.625°(longitude) × 0.5°(latitude) over East Asia and 2.5°(longitude) × 2°(latitude) over the rest of the world. The model incorporates a comprehensive state-of-the-art O3-NOx-hydrocarbon-aerosol-halogen chemistry in the troposphere35,36. To estimate the partition of gas phase H2SO4-HNO3-NH3 with SIAs, the model employed the ISORROPIA-II thermodynamical model37. The chemistry, transportation, and deposition of chemical species as well as the biogenic emissions including soil NOx are driven by MERRA-2 meteorological data provided by the Global Modeling and Assimilation Office (GMAO) at the National Aeronautics and Space Administration (NASA). The MERRA-2 data has a temporal resolution of 1 h for surface variables and boundary layer height and 3 h for other three-dimensional variables.
The anthropogenic emissions other than agricultural NH3 over China are from the Multi-resolution Emission Inventory for China (MEIC; http://meicmodel.org/)7,38. The agricultural NH3 emissions are from the bottom-up emission inventory given by Zhang et al.7 and Chen et al.23. The natural emissions include NOx emissions from soil estimated by the Berkeley–Dalhousie Soil NOx emission Parameterization (BDSNP)22 and from lightning parameterized based on the cloud-top height39, biogenic volatile organic compound (VOC) emissions estimated by the Model of Emissions of Gases and Aerosols from Nature (MEGAN v2.1) algorithm40, and biomass burning given by the Global Fire Emissions Database version 4 (GFED4)41. By employing the aforementioned emission inventories, the model can generally capture the spatial distribution of PM2.5 concentration over China during the crop-growing season (May-August) when compared with the surface observations collected from the Ministry of Ecology and Environment of China (Supplementary Fig. 4).
Agricultural NOx emission parameterization
The agricultural NOx emissions are estimated as a part of soil NOx emissions by the BDSNP that was implemented in GEOS-Chem22. This parameterization characterizes the soil NOx emissions by considering the available soil nitrogen as well as meteorological conditions, including temperature and water-filled pore space (defined as the ratio of volumetric soil water content to total soil porosity). The dependence of agricultural NOx emissions on soil organic matter42 is not included in BDSNP parameterization. The BDSNP also considers the pulse of soil NOx emissions when the water-stressed bacteria is reactivated by irrigation or rainfalls and the canopy uptake of NOx. Lu et al.12 have demonstrated that the BDSNP parameterization can generally capture the spatial distribution of soil NOx emission in China when compared with available field measurements and satellite observation of tropospheric NO2 column density.
The available soil nitrogen includes the natural nitrogen pool as well as the external nitrogen input from fertilizer application and atmospheric deposition. Thus, agricultural NOx emissions can be calculated using the BDSNP parameterization by distinguishing the soil NOx emissions resulting from fertilizer nitrogen input. In Hudman et al.22, the spatial distribution of chemical fertilizer and manure is from Potter et al.43, with 37% of the manure added to soil nitrogen content. Since Potter et al.43 estimated the chemical fertilizer application and manure based on data reported from 1994 to 2001, we updated the dataset based on Chen et al.23, which estimated the monthly chemical fertilizer and manure for China between 2005 and 2016. Unlike the assumption made by Hudman et al.22 that 75% of the fertilizer is applied around the green-up day, Chen et al.23 considered detailed fertilizer application practices in China. In addition, the manure applied to the soil is estimated by the process-based mass-flow method. Annually, the total fertilizer application (chemical fertilizer and manure applied to soil) from Chen et al.23 (35 Tg yr-1) is higher than that given by Potter et al.43 (Supplementary Fig. 2). Besides direct fertilizer application, agricultural activities also indirectly contribute to soil nitrogen content through enhanced atmospheric deposition of reactive nitrogen. Through a sensitivity simulation that turns off all agricultural reactive nitrogen emissions, we estimate that soil NOx emissions driven by agricultural-induced nitrogen deposition account for only 3% of those from direct fertilizer application. Using the BDSNP parameterization, we calculate total soil NOx emissions in China to be 0.68 Tg N yr⁻¹, of which 0.33 Tg N is induced by agricultural fertilizer application, identified as agricultural NOx emissions in this study. The agricultural NOx emissions in China calculated with the updated fertilizer input data are 43% higher than the estimate obtained using the original BDSNP parameterization (Supplementary Fig. 14). The largest differences are observed over the North China Plain, where our updated estimates can exceed the original BDSNP by as much as 4 kg N ha-1 yr-1.
Future emission scenarios
We investigate the contribution of agricultural NOx emissions on PM2.5 pollution in the future based on the anthropogenic emission changes given by the sixth Coupled Model Intercomparison Project (CMIP6) scenarios44. The CMIP6 scenarios encompass projections of climate forcing in 2100 and future social evolutions by linking the Representative Concentration Pathways (RCPs) with the Shared Socioeconomic Pathways (SSP1-5). The Tier 1 scenarios of CMIP6 provide a comprehensive range of future climate-forcing targets, which include two baseline scenarios (SSP3-70 and SSP5-85) and two mitigation scenarios (SSP1-26 and SSP2-45). In this study, we chose the emission mitigation scenarios taking into account emission control policies in China. The SSP2-45 and SSP1-26 present a middle road and a strict mitigation pathway scenario, respectively. We only apply the annual scale factor for each emission sector estimated for the integrated assessment model (IAM) regions44 to GEOS-Chem emissions to represent future anthropogenic emission changes under various climate targets and emission control strategies.
Model experiments
We investigate the role of agricultural NOx emissions on PM2.5 pollution over eastern China through a series of GEOS-Chem model experiments as listed in Supplementary Table 1. The base simulations use the anthropogenic emission inventories described above, and future PM2.5 changes use the anthropogenic emissions for 2040 and 2060 predicted by SSP2-45 and SSP1-26 scenarios. To assess the contribution of agricultural and combustion NOx emissions to PM2.5 pollution, we conduct sensitivity simulations Group I and II, which are the same as base simulations but turn off agricultural NOx emissions and combustion NOx emissions, respectively. We further examine the role of agricultural NOx emissions in controlling present and future PM2.5 pollution by conducting simulations sensitivity simulations in Groups III and IV. Compared with the standard simulations, simulations in Group III reduce agricultural NH3 emissions by 40%, and simulations in Group IV reduce both agricultural NH3 and NOx emissions by 40%. To evaluate how the uncertainties in ENOx_agri will influence the efficiency of controlling agricultural NOx on mitigating SIA concentrations in the future, we also conduct simulations that assume a factor of 2 uncertainty (50–200%) in ENOx_agri following Lu et al.12 for sensitivity simulations Group III and IV for 2060. To estimate the optimal reactive Nr emission control pathways, we conduct sensitivity simulations in Groups V, VI, VII, which gradually reduce the Nr emissions from agricultural/combustion sources by each 20% step. We calculate the population-weighted regional mean SIA concentrations (PWC) based on the gridded SIA concentrations (({C}_{{{mathrm{SIA}}},i,j})) and the corresponding population densities (({P}_{i,j})) from LandScan Global 201945 .
We should note here since we only focus on the changes in anthropogenic emissions, all above simulations are conducted with the meteorological conditions fixed to 2019. The uncertainties from emissions and meteorological conditions are discussed in the Supplementary Materials.
 Meteorology and predictability for air quality management using TROPOMI")
Responses