Risk factors for non-responsiveness to 5-aminosalicylic acid in patients with ulcerative colitis identified using retrospective clinical study and Mendelian randomization

Introduction
Ulcerative colitis (UC) is a chronic inflammatory bowel disease characterized by symptoms of rectal bleeding, increased stool frequency, and decreased stool consistency1. Ng et al. reported that the incidence of UC worldwide, particularly in newly industrialized countries, is increasing annually2. The interaction of defective gut epithelial barrier, dysregulated immune responsivenesss, and dysbiosis of intestinal microbiota was considered to be associated with the development of UC1. The medications, including 5-aminosalicylic acid (5-ASA, also known as mesalazine) derivatives, corticosteroids, immunosuppressants, and biologics, have been demonstrated to effectively suppress intestinal inflammation in UC1. Among them, 5-ASA was recommended by consensus in multiple countries for maintenance therapy or as a first-line treatment during remission or in mild to moderate stages of the disease3,4,5. However, not all UC patients respond to 5-ASA treatment. Martí-Aguado et al. reported that the incidence of treatment failure with 5-ASA ranges from 17 to 75%, according to different definitions6. Moreover, patients who experience treatment failure with 5-ASA tended to exhibit more severe clinical symptoms, endoscopic manifestations, and higher inflammation level, which were unfavourable for the prognosis of the disease6. However, there are no effective methods to predict patients’ responsiveness to 5-ASA. According to the Chinese consensus on the diagnosis and treatment of inflammatory bowel disease5, patients are suggested to switch to or combine corticosteroids, immunosuppressants, or biologics only after 2 to 4 weeks of 5-ASA treatment without achieving the desired outcomes. Given that treatment failure with 5-ASA may further delay effective treatment for patients and negatively impact their quality of life, there is a need to develop methods to predict patients’ responsiveness to 5-ASA.
It is noteworthy that a previous retrospective study by Lin et al. identified the C-reactive protein-to-lymphocytes ratio and C-reactive protein-to-albumin ratio as effective indicators for predicting patients’ responsiveness to 5-ASA7. Additionally, Sun et al. prospectively compared the expression of serum bile acid metabolites between responders and non-responders to 5-ASA, finding that 12keto lithocholic acid may serves as a biomarker for patients’ responsiveness to 5-ASA8. However, these studies have primarily focused on indicators associated with immunity-related indicators, with limited exploration of indicators closely link to drug metabolism, such as those associated with liver and kidney functions. Moreover, these studies did not further explore the underlying mechanisms of risk factors contributing to non-responsiveness to 5-ASA from a pharmacological perspective.
Mendelian randomization (MR) is an epidemiological method that utilizes single nucleotide polymorphisms (SNPs) of exposure as instrumental variables (IVs) to assess genetic relationships between exposure and outcome9. Xie et al. reported a MR analysis method to evalued the effect of drug exposure targeted specific indicators in the treatment of the disease, wherein SNPs near the drug’s target genes were extracted from genome-wide association studies (GWAS) dataset related to specific indicator and served as exposure IVs, followed by a two-sample MR analysis to determine the causal relationship between the drug exposure and the disease10. This method effectively analyzed the therapeutic potential of drugs targeting downstream indicator in the treatment of diseases. Therefore, a retrospective clinical study was initially conducted to identify potential risk factors linked to non-responsiveness to 5-ASA, with a particular focus on liver and kidney function. Subsequently, MR analysis was employed to further investigate the effect of 5-ASA in treating UC by targeting the identified risk factors associated with non-responsiveness.
Materials and methods
Patients
The present study was a single-center retrospective study. Patients with mild or moderate UC who had been treated with 5-ASA at the Affiliated Dongguan Hospital of Guangzhou University of Chinese Medicine were included in this study. Due to an upgrade in the hospital’s medical record system in 2022, complete medical records are only available from that year. Therefore, this study only included cases from April 2022 to April 2024. The diagnosis of UC and the definition of severity were based on the Chinese Consensus on Diagnosis and Treatment in Inflammatory Bowel Disease in 20185. Additionally, according to the recommendations of the consensus5, non-responsiveness to 5-ASA was defined as patients who did not achieve any remission of clinical symptoms or endoscopic manifestations after receiving standardized 5-ASA treatment (2–4 g/d) for 2–4 weeks.
The inclusion criteria were as follows: (1) Patients diagnosed with mild or moderate UC according to the definition of the consensus while receiving 5-ASA treatment5; (2) Patients with retrievable medical records and laboratory tests during hospitalization; (3) Patients with a treatment history that conformed to the recommended treatment suggested by the consensus and allowed the assessment of patients responsiveness with 5-ASA5; (4) Patients aged between 18 and 75 years (both 18 and 75 years).
The exclusion criteria were as follows: (1) Patients who received 5-ASA for other indications or who met the definition of severe UC or UC in remission according to the consensus while receiving 5-ASA treatment5; (2) Patients without retrievable medical records and laboratory tests during hospitalization; (3) Patients treated with 5-ASA for less than 2 weeks or those without a treatment history to assess responsiveness to 5-ASA; (4) Patients younger than 18 years old or older than 75 years old; (5) Patients who were pregnant or breastfeeding during 5-ASA treatment.
The included patients were divided into a non-responsive group and a responsive group according to their responsiveness to 5-ASA, and differences in baseline characteristics and various laboratory indicators between the two groups were analyzed.
Sample size calculation
The sample size calculation was performed following the method described by Zemariam et al.11. Firstly, the sample size was calculated using a single population formula. Referring to the study by Sun et al. and Martí-Aguado et al.6,8, the incidence of non-responsiveness to 5-ASA (P) ranges from 10.94 to 75.00% according to the different definitions of treatment success. Therefore, we used the maximum and minimum reference values as the P values for separate calculations and set the margin of error as 20% of the corresponding P value, with a confidence level of 95%. Using the following formula, the total sample size was determined to range between 32 and 782.
Subsequently, based on data related to risk factors reported in the studies by Sun et al. and Lin et al.7,8, the sample size was calculated using the two-sample mean formula in PASS software version 15.0 (NCSS, LLC. Kaysville, Utah, USA). The appropriate method for sample size calculation was selected after assessing the homogeneity of variances in the original data using the F-test (Supplementary Table 1). By integrating these two methods, the minimum sample sizes for the responsive and non-responsive groups were ultimately determined to be no fewer than 35 and 6 cases, respectively.
Data collection
Patients’ demographic data, clinical symptoms, medical history (including comorbidities and any reported treatment-related reactions), medication history, allergy history (defined as diagnosed allergic reactions to any allergens or allergic diseases, such as allergic dermatitis, allergic asthma, etc.), duration of illness, endoscopic examination reports, pathological examination results, and laboratory test results during hospitalization were extracted from the electronic medical records. Laboratory tests included routine blood tests, liver function tests, renal function tests, and coagulation function tests. The improved Mayo score was evaluated based on the patients’ medical history and endoscopic examination results. The included indicators for all laboratory tests and reference ranges were detailed in Supplementary Table 2.
Mendelian randomization
The casual relationship among 5-ASA, alanine aminotransferase (ALT), and UC was evaluated using the MR analysis method as reported by Xie et al.10. The selection of IVs was based on the following assumptions: (1) the IVs were strongly associated with the exposure; (2) the IVs were independent of any confounding factors; (3) the IVs affected the outcome only through its association with the exposure. In brief, the drug targets of 5-ASA were identified from DrugBank (https://go.drugbank.com/), and the gene loci for each target were sourced from the National Library of Medicine (https://www.ncbi.nlm.nih.gov/gene/). Effective IVs targeting ALT were defined as SNPs within ± 100 kb of the target gene loci for 5-ASA that demonstrated genome-wide significance (P < 5 × 10⁻⁸) in GWAS dataset of ALT level12. To minimize the interference of genetic linkage disequilibrium (LD) on the outcomes, the LD threshold was set at R2 < 0.3.
In addition, SNPs associated with UC were excluded using the Geneatlas online dataset (http://geneatlas.roslin.ed.ac.uk/). The F-statistic for each SNPs was calculated following the method described by Wang et al.13, and SNPs with an F-statistic below 10 were excluded. Furthermore, the retained SNPs were harmonized separately with two GWAS datasets of UC: one from the UK Biobank database serving as a discovery set, and the other from the FinnGen database as the replication set14,15. Finally, MR analysis was performed on the harmonized data to identify potential associated targets (Fig. 1). The GWAS summary data used in this study were obtained from the MRC IEU OpenGWAS project (https://gwas.mrcieu.ac.uk/). All the cases from the UK Biobank database and the FinnGen database were defined according to the International Classification of Diseases and were all of European ancestry. Serum ALT were measured using the enzyme rate analysis method. The GWAS datasets and related features referenced in this study were detailed in Supplementary Table 3.

Flow chart of the present study. 5-ASA, 5-aminosalicylic acid; UC, ulcerative colitis; GWAS, genome-wide association studies; MR, Mendelian randomization; SNPs, single nucleotide polymorphisms.
MR analysis was conducted on harmonized data using MR Egger, weighted median, inverse variance weighted (IVW), simple mode, and weighted mode method. The IVW method was employed as the primary reference for estimating the causal effect of the exposure on the outcome by combining the Wald estimates from multiple instrumental variables. Heterogeneity was assessed using the MR Egger and IVW method, with a P value greater than 0.05 in the Cochran Q test indicating no significant heterogeneity. Additionally, leave-one-out analysis was employed to screen for potentially heterogeneous SNPs, and a funnel plot was used for visualization. The MR Egger regression equation was utilized to assess the horizontal pleiotropy of genetic instruments, where a P value greater than 0.05 indicated no horizontal pleiotropy. MR-PRESSO analysis was conducted to identify sources of horizontal pleiotropy16. Steiger filtering and directionality tests were employed for reverse causation testing on outcomes, with a P value less than 0.05 indicating no reverse causal relationship. All analyses were conducted using the TwoSampleMR package in the R software (version 4.3.1). The design of MR analysis adheres to the STROBE-MR guidelines.
Statistical analysis
Qualitative data were expressed as frequencies and percentages, while quantitative data conforming to a normal distribution were presented as mean ± standard deviation, and those not conforming to a normal distribution were represented by the median (interquartile range). The Chi-Square test, Yates’s correction for continuity, and Fisher’s exact test were employed for qualitative data, along with calculating odds ratios (OR) and 95% confidence intervals (CI). For quantitative data, the student’s t-test was used for intergroup comparisons if the data followed a normal distribution; otherwise, the Mann-Whitney U test was utilized. Furthermore, binary logistic regression analysis was conducted on the three variables with the smallest P values. Receiver operating characteristic (ROC) curve analysis was utilized to assess the predictive ability of risk factors for 5-ASA responsiveness. The calibration of the model was assessed using the Hosmer–Lemeshow test and Brier Score, while the clinical utility was evaluated by decision curve analysis. Data analysis was performed using SPSS software version 22.0 (IBM, Armonk, NY, USA) and R software (version 4.3.1). Differences were considered statistically significant when P < 0.05.
Results
Characteristics of included patients
A total of 84 records, including 83 patients, were retrieved. Ultimately, 50 records (patients) met the inclusion criteria, comprising 32 male and 18 female (Fig. 1). All included patients had only one treatment record and had received 5-ASA treatment prior to admission. The mean age of the included patients was 43.38 ± 13.23 years, ranging from 20 to 73 years. The primary reported manifestations were gastrointestinal symptoms, including hematochezia (28, 56.00%), abdominal pain (25, 50.00%), diarrhoea (23, 46.00%), mucous stool (13, 26.00%), abdominal distension (3, 6.00%), tenesmus (3, 6.00%), belching (3, 6.00%), acid reflux (2, 4.00%), and early satiety (1, 2.00%). In addition, 15 patients reported other extra-gastrointestinal manifestations, mainly shortness of breath (3, 6.00%), fever (2, 4.00%), dizziness (2, 4.00%), fatigue (2, 4.00%), back pain (2, 4.00%), chest tightness (1, 2.00%), cough (1, 2.00%), dysuria (1, 2.00%), and urticaria (1, 2.00%). The average duration of included patients was 4.40 ± 5.60 years. Furthermore, hepatobiliary disease, renal disease, ankylosing spondylitis (AS), and allergy history were reported in 24, 5, 6, and 5 patients, respectively (Supplementary Table 4).
Risk factors of patients’ responsiveness to 5-ASA
A total of 11 patients were included in the non-responsiveness group, while 39 patients were included in the responsiveness group. The incidence of fever (18.18% vs 0.00%, P = 0.045), back pain (18.18% vs 0.00%, P = 0.045), allergy history (36.36% vs 2.56%, P = 0.006), and AS (36.36% vs 5.13%, P = 0.017) was significantly higher in the non-responsive group compared to the responsive group (Table 1). There were no significant differences in age, gender, systolic pressure, diastolic pressure, duration of UC, clinical symptoms (including hematochezia, abdominal pain, diarrhoea, mucous stool, abdominal distension, tenesmus, belching, acid reflux, early satiety, shortness of breath, dizziness, fatigue, chest tightness, cough, dysuria, and urticaria), and comorbidities (including hepatobiliary disease and renal disease) between the non-responsive group and responsive group (both P > 0.05) (Supplementary Table 5).
In terms of laboratory test indicators, the monocyte count [0.48 (0.87) vs 0.33 (0.19), P = 0.035] and ALT level [19.00 (32.00) vs 15.00 (8.30), P = 0.028] were significantly higher in the non-responsive group compared to the responsive group. Conversely, the aspartate aminotransferase-to-ALT (AST/ALT) ratio [0.89 (0.40) vs 1.24 (0.53), P = 0.003] was significantly lower in the non-responsive group compared to the responsive group (Table 1). To further assess differences in liver function between the groups, patients were categorized into elevated, normal, and decreased group based on reference ranges for ALT level. The incidence of elevated ALT was significantly higher in the non-responsive group compared to the responsive group (27.27% vs 2.56%, P = 0.031) (Table 1). Other indicators included routine blood tests indicators, liver function tests indicators, renal function tests indicators, and coagulation function tests indicators did not show significant difference between the non-responsive and responsive groups (Supplementary Table 5). Moreover, univariate binary logistic regression analysis was conducted for the variables with a P-value less than 0.05 in the univariate analysis, including the incidence of fever, back pain, allergy history, and AS, monocyte count, ALT level, and AST/ALT ratio, to identify potential risk factors. Ultimately, the incidence of allergy history and AS, monocyte count, and AST/ALT ratio were identified as risk factors for patient responsiveness to 5-ASA and were included in the subsequent multivariate binary logistic regression model. A higher incidence of allergy history was identified as a risk factor (OR 140.50, 95% CI 2.09–9467.72, P = 0.021), while a higher AST/ALT ratio was identified as a protective factor against non-responsiveness to 5-ASA (OR 0.001, 95% CI 0.00–0.37, P = 0.023) (Table 2).
In addition, ROC analysis was performed to evaluate the predictive ability of the AST/ALT ratio for responsiveness to 5-ASA. The area under the ROC curve for the AST/ALT ratio and allergy history were 0.80 (95% CI 0.67–0.93, P = 0.003) and 0.67 (95% CI 0.46–0.88, P = 0.090), respectively (Fig. 2A). At the threshold of 1.21, the sensitivity and specificity of AST/ALT ratio to predict 5-ASA responsiveness were 0.51 and 1.00, respectively. The updated model, which incorporated allergy history and the AST/ALT ratio, demonstrated strong calibration, as evidenced by a Hosmer–Lemeshow test P value of 0.826 and a Brier score of 0.089. Decision curve showed that the model consistently achieved higher net benefits across a wide range of threshold probabilities (0.00–0.93), underscoring its strong practical utility in clinical applications (Fig. 2B).
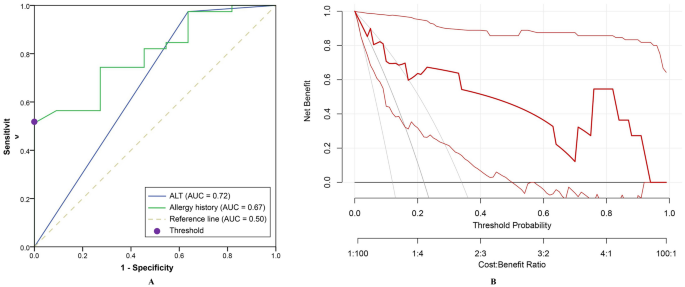
The ability of alanine aminotransferase to predict patients’ responsiveness to 5-aminosalicylic acid. (A) Receiver operating characteristic curve analysis of alanine aminotransferase to predict patients’ responsiveness to 5-aminosalicylic acid; (B) Decision curve analysis of the updated model. AUC, the area under the curve.
Mendelian randomization analysis
Considering that both the ALT level and AST/ALT ratio were associated with the responsiveness to 5-ASA, with ALT being a key indicator of liver function, we further investigated the role of ALT in the treatment of UC with 5-ASA using MR analysis. A total of 7 target genes of 5-ASA were retrieved from the DrugBank database, including prostaglandin G/H synthase 2, prostaglandin G/H synthase 1, arachidonate 5-lipoxygenase, peroxisome proliferator activated receptor gamma (PPARG), inhibitor of nuclear factor kappa-B kinase subunit alpha (CHUK), inhibitor of nuclear factor kappa-B kinase subunit beta, and inducible nitric oxide synthase 2 (Supplementary Table 6). However, in the GWAS data of ALT level, sufficient SNPs (three or more) were only available in the regions within ± 100 kb of the gene loci of PPARG and CHUK, enabling subsequent MR analysis (Supplementary Table 7). All SNPs had an F-statistic greater than 10, and no significant correlation with confounding factors was found (Supplementary Table 7). Two SNPs (rs2960421 and rs35812816) near the gene loci of PPARG were identified as having potential pleiotropy and were subsequently removed after MR-PRESSO analysis. Additionally, 1 SNP (rs6442310) near the gene loci of PPARG was excluded after harmonization. Finally, 11 and 30 significant SNPs were confirmed near the gene loci of PPARG and CHUK, respectively (Supplementary Table 7).
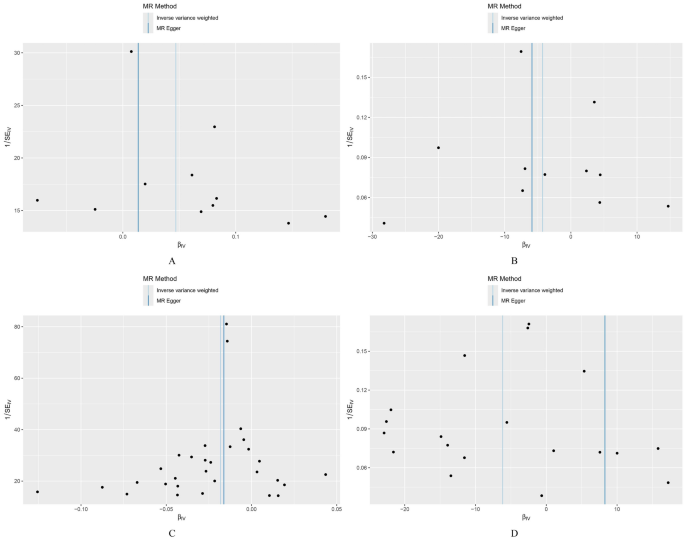
MR analysis indicated that the inhibition of CHUK by 5-ASA (β = 0.902, OR 1.02, 95% CI 1.01–1.03, P = 0.002, IVW method) and the activation of PPARG by 5-ASA (β = 0.494, OR 1.05, 95% CI 1.01–1.09, P = 0.015, IVW method) were positively associated with an increased risk of UC (Fig. 3, Supplementary Fig. 1). All P values in the Cochran’s Q test were greater than 0.05, indicating no evidence of heterogeneity (Table 3). The leave-one-out analysis did not identify any individual SNPs with a significant impact on the outcome, and the funnel plot exhibited a symmetric distribution of effect sizes, suggesting a low possibility of bias due to influential SNPs (Figs. 4, 5). Both MR Egger regression equation and MR-PRESSO analyses showed no horizontal pleiotropy between the outcome and exposure (both P > 0.05) (Table 3, Fig. 6). The Steiger filtering and directionality tests indicated no reverse causality existed in the results (both P < 0.05) (Table 3).
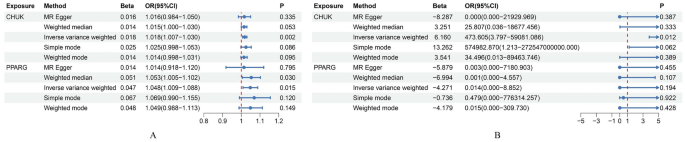
Summary forest plot of drug Mendelian randomization analysis. (A) Summary forest plot of drug Mendelian randomization analysis in the discovery set; (B) Summary forest plot of drug Mendelian randomization analysis in the replication set.
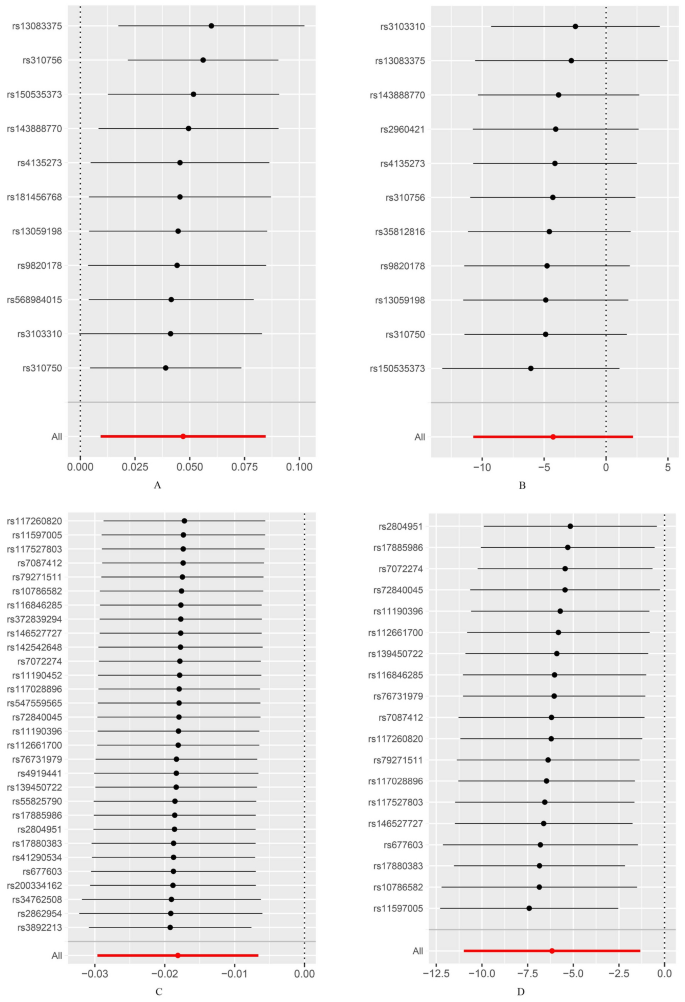
Leave-one-out test of drug Mendelian randomization analysis. (A) Leave-one-out test of drug Mendelian randomization analysis of peroxisome proliferator activated receptor gamma (PPARG) in the replication set; (B) Leave-one-out test of drug Mendelian randomization analysis of PPARG in the replication set; (C) Leave-one-out test of drug Mendelian randomization analysis of inhibitor of nuclear factor kappa-B kinase subunit alpha (CHUK) in the discovery set; (D) Leave-one-out test of drug Mendelian randomization analysis of CHUK in the replication set.
Funnel plot of drug Mendelian randomization analysis. (A) Funnel plot of drug Mendelian randomization analysis of peroxisome proliferator activated receptor gamma (PPARG) in the discovery set; (B) Funnel plot of drug Mendelian randomization analysis of PPARG in the replication set; (C) Funnel plot of drug Mendelian randomization analysis of inhibitor of nuclear factor kappa-B kinase subunit alpha (CHUK) in the discovery set; (D) Funnel plot of drug Mendelian randomization analysis of CHUK in the replication set.
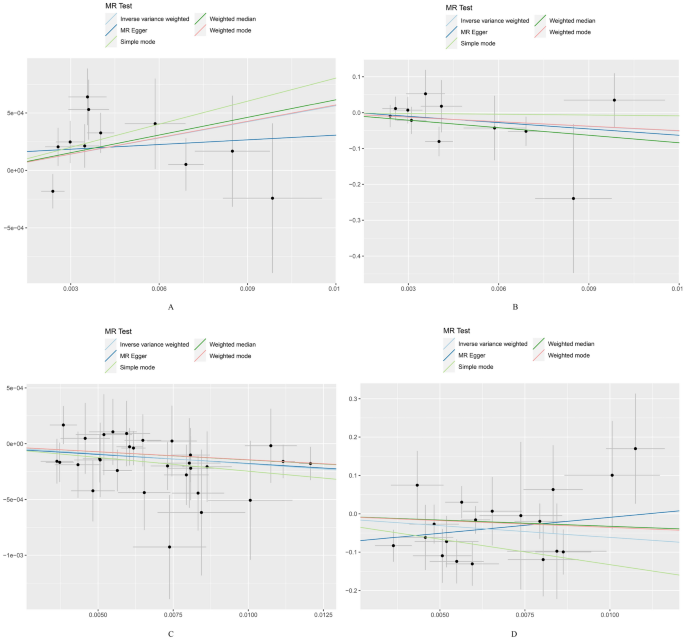
Scatter plot of drug Mendelian randomization analysis. (A) Scatter plot of drug Mendelian randomization analysis of peroxisome proliferator activated receptor gamma (PPARG) in the discovery set; (B) Scatter plot of drug Mendelian randomization analysis of PPARG in the replication set; (C) Scatter plot of drug Mendelian randomization analysis of inhibitor of nuclear factor kappa-B kinase subunit alpha (CHUK) in the discovery set; (D) Scatter plot of drug Mendelian randomization analysis of CHUK in the replication set.
Furthermore, we repeated the analysis using the GWAS dataset of UC from the FinnGen database. All SNPs had an F-statistic greater than 10, and no significant correlation with confounding factors was found (Supplementary Table 7). Three SNP (rs142542648, rs200334162, rs34762508, and rs55825790) near the gene loci of CHUK were excluded after leave-one-out analysis. Additionally, 2 SNPs (rs41290534 and rs2862954) near the gene loci of CHUK were identified as having potential pleiotropy and were subsequently removed after MR-PRESSO analysis. One SNP (rs6442310) near the gene loci of PPARG was excluded after harmonization. Finally, 11 and 19 significant SNPs were confirmed near the gene loci of PPARG and CHUK, respectively (Supplementary Table 7). Notably, consistent results were observed only for CHUK (β = 0.325, OR 473.605, 95% CI 3.80–59,081.09, P = 0.012, IVW method) and not for PPARG (β = 0.750, OR 0.01, 95% CI 2.20 × 10–05–8.85, P = 0.194, IVW method) (Fig. 3, Supplementary Fig. 1, Table 3). Sensitivity analyses showed no heterogeneity, horizontal pleiotropy, and reverse causality existed in the included SNPs (both P > 0.05) (Table 3, Figs. 4, 5, 6).
Discussion
In the present study, nearly a quarter of patients with mild to moderate UC exhibited a poor responsiveness to 5-ASA. The incidence of fever, back pain, allergy history, and AS, as well as monocyte count, ALT, and AST/ALT ratio were associated with patients’ responsiveness to 5-ASA. A high incidence of allergy history was considered a risk factor, while a high AST/ALT ratio was considered a protective factor for patients’ poor responsiveness to 5-ASA. In addition, we identified that the inhibition of CHUK by 5-ASA targeting ALT increase the risk of UC using the MR analysis.
Fever is widely recognized as a key clinical manifestation of UC, particularly in patients intolerant to 5-ASA17. Notably, our study also identified allergy history as a risk factor for 5-ASA non-responsiveness. Allergy has been considered a triggering or exacerbating factor for UC in previous studies18,19. However, it seems contradictory regarding the relationship between 5-ASA and allergy. On the one hand, previous studies have shown that 5-ASA inhibits histamine and immunoglobulin E-mediated hypersensitivity reactions20,21. On the other hand, 5-ASA was considered a allergen, which may induce hypersensitivity reactions in the organism22. However, the allergy history reported in the included subjects of this study only involved allergic reactions to drugs (including antibiotics, purified protein derivative tuberculin, and radioactive iodine), or allergic disease, rather than specifically allergic reactions to 5-ASA. It should be noted that 5-ASA could be converted to N-acetyl-5-ASA, a metabolite of 5-ASA without anti-inflammatory activity, after acetylation in the gut and liver, thereby influencing the therapeutic efficacy of 5-ASA23. Batra et al. reported that the variations in N-acetyltransferase 2, a gene related to N-terminal acetylation, is significantly associated with the expression of immunoglobulin E and eosinophils in allergic reactions, suggesting a potential link between allergic conditions and N-terminal acetylation24. Therefore, we hypothesized that a persistent allergic state may impact the N-terminal acetylation of 5-ASA, thus leading to the inactivation of 5-ASA. However, this hypothesis still requires further studies for confirmation. In addition, non-responders also reported a higher incidence of AS in our study, along with a markedly increased prevalence of back pain, a characteristic clinical symptom of AS25. The association between ankylosing spondylitis and UC has been established in previous studies, primarily based on genetic and immunological links26,27. Given their shared pathogenic loci, common treatments for either UC or AS, such as nonsteroidal anti-inflammatory drugs and 5-ASA, appeared to have limited efficacy in patients with both conditions28,29, which may contribute to the poor responsiveness to 5-ASA. Notably, considering the association between comorbidities such as allergic diseases and ankylosing spondylitis, and patients’ responsiveness to 5-ASA, future prospective studies evaluating patients’ responsiveness to 5-ASA should rigorously exclude the potential confounding effects of these conditions on the observed outcomes.
In this study, a high monocytes count and monocytes ratio, as well as a low neutrophils ratio were found to be positively associated with patients’ responsiveness to 5-ASA. Previous studies have demonstrated that the monocyte ratio is crucial in assessing the severity of UC and predicting the failure of advanced treatment30,31. Lin et al. reported that C-reactive protein-to-lymphocytes ratio has good predictive accuracy for patients’ responsiveness to 5-ASA7. Moreover, adsorptive granulocyte/monocyte apheresis has been recognized as an effective treatment for UC patients refractory to first-line medications, including 5-ASA and steroids32, suggesting that monocytes may play an essential role in the treatment of UC with 5-ASA.
In addition to the above indicators, the ALT level was positively associated with responsiveness to masalazine, as confirmed in both quantitative and qualitative analyses. Binary logistic regression analysis further substantiated that a low AST/ALT ratio is a risk factor for poor responsiveness to masalazine and demonstrated good predictive efficacy in identifying patients’ responsiveness to 5-ASA. Although ALT levels did not show a clear association with patients’ responsiveness to 5-ASA in the binary logistic regression analysis, the P value was very close to 0.05, which may still provide some insights. It should be mentioned that ALT is primarily localized in the cytoplasm of hepatocytes, whereas AST is found in both the cytoplasm and mitochondria of hepatocytes33. Previous study suggested that elevated ALT levels accompanied by a lower AST/ALT ratio are associated with the damage confined to the hepatocyte membrane, which indicatives milder liver injury, such as acute hepatitis or mild chronic hepatitis33. In light of our findings, we hypothesize that milder hepatocellular injury, characterized by a lower AST/ALT ratio and higher ALT levels, may be more closely associated with patients’ responsiveness to 5-ASA.
Given that the liver is the primary site for 5-ASA metabolism and ALT is a crucial indicator of hepatocellular activity34, the ALT level may play a pivotal role in regulating patients’ responsiveness to 5-ASA. Furthermore, we employed a drug target MR analysis method to explore the effect of 5-ASA in treating UC by targeting ALT, as referred by Xie et al.10. We hypothesized that ALT acts as a downstream indicator of 5-ASA in treating UC and utilized significant SNPs near the drug target gene loci of 5-ASA from the GWAS dataset of ALT as exposure IVs to explore their causal relationships with UC. We observed that CHUK, a key regulator of gene transcription inhibited by 5-ASA, targeting ALT was associated with an increased risk of UC. However, it is worth noting that the β values representing the effect of PPARG on UC in the replication set exhibited a trend opposite to that observed in the discovery set, but the difference was not statistically significant. In fact, prior to conducting the MR analysis in the replication set, we employed MR Egger, IVW, leave-one-out, and MR-PRESSO analyses to exclude SNPs with significant heterogeneity or horizontal pleiotropy. The leave-one-out plot and funnel plot indicated that the SNPs ultimately included in the analysis were reasonable, thereby ensuring the robustness of the results. Therefore, we believe that the factors contributing to the opposite direction of the β values and the large fluctuation in OR values observed in the replication set could be attributed to two main points. First, as shown in Supplementary Fig. 1, the SNPs included in the replication set showed significant variability in their effects on the outcome, with wider confidence intervals compared to those in the discovery set. Such variability may result in the outcome being influenced by key SNPs in the replication set, thus leading to opposite effect directions and substantial fluctuations in the OR values. Additionally, although we initially selected multiple GWAS datasets for the replication set, after considering factors such as sample size, detection time, and target population, we determined that data from the FinnGen database was the most suitable choice for the replication set. We acknowledge the limited power of the SNPs included in the replication set for interpreting the results and encourage future studies to replicate our findings when more suitable publicly available databases become accessible. Second, as shown in Supplementary Fig. 1, several SNPs overlaped between the discovery and replication sets. Notably, the effect sizes of some overlapping SNPs, including rs150535373, rs4135273, rs3103310, and rs143888770, exhibited opposite directions in the two datasets and significant fluctuations in their OR values, which may be contributing factors to the observed issues. Previous studies have shown that the effect of PPARG on diseases may vary by ethnicity and sex, which is associated with the genetic polymorphisms of PPARG35,36,37. Although both the discovery and replication sets in this study are derived from European populations, the discovery set primarily includes samples from the UK population14, while the replication set mainly consists of Finland individuals15. Previous genetic structure analyses indicated that the genetic characteristics of the UK population are more similar to those of populations in Germany, Belgium, and France38, whereas the Finland population are more closely related to those from Sweden and Russia39. These genetic differences may ultimately result in differential effects of PPARG on disease susceptibility across populations. Based on the results generated from the present study, CHUK was identified as a key target linking 5-ASA, ALT, and UC. Xu et al. indicated that CHUK might inhibit hepatocyte proliferation by activating the acetylation of p53, a tumour suppressor gene that promotes cell apoptosis40. Additionally, previous studies have shown that the N-acetyltransferase associated with 5-ASA metabolism is a risk factor for hepatotoxicity or hepatocellular carcinoma, highlighting N-acetylation as a hallmark of hepatocyte injury41,42. Although the hepatotoxicity of 5-ASA remains unclear, previous studies suggested that it may induce hepatocyte injury through mild hypersensitivity reactions23,43,44. Therefore, we hypothesized that triggering intracellular acetylation following hepatocyte injury caused by 5-ASA may increase the production of N-acetyl-5-ASA, thereby contributing to non-responsiveness to 5-ASA. Subsequently, increased N-acetylation of 5-ASA weakens the inhibition of CHUK and hinders hepatocyte repair, perpetuating a detrimental cycle detrimental to UC treatment.
There were two main limitations in this study. The first limitation was the limited sample size of the present study. It should be mentioned that although the incidence of UC has been increasing annually in recent years, it remains relatively low among the Chinese population. According to Xu et al.45, the incidence of UC in the Chinese population is approximately 8.95 cases per 100,000 person-years. Furthermore, to better assess the efficacy of 5-ASA as a first-line treatment, we restricted our study to patients with mild to moderate UC. Considering the mild symptoms of these patients, there may be limited hospitalization records available. Nevertheless, our retrospective study identified the AST/ALT ratio as a potential predictive marker for patients’ responsiveness to 5-ASA. Building on these findings, researchers could focus on the AST/ALT ratio or incorporate additional liver function indicators in prospective studies with rigorous control of confounding factors, thereby developing predictive models for patients’ responsiveness to 5-ASA and minimizing the waste of research resources. In addition, the AST/ALT ratio should be closely monitored as a preliminary predictor of patients’ responsiveness to 5-ASA, thereby enabling timely adjustments to the treatment regimen for patients with mild to moderate UC. Another limitation was the absence of a GWAS dataset for patients with poor responsiveness to 5-ASA, which impedes direct exploration of the relationship between ALT and 5-ASA responsiveness. In addition, the GWAS data utilized in the present study primarily originate from European populations, which may limit the generalizability of the findings to other ethnic groups and highlight the need for prospectively designed studies with larger sample sizes for validation. However, based on our retrospective study, which identified the AST/ALT ratio as a predictive marker for patients’ responsiveness to 5-ASA, we further used MR analysis to determine that 5-ASA targeting ALT increases the risk of UC, with CHUK identified as a potential target. Although the populations included in the two studies differ, our MR analysis actually confirmed the negative role of ALT in patients’ poor responsiveness to 5-ASA in a different population, thereby enhancing the credibility of our findings. Additionally, by targeting the role of CHUK in ALT-mediated 5-ASA responsiveness, modifications to 5-ASA could be made to enhance the efficacy of 5-ASA.


Responses