Saponin-based adjuvant uptake and induction of antigen cross-presentation by CD11b+ dendritic cells and macrophages

Introduction
Adjuvants are indispensable components of non-live attenuated virus vaccines, by boosting immune responses and improving vaccine efficacy. Classical vaccine adjuvants, including aluminum-based adjuvants, typically trigger a robust Th2 and neutralizing antibody response. However, these adjuvants do not effectively induce CD8+ T cell-mediated immunity. Especially for cancer and viral infections, a strong cellular T cell immunity mediated by CD8+ killer T cells is key to vaccine efficacy.
Saponin-based adjuvants (SBAs) excel as vaccine adjuvants when directly compared to other adjuvants such as aluminum-based adjuvants, oil-in-water emulsion adjuvants and CpG in a tumor model combined with cryoablation1. Saponins are triterpene glycosides which are plant compounds found in many plants. Specific saponin fractions isolated from the South American soapbark tree, Quillaja Saponaria, are unique and shown to have adjuvant activity2. Saponins, cholesterol and phospholipids can be formulated into forty nanometer cage-like particles, called immune stimulatory complexes (ISCOMs), to improve stability and safety3. SBAs are uniquely capable of inducing a high level of antigen cross-presentation by dendritic cells (DCs), in contrast to aluminum-based and oil-in-water emulsion adjuvants4. We and others have shown the strong adjuvant capacity of SBAs inducing DC cross-presentation and antigen-specific CD8+ T cell-mediated immunity against a variety of tumor and viral antigens4,5,6,7,8,9,10. Importantly, we have demonstrated using a tumor ablation model that SBAs induce antigen-specific CD8+ T cell responses and long-lasting tumor protection, which could even be further improved by co-administration of TLR9 agonist CpG1,11. Currently, the SBA-containing SARS-CoV-2 vaccine (NVX-CoV2373, Novavax) is successfully used in the clinic and shows high effectivity and safety, underlining the potency of SBAs as vaccine adjuvants12,13,14. Additionally, other successful SBA-containing vaccines are against Malaria (RTS, S/AS01, Mosquirix, GlaxoSmithKline) and Herpes Zoster (RZV, Shingrix, GlaxoSmithKline)15,16. The first clinical trials using SBAs as vaccine adjuvant against cancer are highly promising17,18,19. Enhanced responses were observed for both CD4+ and CD8+ T cell antigen epitopes in all vaccinated patients, which supports cross-presentation and CD8+ T cell activation by SBAs19. Although SBAs have been proven to be successful in inducing CD8+ T cell immunity, understanding of their exact mechanisms remains incomplete.
DCs are critical for activating CD8+ T cells via a process called cross-priming. Efficient cross-priming relies on the level of DC maturation (including co-stimulatory molecules and cytokines) and DC antigen cross-presentation. The importance of vaccine adjuvants stimulating DC cross-presentation has been described by Ho et al.20. Murine DCs in vivo can be classified as conventional DCs (cDCs), plasmacytoid DCs or monocyte-derived DCs21,22. cDCs can be further classified as CD8α+/CD103+ cDC1s and CD11b+/CD4+ cDC2s. In general, the CD8α+/CD103+ cDC1s are considered the most potent cross-presenters of exogenous antigens in vivo23,24. However, under specific circumstances all DC subsets have the capacity to cross-present25. Previously, we have shown that within the heterogenous murine in vitro GM-CSF-cultured bone marrow-derived dendritic cells (BMDCs), the MHCIIloCD11bhi BMDCs respond to SBAs, while MHCIIhiCD11bint BMDCs are unresponsive4,26. Importantly, the MHCIIloCD11bhi BMDC subset in vitro and the cDC2 subset in vivo were identified to be the most responsive DC subsets to SBA treatment, leading to potent cross-presentation4. The exact relation of the GM-CSF-cultured BMDC subsets to in vivo occurring myeloid subsets remains under debate26,27,28,29. However, since MHCIIloCD11bhi BMDC are responsive to SBA treatment, BMDCs form a powerful tool to study the cellular mechanisms of SBA-induced cross-presentation in vitro. SBA treatment strongly induced cross-presentation in the in vitro MHCIIloCD11bhi BMDCs and in vivo cDC2s, leading to antigen-specific CD8+ T cell activation4. Although originally cross-presentation was considered as an exclusive feature of DCs, recently it has become clear that other immune cells, particularly macrophages, are also capable of cross-presentation under specific circumstances30. During cross-presentation exogenous antigens gain access to the MHC-I antigen presentation machinery resulting in presentation of exogenous peptides in MHC-I/peptide complexes on the DC cell surface. Two main pathways of antigen cross-presentation are described: the cytosolic pathway and the vacuolar pathway31. In the cytosolic pathway, antigens are slowly degraded in endosomal compartments, then gain access to the cytosol where they are further degraded by the proteasome into peptides and enter the MHC-I antigen presentation route. On the other hand, cross-presentation via the vacuolar pathway is proteasome independent, and instead antigen degradation occurs in endo/lysosomal compartments by cathepsins. In both pathways, peptides are loaded onto MHC-I and presented in the MHC-I/peptide complexes on the DC cell membrane, which is necessary for CD8+ T cross-priming. We previously reported that SBA-induced DC cross-presentation has features of the cytosolic pathway including enhanced endosomal antigen translocation to the cytosol4.
We discovered that the induction of lipid bodies (LBs) is crucial for SBA-induced cross-presentation in DCs4. LBs are cellular organelles that consist of neutral lipids surrounded by a phospholipid monolayer, which store lipids in conditions of nutrient surplus and prevent lipotoxicity32. Next to their role in lipid metabolism, LBs also play a role in immune regulation4,33,34,35. Moreover, we previously discovered that SBA-induced DC cross-presentation is highly dependent on PKR-like Endoplasmic Reticulum kinase activation6.
In the present study, we investigated the cell-specific mode of action of SBAs formulated as ISCOMs by fluorescently labeling SBAs and exploring their uptake by DC subsets and macrophages. Successful labeling of ISCOMs with the lipophilic fluorescent carbocyanine dye SP-DiIC18(3) allowed us to demonstrate SBA uptake by both MHCIIloCD11bhi BMDCs and bone marrow-derived macrophages (BMDMs) in vitro and cDC2s and macrophages ex vivo. The primary route of SBA uptake was via clathrin-mediated endocytosis. Functionally, SBAs induced LBs and endosomal antigen translocation to the cytosol in BMDMs. Importantly, we demonstrated for the first time that SBAs induce highly efficient cross-presentation in BMDMs, leading to strong activation of CD8+ T cells. These insights into SBA-induced cross-presentation and immune activation make a significant impact on vaccine development, as our findings demonstrate that macrophages can contribute to SBA-induced cross-presentation and CD8+ T cell activation.
Results
Successful fluorescent labeling of ISCOMs
In order to visualize and study ISCOM uptake, we aimed to fluorescently label ISCOMs. Nine different lipophilic fluorescent carbocyanine dyes were tested for their ability to label lipophilic ISCOMs. ISCOMs were incubated with each of the dyes for 1 h at 37 °C, filtered using a 0.2 µm filter to remove crystalized and unbound dye after which the absorbance was measured36.
Three dyes, DiIC18(3)-DS, SP-DiIC18(3) and SP-DiOC18(3), were able to label ISCOMs and exhibited a clear signal after filtering (blue line, Fig. 1a and Supplementary Fig. 1). For both DiIC18(3)-DS and SP-DiIC18(3) the signal of labeled ISCOMs after filtering (blue line) is comparable to the corresponding dye without ISCOMs and without filtering (red dotted line), indicating high efficiency of ISCOM labeling. Labeling with SP-DiOC18(3) appeared less effective in this analysis. Of these three dyes, SP-DiIC18(3) showed the most favorable labeling profile, as the dye incubated without ISCOMs showed no signal after filtering (red line). ISCOM labeling with DiIC18(3) (DiI), DiIC18(5) (DiD), DiIC18(7) (DiR), DiOC18(3) (DiO), 4-Di-16-ASP (DiA) and 5,5’-Ph2-DiIC18(3) led to no or a low signal after filtering (blue lines, Supplementary Fig. 1). Therefore, further investigation was carried out with the three dyes that showed a signal after ISCOM labeling and filtering.

Lipophilic fluorescent carbocyanine dyes were incubated with or without ISCOMs for 1 h at 37 °C, filtered using a 0.2 µm filter and absorbance was measured. The dye without filtering (red dotted line), the dye after filtering (red line) and the labeled ISCOMs after filtering (blue line) are shown (a). BMDCs were incubated with OVA protein and with unlabeled ISCOMs or ISCOMs labeled with DiIC18(3)-DS, SP-DiIC18(3) or SP-DiOC18(3) for 5 h and co-cultured with B3Z T cells for 18 h as a read out for cross-presentation. As a positive control, BMDCs were pulsed with OVA peptide for 30 min before co-culture with B3Z T cells (b). BMDCs were incubated for 1 h at 37 °C with ISCOMs labeled with DiIC18(3)-DS, SP-DiIC18(3) or SP-DiOC18(3) and/or OVA-A647, then stained for CD11c, MHCII and CD11b and analyzed using flow cytometry (c–e). Uptake of labeled ISCOMs (c) or OVA-A647 (d) or both (e) is shown for MHCIIhiCD11bint and MHCIIloCD11bhi BMDCs. As a control, BMDCs were incubated with unlabeled ISCOMs, the corresponding dye without ISCOMs (Dye control) (c), or without ISCOMs nor OVA (Control) (d). BMDCs were incubated for 1 h at 37 °C with ISCOMs labeled with SP-DiIC18(3) (green) and OVA-A647 (red), stained with DAPI (blue), and analyzed with confocal microscopy. A line was drawn in the confocal images and the intensity of ISCOMs-SP-DiIC18(3) and OVA-A647 is quantified on the right. Each arrow indicates co-localization (f). Absorbance is shown for 1 labeling and is representative for all ISCOM labeling performed (a). Assays were performed with 3 biological replicates. Similar results were obtained in two to three independent experiments. Significance is shown as: not significant p > 0.05, *p ≤ 0.05, **p ≤ 0.01, ***p ≤ 0.001, ****p ≤ 0.0001.
Next, we determined whether ISCOMs remained functional after labeling and were still able to induce cross-presentation. For this purpose, the B3Z reporter T cell line was used, which specifically detects ovalbumin (OVA) peptide/MHC-I complexes in a co-stimulation independent manner. As antigen-presenting cells, GM-CSF-cultured BMDCs were used for which we have previously demonstrated ISCOM-induced cross-presentation of recombinant OVA protein as well as a synthetic long OVA peptide devoid of post-translational modifications (Supplementary Fig. 2a)4. Simultaneous treatment of ISCOMs and OVA leads to the highest induction of cross-presentation (Supplementary Fig. 2b). To study labeled ISCOMs, BMDCs were treated with OVA and either unlabeled or labeled ISCOMs with the three different dyes. Unlabeled and labeled ISCOMs equally induced DC cross-presentation of OVA protein to B3Z cells, showing that ISCOM labeling does not reduce its effectivity (Fig. 1b). BMDCs treatment with labeled ISCOMs also did not lead to major changes in the direct presentation of OVA peptide to B3Z T cells, indicating the absence of toxicity of the labeled ISCOMs preparations.
Our previous research showed that within the BMDCs, MHCIIloCD11bhi BMDCs were the most responsive to ISCOMs and ISCOM treatment leads to cross-presentation in this subset, while MHCIIhiCD11bint BMDCs were unresponsive to ISCOMs4. To visualize the uptake of ISCOMs and OVA, BMDCs were incubated with ISCOMs labeled with either DiIC18(3)-DS, SP-DiIC18(3) or SP-DiOC18(3) and fluorescently labeled OVA for 1 h. Then, BMDCs were stained for CD11c, MHCII and CD11b and analyzed using flow cytometry to discriminate between the ISCOM responsive MHCIIloCD11bhi and the ISCOM unresponsive MHCIIhiCD11bint BMDC subsets (gating in Supplementary Fig. 3a). In line with the SBA responsiveness, we observed a high uptake of ISCOMs by MHCIIloCD11bhi BMDCs, while the uptake by MHCIIhiCD11bint BMDCs was much lower (Fig. 1c). DiIC18(3)-DS and SP-DiOC18(3) dyes showed some unspecific signal with the dye control without ISCOMs, while SP-DiIC18(3) showed no background. Based on these data, we conclude that SP-DiIC18(3) labeled ISCOMs showed identical activity to unlabeled ISCOMs in multiple assays and has the highest specificity. For SP-DiIC18(3)-labeled ISCOMs an uptake of 84% was observed in the MHCIIloCD11bhi BMDCs, while the uptake by MHCIIhiCD11bint BMDCs was only 14% (Fig. 1c).
Analysis of OVA uptake showed a similar pattern, high uptake in the MHCIIloCD11bhi BMDCs (~95% OVA+ cells) and much lower uptake in the MHCIIhiCD11bint BMDCs (~33% OVA+ cells) (Fig. 1d). ISCOMs did not affect OVA uptake (Supplementary Fig. 3b) and ISCOM or OVA treatment did not affect BMDC marker expression (Supplementary Fig. 3c). When uptake was studied for ISCOMs and OVA combined, analysis showed that 81% of the MHCIIloCD11bhi BMDCs contain both ISCOMs and OVA, significantly higher compared to the 9% uptake in MHCIIhiCD11bint BMDCs (Fig. 1e). Interestingly, confocal imaging revealed that after 1 h incubation, SP-DiIC18(3) labeled ISCOMs show strong co-localization with OVA in endosome-like structures (Fig. 1f). Collectively, these data show successful and specific fluorescent labeling of ISCOMs using SP-DiIC18(3) providing an excellent tool for investigating ISCOM uptake.
ISCOMs are efficiently taken up by MHCIIloCD11bhi BMDCs and BMDMs via clathrin-mediated endocytosis
The finding that the ISCOM responsive MHCIIloCD11bhi BMDCs take up high amounts of ISCOMs led us to compare ISCOM uptake between DCs and macrophages, since macrophages are phagocytes well known for their high uptake and scavenging capacity. For uptake analysis, BMDCs and M-CSF-cultured BMDMs were treated with ISCOMs-SP-DiIC18(3) or labeled OVA. Cells were analyzed by flow cytometry and BMDMs were gated based on F4/80+ and CD11b+ marker expression (Supplementary Fig. 4a). ISCOM nor OVA treatment did affect BMDM marker expression (Supplementary Fig. 4b). After 1 h, more than 90% of the BMDMs had taken up ISCOMs, which was 1.2 times higher compared to MHCIIloCD11bhi BMDCs and 3.1 times higher compared to MHCIIhiCD11bint BMDCs (Fig. 2a). The uptake efficiency of labeled OVA was comparable to ISCOMs, showing that BMDMs have a high uptake capacity of both ISCOMs and OVA (Fig. 2b). Moreover, the uptake of ISCOMs and OVA signal is clearly higher in MHCIIloCD11bhi BMDCs and macrophages compared to MHCIIhiCD11bint BMDCs, as demonstrated by the high mean fluorescent intensity (MFI) relative to the control conditions (Fig. 2a, b).
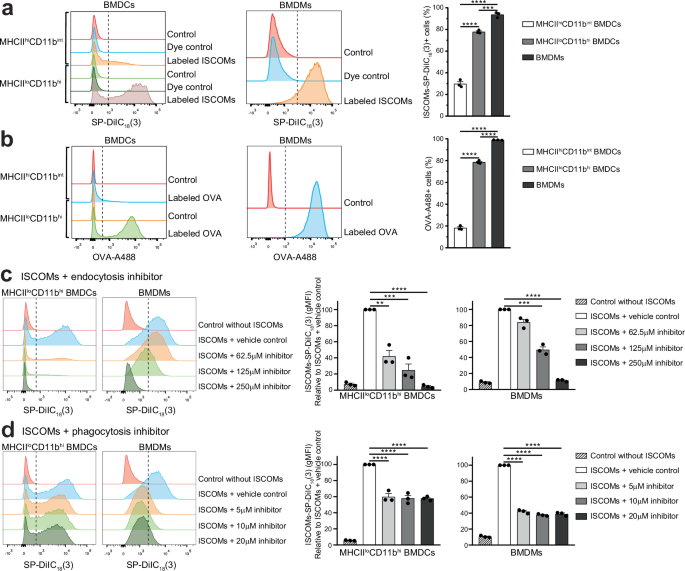
BMDCs and BMDMs were incubated for 1 h at 37 °C with ISCOMs-SP-DiIC18(3) (a) or OVA-A488 (b). As a control, BMDCs and BMDMs were incubated without ISCOMs nor OVA (Control) (ab) or with SP-DiIC18(3) without ISCOMs (Dye control) (a). BMDCs and BMDMs were pre-incubated for 10 min with clathrin-mediated endocytosis inhibitor monodansylcadaverine or with actin polymerization and phagocytosis inhibitor cytochalasin D or the respective vehicle control (concentrations shown in the figure) and subsequent incubation with ISCOMs-SP-DiIC18(3) for 1 h at 37 °C in presence of the specific inhibitor. Quantification is shown relative to cells treated with the vehicle control (c, d). Assays were performed with 3 biological replicates. Flow cytometry histograms are shown for 1 representative replicate and quantification is shown for 3 biological replicates. Similar results were obtained in two to three independent experiments. Significance is shown as: not significant p > 0.05, *p ≤ 0.05, **p ≤ 0.01, ***p ≤ 0.001, ****p ≤ 0.0001.
To study the uptake mechanisms, BMDCs and BMDMs were treated either with monodansylcadaverine, which inhibits clathrin-mediated endocytosis, or with cytochalasin D, which inhibits actin polymerization and phagocytosis, or the corresponding vehicle control, prior to incubation with ISCOMs-SP-DiIC18(3). Inhibition of clathrin-mediated endocytosis prevented ISCOM uptake in MHCIIloCD11bhi BMDCs and BMDMs, in a dose-dependent manner, relative to cells treated with the vehicle control (Fig. 2c). The highest dose completely inhibited ISCOM uptake, bringing fluorescent levels back to baseline. The phagocytosis inhibitor only partially prevented ISCOM uptake in MHCIIloCD11bhi BMDCs and BMDMs, independent of inhibitor concentration (Fig. 2d).
In conclusion, MHCIIloCD11bhi BMDCs and BMDMs both take up a high amount of ISCOM and OVA with the most impressive uptake in BMDMs. Moreover, these data show for the first time that ISCOM uptake primarily occurs through clathrin-mediated endocytosis in both cell types.
ISCOMs are taken up by cDC2s and macrophages ex vivo
Next, the uptake of ISCOMs and OVA was investigated in freshly isolated antigen presenting cells that naturally occur in the spleen. To this end, spleens were isolated, processed to single cells, and incubated for 1 h with ISCOMs-SP-DiIC18(3) or labeled OVA. Immune cell subsets were identified based on staining for B220, CD11c, CD11b and F4/80 and measured by flow cytometry (gating shown in Fig. 3a). First B220+ cells were excluded, including B220+ B cells and pDCs, and then CD11c+ DCs and CD11c- cells were analyzed.
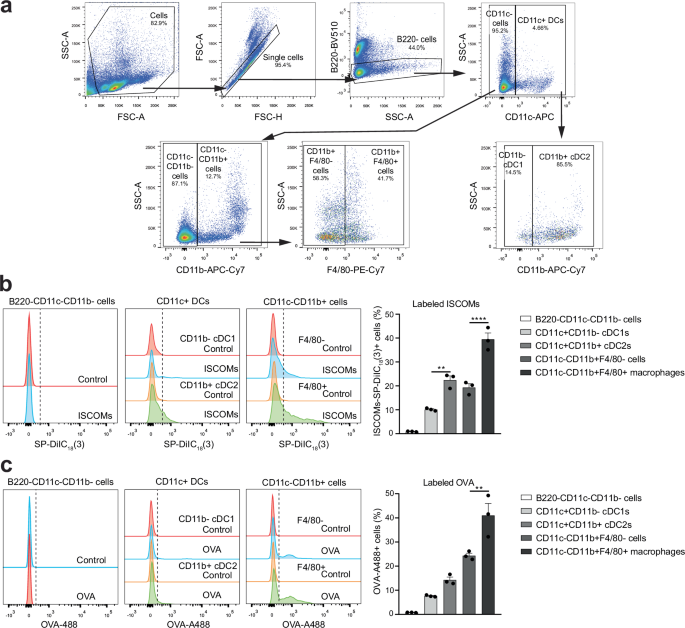
Spleens were isolated, processed to single cells, incubated for 1 h with ISCOMs-SP-DiIC18(3) or OVA-A488, then stained for B220, CD11c, CD11b and F4/80 and measured by flow cytometry (a–c). Flow cytometry gating for CD11c+ CD11b- cDC1s, CD11c+CD11b+ cDC2s, B220-CD11c-CD11b- cells, CD11c-CD11b+F4/80- cells, and CD11c-CD11b+F4/80+ macrophages in the spleen (a). ISCOM+ cells or OVA+ cells were analyzed within the different immune subsets in the spleen and quantified (b, c). Percentages of each gate are shown as frequency of the corresponding parent gate. Assays were performed with 3 biological replicates. Flow cytometry histograms are shown for 1 representative replicate and quantification is shown for 3 biological replicates combined. Similar results were obtained in two to three independent experiments. Significance is shown as: not significant p > 0.05, *p ≤ 0.05, **p ≤ 0.01, ***p ≤ 0.001, ****p ≤ 0.0001.
In cells isolated from the spleen, B220-CD11c-CD11b- cells did not show uptake of ISCOMs nor OVA (Fig. 3b, c, Supplementary Fig. 5a-b). ISCOMs and OVA were taken up by part of the CD11c+ DCs, with a higher amount of positive cells in the CD11b+ cDC2s compared to the CD11b- cDC1s. Additionally, part of the CD11c-CD11b+F4/80- cells and the CD11c-CD11b+F4/80+ macrophages also take up ISCOMs and OVA, with CD11c-CD11b+F4/80+ macrophages showing the highest amount of positive cells. Within the spleen, CD11c-CD11b+F4/80+ macrophages are the immune cells that take up most of the ISCOMs and OVA, with 40% ISCOM+ and 44% OVA+ cells. Additionally, ISCOM and OVA uptake also occurs in CD11b+ cDC2s and CD11b+F4/80+ macrophages isolated from inguinal lymph nodes (Supplementary Fig. 5c). These findings show that the OVA and ISCOM uptake also occurs in ex vivo isolated cDC2s and macrophages naturally present in vivo.
ISCOMs induce LBs and antigen translocation in both BMDCs and BMDMs
ISCOM-induced cross-presentation in BMDCs was previously shown to depend on two key mechanisms namely lipid body (LB) induction and antigen translocation4. To study LB induction in macrophages exposed to ISCOMs, BMDMs were incubated for 5 hours with ISCOMs and LBs were stained using Bodipy 493/503 (green) and the amount of LBs per cell was visualized by confocal microscopy. BMDCs were used as controls and incubation with fatty acid oleic acid was used as a positive control for LB formation. As expected, oleic acid caused LB formation in a large amount of BMDCs and BMDMs (Fig. 4a, b). Similar to our previous findings, ISCOMs induced LB formation in 50% of the BMDCs (Fig. 4a). Interestingly, BMDMs formation of LBs was observed in almost 40% of the cells within this time span (Fig. 4b).
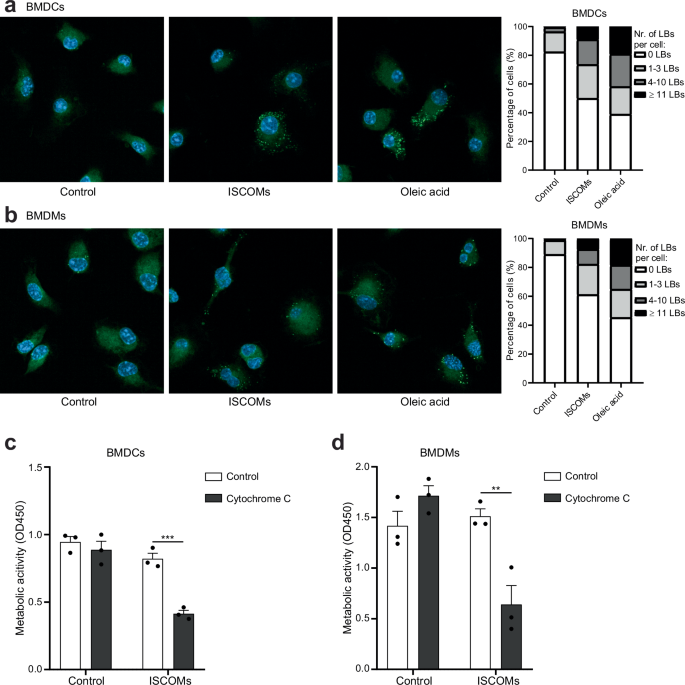
BMDC and BMDMs were untreated or treated with ISCOMs or oleic acid for 5 h. Confocal images: nuclear DAPI (blue) and BODIPY 493/503 LBs (green). Representative confocal images and the percentage of cells with 0, 1–3, 4–10 or ≥11 LBs per cell are shown (a, b). BMDC and BMDMs were untreated or treated with ISCOMs without or with cytochrome c for 5 h and metabolic activity and cell viability was then measured with a CCK8 assay which acts as a read out for antigen translocation (c, d). For LB stainings, every condition contains >50 cells per replicate. LB staining and antigen translocation assays were performed with 3 biological replicates. Similar results were obtained in two to three independent experiments. Significance is shown as: not significant p > 0.05, *p ≤ 0.05, **p ≤ 0.01, ***p ≤ 0.001, ****p ≤ 0.0001.
To compare antigen translocation, BMDCs and BMDMs were incubated with ISCOMs with or without cytochrome c for 5 h. Cytochrome c is taken up by cells in endosomes and entrance into the cytosol leads to cell death which can be studied by measuring metabolic activity. As previously shown, treatment with ISCOMs led to a clear antigen translocation in BMDCs, as demonstrated by the significant increase in cell death when combined with cytochrome c (Fig. 4c). Interestingly, ISCOM treatment in the presence of cytochrome c led to a significant drop in cell viability in BMDMs as well (Fig. 4d). This shows that antigen translocation is a direct effect of ISCOM treatment in both BMDCs and BMDMs, suggesting at least a partly shared mechanism of ISCOM-induced cross-presentation in both myeloid cell types. These data further show that ISCOMs cause antigen escape both in BMDCs and BMDMs, which is crucial for antigen availability to the Ubiquitin-Proteasome System and MHC-I antigen presentation pathway enabling cross-presentation via the cytosolic pathway. In summary, we show for the first time that ISCOMs induce LB formation and endosomal antigen translocation to the cytosol in BMDMs.
ISCOMs induce cross-presentation and CD8+ T cell priming by BMDCs and BMDMs
Next, we determined whether ISCOM uptake by BMDMs also results in ISCOM-induced cross-presentation and CD8+ T cell priming. Hence, we used the OVA-specific B3Z reporter T cell line to compare the level of OVA cross-presentation between BMDCs and BMDMs. As previously shown, ISCOMs induced cross-presentation in BMDCs which led to activation of B3Z T cells (Fig. 5a, left). Strikingly, ISCOMs also induced highly efficient cross-presentation in BMDMs (Fig. 5a, right). Importantly, treatment with ISCOMs did not reduce the viability or MHC-I levels of the cells, as presentation of OVA peptide to B3Z cells was intact for both BMDCs and BMDMs (Fig. 5a). To unequivocally demonstrate that BMDMs are responsible for the observed ISCOM-induced cross-presentation and to exclude a role for potentially contaminating CD11c+ DCs, CD11b+F4/80+CD11c- BMDMs were FACS-sorted and cross-presentation was analyzed. The data show that FACS-sorted BMDMs are at least as efficient as unsorted BMDMs, confirming BMDMs are indeed responsive to ISCOM-induced cross-presentation (Fig. 5b, Supplementary Fig. 6).
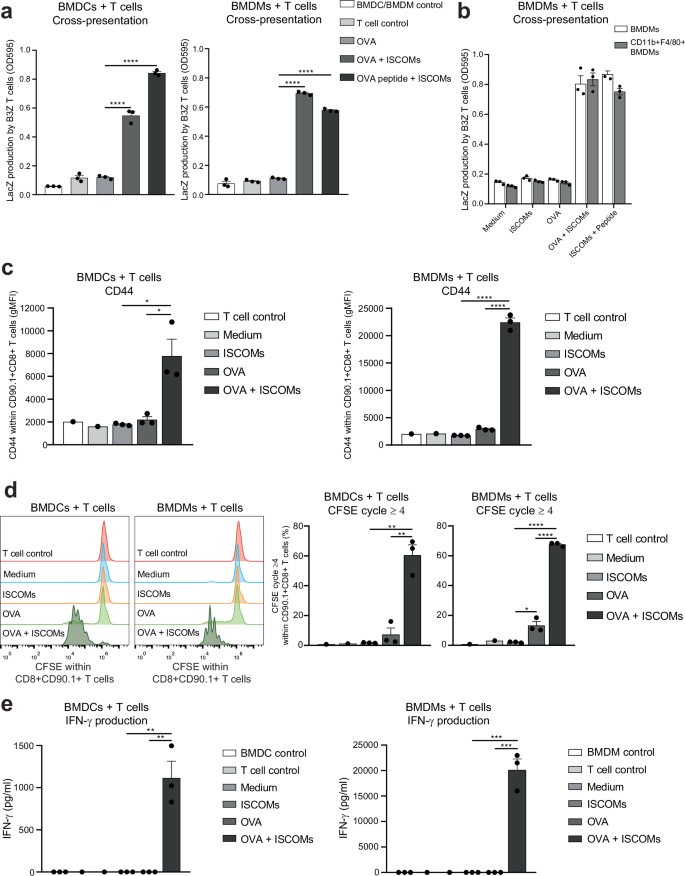
BMDCs or BMDCs were incubated with OVA protein in combination with or without ISCOMs for 5 h and then co-cultured with B3Z T cells for 18 h. As a positive control, ISCOM-treated BMDCs or BMDMs were pulsed with OVA peptide for 30 min before co-culture with B3Z T cells (a). Total unsorted BMDMs or FACS-sorted CD11b+F4/80+CD11c- BMDMs were incubated with OVA protein with or without ISCOMs for 5 h and then co-cultured with B3Z T cells for 18 h. As a positive control, ISCOM-treated unsorted or sorted BMDMs were pulsed with OVA peptide for 30 min before co-culture with B3Z T cells (b). OT-I T cell activation assay: BMDCs and BMDMs were incubated with OVA and/or ISCOMs, and co-cultured for 72 h with CFSE-labeled CD8+CD90.1+ T cells isolated from OT-I transgenic mice (c–e). Marker expression of CD44 is shown within CD8+CD90.1+ T cells after 72 h of co-culture (c). CFSE staining as read out for proliferation within CD8+CD90.1+ T cells (left panel) and the percentage of T cells which proliferated four or more times (right panel) after 72 h of co-culture (d). IFN-γ production measured in the supernatant after 72 h of co-culture (e). Assays were performed with 3 biological replicates. Medium controls and T cell controls (c–e) were performed with 1 biological replicate and not used for statistics. Similar results were obtained in two to three independent experiments. Significance is shown as: not significant p > 0.05, *p ≤ 0.05, **p ≤ 0.01, ***p ≤ 0.001, ****p ≤ 0.0001.
Finally, we tested the cross-priming ability of ISCOMs- and OVA-treated BMDCs and BMDMs, using freshly isolated OVA antigen-specific CD8+ OT-I T cells that depend on proper co-stimulation. Hereto, the activation, proliferation and IFN-γ production of CFSE-labeled OT-I T cells were analyzed 72 h after co-culture with either BMDCs or BMDMs (Gating strategy in Supplementary Fig. 7a).
As a measure for T cell activation, CD44 levels were measured within the CD90.1+CD8+ T cells. As expected, CD44 is significantly higher expressed after co-culture with BMDCs treated with OVA and ISCOMs compared to BMDCs treated with OVA alone (Fig. 5c). Strikingly, co-cultures of T cells with BMDMs treated with ISCOMs and OVA resulted in a high level of CD44 expression by T cells (Fig. 5c). Remarkably, analysis of the proliferation cycles of the CFSE-labeled T cells demonstrated that co-culture with BMDCs or BMDMs treated with OVA and ISCOMs both resulted in a strong increase in T cell proliferation (cycle 4 or higher), while OVA alone only led to a small amount of T cell proliferation (Fig. 5d, Supplementary Fig. 7b).
IFN-γ production was measured after co-culture as a sign of adequate CD8+ T cell activation. As expected, co-culture with OVA- and ISCOM-treated BMDCs leads to a significant production of IFN-γ by T cells (Fig. 5e, left). Impressively, co-culture with OVA- and ISCOM-treated BMDMs yielded even higher IFN-γ production by the T cells with a concentration that is 18 times higher compared to co-culture with BMDCs (Fig. 5e).
Altogether, ISCOMs specifically induce antigen cross-presentation and CD8+ T cell priming by BMDMs, which was previously only described for BMDCs.
Discussion
The contribution of DCs to the immune response upon SBA vaccination has been widely studied, but information about the involvement of other myeloid cells is largely lacking. Applying a new protocol to label SBAs we now show efficient SBA uptake in both MHCIIloCD11bhi BMDCs and BMDMs in vitro, and in splenic cDC2s and macrophages ex vivo. Using SBA labeling we were able to demonstrate that SBA uptake by both myeloid cell types mainly occurs via clathrin-mediated endocytosis. Moreover, SBAs facilitate antigen translocation and induce LBs in both BMDCs and BMDMs, suggesting at least a partial overlap in the molecular mechanisms of SBAs in DCs and macrophages. Importantly, we demonstrate that SBAs induce high level cross-presentation in BMDMs, leading to strong activation and proliferation of CD8+ T cells as well as cytokine production.
In this study, we successfully labeled SBAs using the lipophilic fluorescent carbocyanine dye SP-DiIC18(3), which was inspired by the SBA labeling shown by Claassen et al.36. While Claassen et al. used DiIC18(3) (DiI) and DiOC18(3) (DiO) for SBA labeling, we obtained the best signal and the highest specificity with SP-DiIC18(3), which is a recently developed analog of DiIC18(3). Fluorescently labeled SBAs allowed us to study the SBA uptake in different immune cell subsets.
Radioactive and fluorescent labeling of SBAs and their corresponding antigens has previously been used to study biodistribution after in vivo injection and to determine the injection route giving the best protective effect of vaccination36,37,38,39.
Interestingly, already more than 20 years ago, uptake of SBAs was observed in macrophages in vivo36,40. However, since then, research on SBA-induced cross-presentation and CD8+ T cell activation was mostly focused on DCs. We now show that not only BMDCs, but also BMDMs acquire the ability of cross-presentation and CD8+ T cell activation following uptake of SBA and antigen.
Uptake of soluble OVA by DCs and macrophages can occur via different uptake mechanisms, including pinocytosis and clathrin-mediated endocytosis. However, exclusively when OVA uptake occurs by clathrin-mediated endocytosis via the mannose receptor, cross-presentation by DCs and macrophages resulting in CD8+ T cell activation can take place41. In the current study, we observed co-localization of OVA and SBAs in endosome-like structures. After cellular uptake, mannose receptor-endocytosed OVA localizes in early endosomes, positive for Rab5 and EEA1, in a highly specific manner41. The observed co-localization of OVA and SBAs implies that SBAs and OVA both are present in early endosome compartments. In line, the observed uptake of SBAs and OVA by MHCIIloCD11bhi BMDCs and BMDMs was mostly mediated by clathrin-mediated endocytosis. Whether SBA uptake is dependent on a specific cell surface receptor remains unknown, although a highly specific uptake mechanism could possibly explain the high SBA uptake specifically in MHCIIloCD11bhi BMDCs and BMDMs. Interestingly, in steady state MHCIIhiCD11bint BMDCs have been reported as superior cross-presenters of soluble OVA despite higher antigen uptake by MHCIIloCD11bhi BMDCs26. SBAs, however, induce high cross-presentation in MHCIIloCD11bhi BMDCs and BMDMs, while MHCIIhiCD11bint BMDCs do not respond to SBAs. The ability of SBAs to boost cross-presentation in additional immune cells apart from the typical cross-presenters, could explain the potent immune response elicited by SBAs.
In the current study we showed that SBAs facilitate endosomal translocation to the cytosol in both BMDCs and BMDMs. Endosomal escape of antigens is crucial for cross-presentation via the cytosolic pathway. One of the main reasons for the higher efficiency of cross-presentation of MHCIIhiCD11bint BMDCs compared to MHCIIloCD11bhi BMDCs in steady state is the higher endosomal antigen translocation into the cytosol, which is shown to also occur in vivo42. Different mechanisms for endosomal escape in steady state have been proposed, including endosomal membrane damage caused by lipid peroxidation and translocation mediated by Sec61, which is recruited from the ER to antigen-containing endosomes upon stimulation43,44. However, the exact mechanisms of antigen translocation by SBAs remain unknown. We previously showed that endosomal escape facilitated by SBAs is preceded by endosomal acidification, as blocking V-ATPase activity by Bafilomycin A1 prevented SBA-induced endosomal translocation and cross-presentation in BMDCs, but not LB formation4.We now show that efficient cross-presentation is paired with a high uptake and co-localization of SBAs and antigen in early endosomes, suggesting a possible direct effect of SBAs on the endomembrane integrity leading to endosomal escape.
LBs are not only crucial for lipid storage, LBs can also have an immune regulating function which can lead to either increased or dampened cross-presentation in DCs, likely depending on the LB content33,34,35,45,46,47. We previously showed that LB induction is only observed in the MHCIIloCD11bhi BMDCs upon ISCOM treatment and that LBs were necessary for efficient cross-presentation induced by SBAs4,6. We also showed that the amount of LBs observed is highly increased when specifically studying MHCIIloCD11bhi BMDCs compared to the total population of BMDCs4. Here, we compare total BMDCs with BMDMs and we observe a similar amount of LB induction in BMDCs and BMDMs. This poses the question if LBs play a similar role in BMDMs as in BMDCs upon SBA treatment and if an even more responsive subset might be present within the BMDMs.
It is becoming clear that not only DCs, but also macrophages are capable of cross-presentation and contribute to anti-viral and anti-tumor immunity48,49. Inducing macrophage cross-presentation is a highly successful strategy to induce CD8+ T cell mediated immunity. Different vaccination strategies using micro- and nanosized particles have shown successful cross-presentation by cDC2s and macrophages leading to a strong CD8+ T cell response in vivo50,51,52. Moreover, induction of cross-presentation by macrophages might be key to overcoming therapy resistance in tumor with low expression levels of MHC-I, which makes SBAs even more promising for use in anti-tumor vaccinations53.
We have previously shown that vaccination with antigen and SBAs and by ablative therapy of melanoma tumors combined with SBA injection elicited a robust immune response in vivo1,4. Interestingly, vaccination with SBAs led to an immune cell influx and immune cell activation in the draining lymph nodes, including DCs, inflammatory monocytes and macrophages39,54. This implies that macrophages also in vivo are in position to activate T cells especially upon SBA vaccination. It would be of interest to study the specific contribution of cross-presentation by DCs versus macrophages during in vivo vaccination. However, complete depletion of specific immune subset and studying their contribution to cross-presentation has proven to be extremely challenging.
The use of SBAs in immunotherapy against cancer is highly promising. The first clinical trials including SBAs show an acceptable safety profile and clinical benefit in part of the patients17,18,19. Enhanced responses were observed for both CD4+ and CD8+ T cell antigen epitopes in all tested patients, which supports enhanced cross-presentation in humans after SBA vaccination19. To further develop successful treatment strategies, more knowledge about the SBA-induced immune response is crucial. We have previously shown that SBAs induce cross-presentation in human DCs, specifically CD11c+CD1c+CD5-CD163+ type 2 conventional DCs55. If SBAs also induce cross-presentation in human macrophages is still unknown and is important to take into account when designing vaccination strategies. Concluding, our data show that SBAs induce cross-presentation in BMDMs leading to CD8+ T cell activation. Understanding the mechanisms of SBAs will stimulate the development of new and improved vaccines enhancing cross-presentation and CD8+ T cell immunity.
Methods
Mice
Wildtype C57Bl/6J 6–16 week old mice were purchased from Charles River Germany and femur and tibia were used for the culture of bone marrow-derived dendritic cells (BMDCs) and bone marrow-derived macrophages (BMDMs) and spleens and inguinal lymph nodes were used for ISCOM uptake experiments. C57Bl/6 OT-IxCD90.1+ (Thy-1.1) mice were bred and held in house, and the spleen of 8–12 weeks old animals was used for OT-I experiments. All animals used were female, except when a male C57Bl/6 OT-IxCD90.1+ mouse was used for the OT-I assay, to match the sex of the C57Bl/6 OT-IxCD90.1+ mouse. All mice were held under specified pathogen-free conditions in the Central Animal Laboratory (Nijmegen, the Netherlands). All animal experiments were approved by the national (the Netherlands) and local (Radboudumc Nijmegen) Animal Welfare Body, and were performed in accordance with institutional, national and European guidelines. Animals were sacrificed by cervical dislocation and then the femur and tibia, spleen, or lymph nodes were isolated. No experiments were performed on live animals.
Primary cell culture of BMDCs and BMDMs
Bone marrow cells were flushed from the femur and tibia, then filtered using a 100 μm cell strainer (10282631, Corning Falcon). Erythrocyte lysis was performed by resuspending the cell pellet in cold ACK buffer (8.3 g/L NH4Cl, 1 g/L KHCO3, 37.3 mg/L EDTA in MQ, pH 7.2–7.4) for 1 min, after which cells were plated in 10 cm petridishes (633180, Greiner) in complete RPMI medium (RPMI1640 (42401042, Gibco), supplemented with 10% heat-inactivated Fetal Bovine Serum (FBS; F7524, Sigma-Aldrich), 1% UltraGlutamine (BE17-605E/U1, Lonza), 0.1% 2-mercaptoethanol (21985023, Gibco) and 1% PenStrep (15140163, Gibco)). For BMDCs, 3–4 × 10⁶ cells were plated per dish and supplemented with 20 ng/ml recombinant murine GM-CSF (315-03, Peprotech) at the start of the culture and incubated at 37 °C with 5% CO2. For BMDMs, 4 × 10⁶ cells were plated per dish and supplemented with 20 ng/ml recombinant murine M-CSF (315-02, Peprotech) at the start of the culture and incubated at 37 °C with 5% CO2. Additional medium and GM-CSF for BMDCs or M-CSF for BMDMs were supplemented after 3 days and 6 days of culture to get at least 8.75 ng/ml. After 7 days of culture, cells were harvested and used for experiments. For BMDCs the non-adherent cells were used for experiments. For BMDMs the adherent cells were detached with cold 1.5 mM EDTA for 10–20 min at 4 °C and collected, and the rest of the cells (<10%) were detached using a cell scraper and collected, and neutralized with complete RPMI medium, and used for experiments.
Spleen cell isolation
For ISCOM and OVA uptake experiments, the spleen was isolated and filtered using a 100 μm cell strainer (10282631, Corning Falcon). Erythrocyte lysis was performed by resuspending the cell pellet in cold ACK buffer (8.3 g/L NH4Cl, 1 g/L KHCO3, 37.3 mg/L EDTA in MQ, pH 7.2–7.4) for 2 min and cells were then used for experiments.
Lymph node cell isolation
For ISCOM and OVA uptake experiments, inguinal lymph nodes were isolated and mechanically dissociated using needles and then incubated in RPMI medium containing 1 mg/ml collagenase type III (LS004182, Worthington Biochemical) and 30 µg/ml DNAse type I (11284932001, Roche) for 30 min at 37 °C. Lymph node cells were filtered using a mesh filter, 1 mM EDTA was added, and after centrifugation cells were directly used for experiments.
Fluorescent ISCOM labeling
All 9 different lipophilic fluorescent carbocyanine dyes from the Lipophilic Tracer Sampler Kit (L7781, Invitrogen), i.e., DiIC18(3)-DS, SP-DiIC18(3), SP-DiOC18(3), DiIC18(3) (DiI), DiIC18(5) (DiD), DiIC18(7) (DiR), DiOC18(3) (DiO), 4-Di-16-ASP (DiA) and 5,5’-Ph2-DiIC18(3), were reconstituted in DMSO to get a 2.5 mg/ml stock and stored at −20 °C. For ISCOM labeling, 100 μg ISCOMs (ISCOMs Matrix C, MSD) was mixed with 20 μg dye in a volume of 1 ml in PBS, incubated for 2 h at 37 °C to allow ISCOM labeling, and then filtered using a 0.2 μm filter (10462200, Whatman) to filter out crystalized and unbound dye. The absorbance signal of all controls (PBS control, unlabeled ISCOMs, dye control before incubation/filtering, dye control after incubation but without filtering, dye control after filtering, labeled ISCOMs after incubation but without filtering) and labeled ISCOMS after incubation and filtering were measured at 350–750 nm using a UV-Vis spectrometer. Labeled ISCOMs were stored for a maximum of 2 weeks at 4 °C, protected from light. For flow cytometry, ISCOMs labeled with DiIC18(3)-DS (Ex/Em 555/570 nm) and SP-DiIC18(3) (Ex/Em 556/573 nm) were measured in the PE channel, and SP-DiOC18(3)-labeled ISCOMs (Ex/Em 497/513 nm) were measured in the FITC channel.
FACS-sorting
BMDMs were washed with cold FACs buffer, blocked for 10 min at 4 °C using anti-CD16/CD32 antibodies (1:800, clone 2.4G2, 553142, BD) diluted in FACS buffer, stained for CD11c-FITC (1:100, Clone N418, 1186530, Antibodychain), CD11b-APC/Cy7 (1:200, Clone M1/70, 101226, BioLegend) and F4/80-PE/Cy7 (1:75, Clone BM8, 123114, BioLegend) in FACs buffer for 20 min at 4 °C, washed twice with FACS buffer, cells were transferred through a 70 µm filter (340605, BD) and FACS-sorted for CD11b+F4/80+CD11c- BMDMs on the Cytoflex SRT (Beckman Coulter). Gating is shown in Supplementary Fig. 6.
B3Z cross-presentation assays
Cross-presentation assays were performed using B3Z T cells. B3Z cells are CD8+ T cell hybridoma cells with a T cell receptor specific for SIINFEKL-MHC-I (H-2Kb) complexes and a NFAT-LacZ reporter construct leading to β-galactosidase production upon T cell activation in a co-stimulation independent manner56. B3Z cells were cultured in IMDM medium (21980065, Gibco), supplemented with 5% heat-inactivated FBS (F7524-500ML, Gibco), 1% UltraGlutamine (BE17-605E/U1, Lonza), 500 μg/ml Hygromycin B (10687010, Invitrogen), 0.1% 2-mercaptoethanol (21985023, Gibco) and 1% PenStrep (15140163, Gibco) at 37 °C with 5% CO2. B3Z assays were performed in complete RPMI medium. Either 80 × 103 BMDCs or BMDMs were plated per well (U-Shaped-Bottom 96-well plate; 10360691, Corning Costar) and incubated with OVA protein (80 μg/ml, chicken egg ovalbumin protein; LET0028, Lionex) and/or ISCOMs (400 ng/ml, ISCOMs Matrix C, MSD) for 5 h. For the OVA peptide-pulsed cells, 5 ng/ml OVA peptide (SIINFEKL: OVA257-264; AS-60193-5, Anaspec) was added during the last 30 min. The medium was washed away, and 8 × 10⁴ B3Z cells per well were added and incubated for 18 h more. The cross-presentation of OVA protein or passive loading of the OVA peptide leads to SIINFEKL presentation in the MHC-I (H-2Kb) molecule and subsequent β-galactosidase (LacZ) production by the activated B3Z cells, which is detected using 0.15 mM chlorophenolred-h-D-galactopyranoside (220588-250 mg, Sigma-Aldrich), 9 mM MgCl2, 0.125% NP40 and 7.5 mM DTT in PBS, leading to conversion into chlorophenol red and galactose causing a color change, and after 2–6 h incubation at 37 °C the absorbance was measured using a photospectrometer at 595 nm.
ISCOM and OVA uptake assays
For flow cytometry analysis, BMDCs, BMDMs, spleen and lymph node cells were kept at RT after harvesting and were incubated with labeled ISCOMs (400 ng/ml, see ISCOM labeling) or OVA-A488 (1 µg/ml, O34781, Invitrogen) or OVA-A647 (5 µg/ml, O34784, Invitrogen) as indicated for 1 h at 37 °C. When indicated, cells were pre-incubated with 62.5 µM, 125 µM or 250 µM monodansylcadaverine (in DMSO, D4008, Sigma-Aldrich) or 5 µM, 10 µM or 20 µM cytochalasin D (in DMSO, C8273, Sigma-Aldrich) or respective vehicle control (of the highest inhibitor concentration) for 10 min at 37 °C as indicated, and then labeled ISCOMs or OVA were added and incubated for 1 h at 37 °C in the presence of the inhibitors or vehicle control. Cells were washed with cold FACs buffer (0.5% BSA 0.05% sodium azide in PBS) and then Fc receptors were blocked for 10 min at 4 °C using anti-CD16/CD32 antibodies (1:800, clone 2.4G2, 553142, BD) diluted in FACS buffer. BMDCs were stained with MHCII-BV421 (1:800, clone M5/114.15.2, 107632, BioLegend), CD11c-BV510 (1:200, clone N418, 117353, BioLegend) and CD11b-APC/Cy7 (1:400, Clone M1/70, 101226, BioLegend) and BMDMs are stained with F4/80-PE/Cy7 (1:150, Clone BM8, 123114, BioLegend) and CD11b-APC/Cy7 (1:400, Clone M1/70, 101226, BioLegend) in FACs buffer for 20 min at 4 °C, washed, and measured by flow cytometry (BD FACSCanto II). All BMDC analyses were performed after CD11c+ and then MHCIIloCD11bhi or MHCIIhiCD11bint BMDC gating and BMDM analyses were performed after F4/80+CD11b+ BMDM gating as shown in Supplementary Figs. 3a, 4a. Spleen and lymph node cells were stained with B220-BV510 (1:400, Clone RA3-6B2, 103248, BioLegend), CD11c-APC (1:400, Clone N418, 117310, BioLegend), CD11b-APC/Cy7 (1:400, Clone M1/70, 101226, BioLegend) and F4/80-PE/Cy7 (1:150, Clone BM8, 123114, BioLegend) in FACs buffer for 20 min at 4°C, washed, and measured by flow cytometry (BD FACSCanto II). Gating for spleen cells is shown in Fig. 3a.
For confocal analysis, BMDCs and BMDMs were plated with 75 × 103 cells per well on Fibronectin-coated (coated with 20 μg/ml in PBS for 1 h at RT, 11080938001, Roche) Chamber Slides (155409PK, NuncTM Lab-TekTM II). The next day, cells were incubated with labeled ISCOMs (400 ng/ml, see ISCOM labeling) and OVA-A647 (30 µg/ml, O34784, Invitrogen) for 1 h at 37 °C. Chamber slides were washed with PBS, fixed with 4% PFA for 15 min at RT, washed in PBS and stained with DAPI (3 μg/ml, sc-3598, Santa Cruz Biotechnology) in PBS for 10 min at RT. Images were directly acquired (without mounting) on the Leica SP8 SMD confocal laser scanning microscope with the HC PL APO CS2 63x/1.20 WATER objective. Co-localization histograms for both ISCOMs and OVA were created for a selected area (indicated by a line on the image) in Fiji.
Lipid body stainings
BMDCs and BMDMs were plated with 75 × 103 cells per well on Fibronectin-coated (coated with 20 μg/ml in PBS for 1 h at RT, 11080938001, Roche) Chamber Slides (734-2050, NuncTM Lab-TekTM II). When attached, cells were untreated (control) or treated with ISCOMs (400 ng/ml, ISCOMs Matrix C, MSD) or oleic acid (50 μM, O1008, Sigma-Aldrich) and incubated for 5 h in the chamber slides. Chamber slides were washed with PBS, cells were fixed with 4% PFA for 15 min at RT and washed in PBS. Lipid bodies (LBs) were stained with BodipyTM 493/503 (7 μg/ml, D3922, Invitrogen) in PBS for 10 min at RT. Cells were washed and stained with DAPI (3 μg/ml, sc-3598, Santa Cruz Biotechnology) in PBS for 10 min at RT. DAPI was removed and Chamber slides were mounted with ProLongTM Diamond Antifade Mountant (P36961, Invitrogen), dried overnight and temporarily stored at 4 °C. Images were acquired on the Zeiss LSM900 confocal laser scanning microscope with the Plan-Apochromat 63x/Oil DIC M27 objective. Multiple pictures were taken to analyze at least 50 cells per condition. The amount of LBs was determined with a script using the Fiji – ImageJ software.
Antigen translocation assays
BMDCs and BMDMs (100 × 103 cells per well) were plated (U-shaped-bottom 96-wells plate; 10360691, Corning costar) and incubated with or without ISCOMs (400 ng/ml, ISCOMs Matrix C, MSD) and with or without cytochrome c (2.5 mg/ml, C2506, Sigma-Aldrich) as indicated for 5 h at 37 °C with 5% CO2. To measure metabolic activity and viability, cells were washed, then 100 μl new medium and 10 μl Cell Counting Kit-8 reagent (96992, Sigma-Aldrich) were added to each well and after 1–3 h incubation at 37 °C the absorbance was measured using a photospectrometer at 450 nm. The relative metabolic activity and cell viability was calculated as (treatment—blank)/(control—blank) × 100%.
OT-I cross-priming assays
OT-I mice have CD8+CD90.1+ T cells expressing a transgenic T cell receptor specific for OVA peptide (SIINFEKL: OVA257-264) presented in the MHC-I (H-2Kb) molecule. The spleen from OT-I mice was disrupted in 2% FBS in PBS and the cell suspension was passed through a 100 μm cell strainer (10282631, Corning Falcon) to obtain a single cell suspension. CD8+ T cells were isolated by negative selection using the EasySEPTM Mouse CD8+ T Cell Isolation Kit (19853, Stemcell Technologies), according to manufacturer’s instructions. The CD8+ T cells were labeled with 3 μM CFSE for 10 min at RT using the CellTraceTM CFSE Cell Proliferation Kit (C34554, Invitrogen). For the OT-I assay, 25 × 103 BMDCs or BMDMs were plated per well and treated with OVA protein (80 μg/ml, chicken egg ovalbumin protein; LET0028, Lionex) and/or ISCOMs (400 ng/ml, ISCOMs Matrix C, MSD) as indicated for 5 h at 37 °C with 5% CO2. BMDCs or BMDMs were washed and 50 × 103 CFSE-labeled CD8+ OT-I T cells were added (1:2 BMDC/BMDM : T cell ratio) and the co-culture was incubated for 72 h. Non-adherent cells were harvested and washed with FACS buffer (0.5% BSA 0.05% sodium azide in PBS), stained with CD8α-V450 (1:100, Clone 53-6.7, 560469, BD), CD90.1-BV510 (1:200, Clone OX-7, 202535, Biolegend) and CD44-PE/Cy7 (1:600, Clone IM7, 103030, Biolegend) in FACS buffer for 20 min at 4 °C, washed and measured by flow cytometry (Cytoflex LX 21-color, Beckman Coulter). T cell analyses were performed after CD8+ and CD90.1+ gating. After 72 h of co-culture, CD44 and CFSE proliferation were analyzed. Cell-free supernatant after 72 h of co-culture was temporarily stored at −80 °C and IFN-γ levels were measured using the IFN gamma Mouse Uncoated ELISA Kit (88-7314, Invitrogen) according to manufacturer’s instructions.
Statistical analysis
Data visualization and statistical analysis was performed with GraphPad Prism v8.0.1. In all figures, results are expressed as mean values from 3 biological replicates with standard error of the mean (SEM). For ISCOM and OVA uptake (Fig. 1c, d) and for the antigen translocation assay (Fig. 4c, d) two-way ANOVA and Sidak’s multiple comparisons tests were performed. For ISCOM and OVA uptake (Fig. 1e) a two-tailed paired T test was performed. For ISCOM and OVA uptake (Figs. 2a, b, 3b, c), B3Z assays (Fig. 5a) and for T cell activation, proliferation and IFN-γ production (Fig. 5c–e) one-way ANOVA and Tukey’s multiple comparisons test were performed. For ISCOM and OVA uptake (Fig. 2c, d) one-way ANOVA and Dunnet’s multiple comparisons test were performed on the raw gMFI data. For the B3Z assay with unsorted and sorted BMDMs (Fig. 5b) a two-way ANOVA and Sidak’s multiple comparisons test was performed. P ≤ 0.05 were considered significant (alpha of 0.05). Significance is shown as: not significant p > 0.05, *p ≤ 0.05, **p ≤ 0.01, ***p ≤ 0.001, ****p ≤ 0.0001.


Responses