Scaling biocultural initiatives can support nature, food, and culture from summit to sea
Introduction
Nature-based solutions (NBS) are key strategies to achieve Sustainable Development Goals (SDG), biodiversity, and climate goals and targets1. Defined as actions that protect, manage, and restore ecosystems while addressing societal challenges, NBS also provide benefits for human well-being and biodiversity2,3. However, some NBS projects, including large-scale tree planting often fail without community buy-in and attention to local values and political-economic context4. Thus, NBS policies and practice now emphasize the need for equitable, inclusive approaches that incorporate Indigenous and other local community values, goals, and knowledge5,6,7,8. Successful examples, like mangrove conservation in Indonesia, have improved livelihoods, reversed ecosystem loss, and offered climate adaptation benefits9,10.
Biocultural approaches, which emphasize the reciprocal restoration of both ecology and culture11,12, elevate and perpetuate Indigenous and local knowledge and rights, and align with the call for more just and equitable NBS13,14,15. These approaches recognize that biodiversity and ecosystem restoration often depend on the perpetuation of traditional knowledge, practices, and cultural heritage, and that human well-being is linked to the health of the environment. In the Pacific Islands, biocultural approaches to restoration often center on ridge-to-reef frameworks, since Indigenous resource management practices conceptualize land and sea as fundamentally interconnected16,17,18. Pacific Islanders have practiced integrated land-sea management as a continuum with embedded forest protection and food production practices19,20,21. Restoring these systems supports ecoscape restoration by regenerating habitats across land-sea boundaries and providing social, ecological, and cultural benefits16,17,22. Biocultural approaches that restore local food production systems can enhance community health and well-being through increasing supply and access to culturally and nutritionally valuable foods1,17,23. Gathering local food, on land and from the ocean, is essential for the perpetuation of traditional knowledge, as it preserves cultural practices, deepens ecological understanding, and strengthens community connections across generations. Traditional knowledge in the Pacific Islands is rooted in practices like crop diversity, soil replenishment, and rotational fishing grounds, which sustain food security24.
Seafood, or “blue foods,” are vital for global food security25 and the livelihoods of millions26. Across the Indo-Pacific region, fish consumption averages 55–110 kg per person annually, compared to 18 kg globally27. However, seafood’s benefits are unevenly distributed across coastal communities, and assessing the benefits of seafood on a large scale can mask inequalities in the distribution of those benefits28. Increasing reliance on imported foods in the Pacific, such as canned meats and sugary drinks, has worsened malnutrition and disease29. Ensuring access to seafood and affordable options is crucial for sustaining and reviving traditional knowledge and improving health, which can feed back into sustainable ecosystem management.
In tropical and subtropical regions, sheetwash and hillslope erosion drive sediment budgets due to agriculture intensification or fallowing, overgrazed landscapes, and poor road planning, especially in dry areas prone to heavy rainfall30,31. Mitigation is critical in regions with degraded vegetation, high rainfall and steep terrain, such as oceanic islands, which also face fire risk32 and grazing from feral ungulates or livestock, increasing sediment and nutrient flow to coastal waters33,34. Empirical evidence has shown that coastal habitats and fisheries, vital for food security, are threatened by sedimentation, development, overfishing, and climate change through ocean warming and acidification22,35. Ridge-to-reef management studies have demonstrated that land-based stressors vary spatially in their impact on the marine environment36. Because terrestrial and marine processes occur across different temporal and spatial scales, resource management efforts require adaptable interventions for islands to achieve social-ecological benefits across land and sea37,38.
Native Hawaiians (Kanaka ʻŌiwi) traditionally managed their islands from ridge-to-reef through land divisions (Moku subdivided into multiple ahupuaʻa). Mountain tops and associated forests were sacred and rarely accessed (kapu), while mid-watersheds supported gathering and diverse agriculture, including agroforestry, and lower watersheds were used for aquaculture and fishing18,39,40. These systems fostered self-sustaining communities utilizing resources from mountains to sea (mauka to makai). The Moku system embodies ecological wisdom and social cohesion, concepts that remain relevant in modern discussions about sustainable resource management and cultural preservation in Hawaiʻi39. European contact, beginning in 1778, colonization, and subsequent political-economic changes and introduced diseases led to Kanaka ‘Ōiwi population decline, land dispossession, and the break-down of the Moku system39,41. Following large-scale land privatization in the mid-1800s, sugar and pineapple plantations became dominant in Hawaiʻi. Today, much of the former plantation land is unmanaged, partly due to shifting economic forces, which has left nearly 40% of the state’s agricultural land fallow and dominated by non-native and invasive species42,43. In many areas, these unmanaged lands have become increasingly prone to erosion with the proliferation of non-native ungulates including goats (Capra hircus) and axis deer (Axis axis). At the same time, the fuel from unmanaged grasslands, in particular, pose an increasing fire risk, as seen in the devastating 2023 Maui fires44,32. Bare soil from fire or over-grazing is then susceptible to runoff during heavy rain events, increasing sediment runoff impacts to marine ecosystems and societal benefits. Biocultural restoration that enhances sustainable food production while recognizing land-sea linkages is urgently needed.
Increasing calls and efforts to include biocultural restoration alongside native forest protection make Hawaiʻi a valuable case study for ridge-to-reef NBS. In 2015, the state committed to localized SDGs, including doubling local food production by 2030, protecting 30% of watersheds, developing a green workforce, and restoring community connections to place12,45. Accomplishing these goals requires uplifting biocultural restoration46,47. In high-elevation conservation areas (Wao Akua), watershed partnerships work to protect native forests, which have high ecological, hydrological, and biocultural value48. In some high-elevation areas, multi-generational ranchers integrate native trees into pastures (i.e., silvopasture) to diversify ranching livelihoods while sustaining paniolo (local ranching) culture and support diverse societal benefits49. In mid-elevations (Wao Kānaka), KanakaʻŌiwi, and Kamaʻāina (of Hawaiʻi) farmers and organizations are restoring land through Indigenous informed multi-strata agroforestry systems, integrating woody plants and crops, that were once abundant in Hawaiʻi50,51,52,53. Biocultural marine restoration focuses on revitalizing traditional Hawaiian resource management systems and nearshore food abundance through practices like Community-Based Subsistence Fishing Areas (CBSFAs) and resting periods (Kapu days).
Examples of integrated spatial assessments of watershed management’s impact on marine societal benefits are sparse22,35 and often focus only on supply and biophysical metrics54,55,56, overlooking the spatial variability in how people use and value these benefits. This limits our ability to evaluate investments and management priorities, coordinate across resource-managing entities, and reveal trade-offs amongst beneficiaries and ecosystems17,49,57. Quantifying potential ridge-to-reef management benefits can attract financial support and community buy-in. In response, we assessed how combining existing native forest protection with transitions to agroforestry and silvopasture could benefit blue food production by increasing sediment retention across the Hawaiian archipelago. We addressed two questions: (Q1) Where do existing and planned native forest protection safeguard fisheries and seafood production through sediment retention? (Q2) How does scaling biocultural restoration on fallow agriculture and high-elevation pastureland through agroforestry add value to forest protection by boosting societal benefits from land to sea?
To address these questions, we created scenarios of biocultural forest restoration, including native forest protection and transitions to agroforestry. To quantify the benefits of native forest protection, we modeled forest loss with and without conservation action (i.e., fencing to remove invasive species and fire risk) in partnership with the State of Hawaiʻi Department of Land and Natural Resources, Hawaiʻi’s Division of Forestry and Wildlife (DOFAW). For biocultural restoration on fallow agricultural lands, we drew on results of a statewide study of the motivations for and challenges to land use transitions to agroforestry in Hawaiʻi53. In the study, interviews with agroforestry practitioners across Hawaiʻi, 50% of whom were Native Hawaiian, revealed that transitions to agroforestry most often occurred when practitioners gained access to former plantations lands, with practitioners primarily being motivated by their desire to restore relationships to ʻāina (land), ancestors, and culture; strengthen local communities; and “reverse the damage of plantation agriculture and ranching”53. We modeled where these systems are feasible today, based on land zoning, elevation, rainfall, and traditional agroforestry models50. While there are many silvopasture options, we modeled a silvopasture system in high-elevation pastureland incorporating koa (Acacia koa), a native, culturally, and economically valuable timber tree, currently being implemented in pasture (>~915 m) in Hawaiʻi to diversify income streams and increase societal benefits. We expanded a spatially explicit land-sea modeling framework22 by nesting a novel yet simple blue food production model (Methods). Then we modeled the benefits of forest protection alone and combined with transitions to agroforestry on blue food production through changes in sediment retention and coastal Total Suspended Sediment (TSS). Our approach reveals locations where biocultural forest restoration NBS, can support island resilience and help meet SDG goals.
Results
Benefits from existing and planned forest protection throughout land and sea
Through collaboration with DOFAW, we mapped and modeled how existing and planned conservation fences protect existing native forests from fire risk, non-native ungulates (pigs, deer, goats), and the related expansion of non-native vegetation (Fig. 1a, Methods, Supplementary Fig 1). As a counterfactual, we ran a 30-year simulation of non-native forest and non-native grassland invasion based on observed expansion rates to estimate land cover change without protected areas (Methods). Using our expanded land-sea framework22, we tracked the effect of these watershed interventions on sediment retention, TSS, fisheries catch, and blue food production (Fig. 1). Forest protection efforts (fencing, ungulate removal, fire protection) help safeguard 400 km2 (13%) of existing native forest and biodiversity across the state, including the potential to reduce fire-driven forest loss by 50% (Methods, Supplementary Figs 1 and 2).
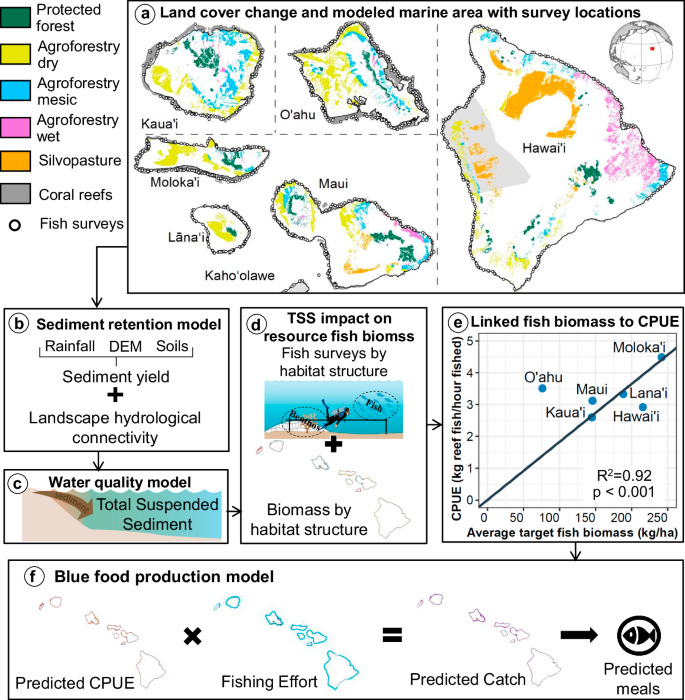
a Land cover maps showing the areas where watershed interventions are feasible given biophysical and zoning opportunities and constraints, including projected native forest protection within existing and planned fenced areas (forest green = native forest within protected areas) and potential agroforest transition areas (yellow = dry multi-strata agroforest; blue = mesic multi-strata agroforest; pink = wet multi strata agroforest; orange = koa silvopasture) coupled with the modeled coral reef habitat area (grey) with survey locations used to parameterize the blue food model. The light grey represents the land areas that were not modeled due to no land use cover change (Kahoʻolawe) and minimal surface runoff (West Hawaiʻi). b Sediment retention model, which incorporates rainfall, Digital Elevation Model (DEM), and soil characteristics, and land cover information to compute the annual sediment loads retained by vegetation and reaching the ocean (t/year). c A water quality model diffuses the change in annual sediment loads from the sediment retention model into the marine environment (Total Suspended Sediment [TSS]) as a function of wave energy, currents, and distance from river mouths. d The reef fish surveys are summarized by habitat type at the island scale to obtain the fish standing stock (g/m2) as a function of change in TSS. e The average fish standing stock by island is linked to the Standardized CPUE using a regression model (Supplementary Fig. 3). f The regression model is then used to predict CPUE at the reef pixel level and multiplied with total fishing effort to obtain total reef fish catch (kg by island) and number of seafood meals under different levels of watershed management.
Forest protection efforts are projected to retain almost 3500 tonnes of sediment annually across the island chain, with Maui and Oʻahu benefiting the most from these interventions (Fig. 2a). Consequently, this helps maintain marine water quality and safeguard nearly 3000 kg of annual fish catch, equivalent to ~11,700 seafood meals annually (Fig. 2b). Sediment retention per unit area of forest protection is the highest on Oʻahu followed by Maui (Fig. 2c). Seafood production per unit area of forest protection is the highest on Oʻahu followed by Hawaiʻi (Fig. 2d).
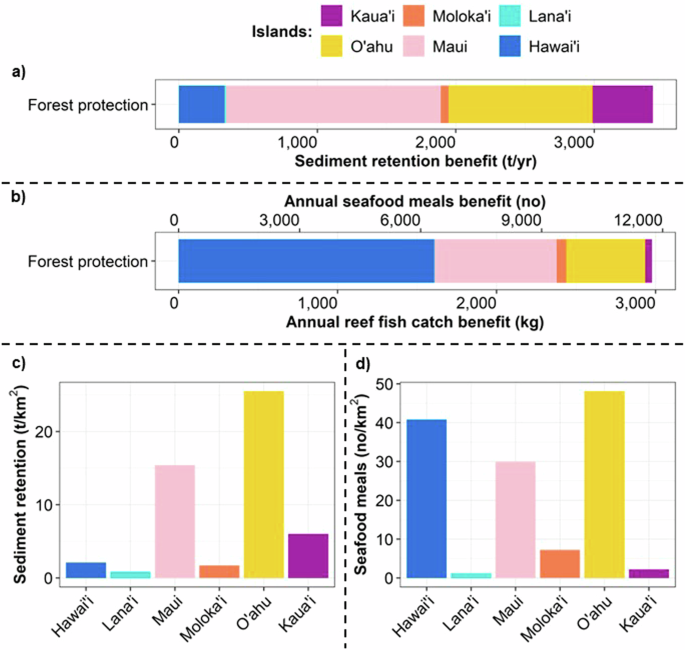
Forest protection provides (a) annual sediment retention benefits (t/year) and (b) annual reef fish catch (kg/year) and seafood meals (number/year) by island, with (c) sediment retention benefits (t/year/km2) and (d) seafood meals per unit area of forest protection by island.
Spatially, the watersheds with higher sediment retention benefits correspond to the windward sides of the islands, where rainfall is abundant combined with areas with older substrate ages, such as the north shore of Kauaʻi, Central Oʻahu, and East Maui (Fig. 3). Some key areas on the leeward side of the islands also benefit from forest protection, including West Kauaʻi, South Oʻahu, and West Maui, areas where losing native forest could result in increased sediment export (Fig. 3). Consequently, native forest protection helps safeguard seafood production on both the leeward and windward side of the older islands, with the greatest benefits (up to 1800 kg/year in catch equivalent to 7100 meals/year) along East Hawaiʻi, followed by up to 380 kg/year in catch equivalent to 1500 meals/year on north shore Oʻahu, West and East Maui (Fig. 3, Supplementary Table 1).
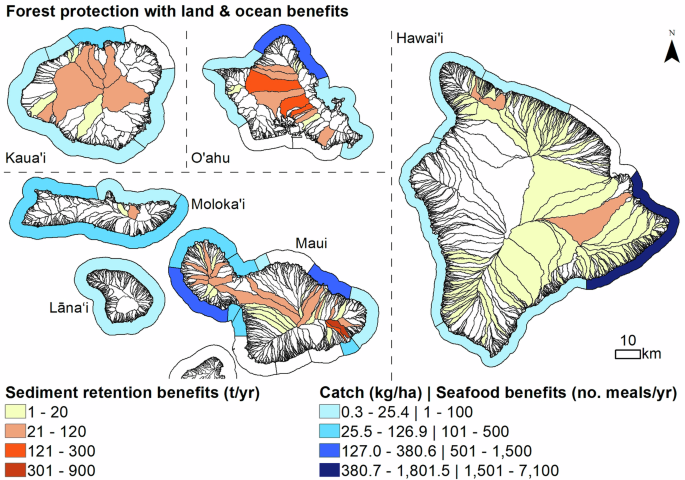
Spatial variation in sediment retention (t/year) benefit by watershed and fisheries catch (kg/year) and seafood meals (number/year) benefits by moku provided by forest protection.
Added benefits throughout land and sea from transitioning fallow agricultural land to agroforestry
Through interviews with agroforestry practitioners53, we identified two main agroforestry transitions: multi-strata agroforestry and silvopasture. First, ʻŌiwi (Native Hawaiian), local organizations, and farmers are converting fallow agricultural lands into multi-strata agroforestry, using a mix of understory, midstory, and canopy native and non-native, culturally important plants that are tended and harvested53,58. We modeled where these transitions were possible based on land zoning and land use (fallow-zoned agricultural land and conservation land dominated by non-native species), elevation, rainfall, slope, and previous modeling of historical Native Hawaiian agriculture50,58 (Methods). We identified about 1650 km2 of suitable land for 354 km2 of wet, 421 km2 of mesic, and 875 km2 of dry agroforestry (Supplementary Fig 2). Second, ranchers are planting koa (Acacia koa) in high elevation pasture (>914 m), where there is less disease risk for koa from koa wilt (Fusarium oxysporum), to diversify income streams and increase societal benefits49. We identified 800 km2 of pasture suitable for high-elevation koa silvopasture (Methods, Supplementary Figs. 1 and 2).
Our land-sea models revealed that combining forest protection with agroforestry (including multi-strata and silvopasture) can increase annual sediment retention by 53,000 tonnes (30%) (Fig. 4a). The sediment retention benefits from transitions to agroforestry can increase annual fish catch by ~110,000 kg (10%), equivalent to 420,000 seafood meals per year (Fig. 4b). Sediment retention per unit area of agroforestry transitions is the highest on Oʻahu followed by Kauaʻi (Fig. 4c). Seafood production per unit area of agroforestry transitions is the highest on Maui followed by Oʻahu (Fig. 4d). This is partly due to East Maui supporting healthier fish stocks given lower fishing pressure (Supplementary Fig 4).
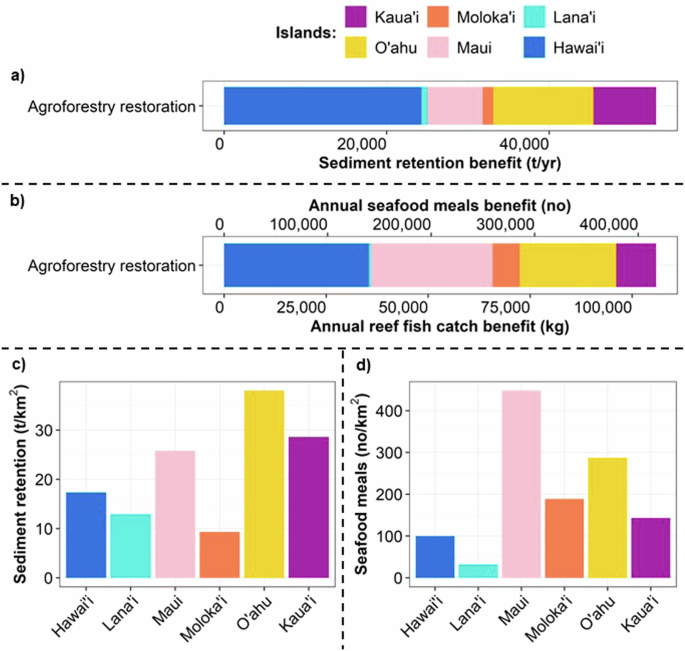
Agroforestry restoration provides (a) annual sediment retention benefits (t/year) and (b) annual reef fish catch (kg/year) and seafood meals (number/year) by island, with (c) sediment retention benefits (t/year/km2) and (d) seafood meals per unit area of agroforestry restoration by island.
Sediment retention benefits are found throughout all the islands with the largest benefits in areas where multi-strata agroforestry is restored on un-managed non-native grassland areas, primarily West Kauaʻi and Oʻahu and East Hawaiʻi (Fig. 5). The primary exception is the central part of West Hawaiʻi where there is no surface water flow. Consequently, agroforestry has the potential to increase blue food production around all the islands and by up to 24,000 kg in catch or 95,000 meals annually in West Kauaʻi and East Hawaiʻi as well as West Maui and leeward Molokaʻi (Fig. 5). In addition, blue food production is increased by up to 600 kg in catch or 24,000 meals around Oʻahu and in North Maui (Fig. 5, Supplementary Table 1).
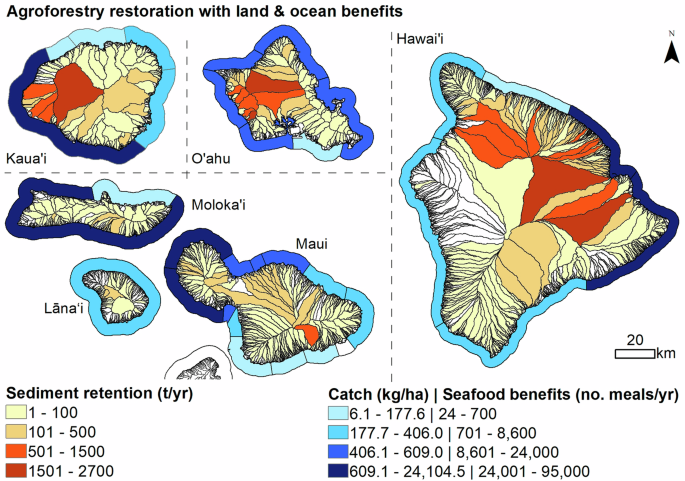
Spatial variation in sediment retention (t/year) benefit by watershed and fisheries catch (kg/year) and seafood meals (number/year) benefits by moku provided by agroforestry restoration.
Discussion
Our land-sea assessment of biocultural NBS for watersheds can help inform the design of equitable and effective NBS to build island resiliency while advancing Hawaiʻi’s 30×30 and SDG goals. Building on prior spatial watershed assessments linking land and sea health22,54,55, we extended them to illustrate the value of biocultural forest restoration on oceanic islands. Our methodology coupled a novel blue food habitat-based production model with a land-sea modeling framework to investigate the social-ecological benefits of multiple land stewardship scenarios. Combining forest protection in upper watersheds (Wao Akua) with transitions to agroforestry in mid-elevations (Wao Kānaka) is essential to secure native biodiversity and restore culturally important species, food sovereignty, and multiple biocultural values. We found that biocultural forest restoration from summit to sea can, on average, enhance blue food production by 10% through increasing sediment retention by 30% at the archipelago scale. By quantifying these societal benefits spatially, we identified areas where prioritizing investments and resources can generate greater benefits and could be the focus of further investigation. For instance, East Kauaʻi, South shore of Molokaʻi, West Maui, and East Hawaiʻi are places with high land-sea benefits where annual catch has the potential to increase by up to 600–24,100 kg with biocultural forest restoration. Our research highlights how restoring biocultural approaches can provide multiple wins for local communities, through food production and natural ecosystem health from summit to sea.
Most watershed management efforts currently focus on biodiversity and groundwater recharge in relatively intact upper elevation areas (Wao Akua) where invasive species are the primary threat to Hawaiʻi’s native and endemic species59,60. Our analysis shows that current and planned fencing can protect 400 km2 (13%) of native habitat on mountain ridges, enhancing sediment retention and blue food production, particularly on Maui and Oʻahu. On Oʻahu, key watersheds for sediment retention discharge in Pearl Harbor, an important fishing ground but largely inaccessible due to military control (Fig. 2a). Previous studies show that protecting forests through from high-water-use invasive canopy species protects groundwater recharge48, maintains forest canopy integrity which reduces fire risk61,62, and support biodiversity63,64.
The middle-elevation lands (Wao Kānaka) receive less conservation focus than either higher forests or marine areas, but our analysis reveals that agroforestry transitions offer meaningful social-ecological benefits and a powerful pathway to ecoscape restoration. Converting fallow grasslands to multi-strata agroforestry can enhance sediment retention, increase local food production, and provide culturally important resources, like medicinal plants and materials for ceremonies. Those land-sea benefits are particularly notable on the leeward side of the older islands (Kauaʻi, Molokaʻi, and Maui), all around Oʻahu, and on the windward side of Hawaiʻi, likely due to larger sediment retention rates from converting grasslands to multi-strata agroforestry. Multistoried cropping and pasture systems help with fire mitigation53 and may offer carbon finance benefits58. Transitions to agroforestry conserve biodiversity through a mix of native and culturally important plant species that can support other native organisms65, without impacting current crop or livestock production, since our modeling limited agroforestry transitions to fallow lands and silvopasture areas where grazing could continue. Our results highlight the need to elevate community-led efforts to restore middle-elevation forests through transitions to agroforestry for island resilience and local food sovereignty and security50.
Building on studies on sediment impacts on coral reef fisheries and their importance to Hawai’i’s food security66,67,68,69,70,71, we show that watershed restoration across the Hawaiian Islands can boost coral reef fisheries in some regions by up to 60%, providing thousands of additional seafood meals annually (Supplementary Table 1). Our innovative blue food production model can be integrated into a land-sea framework to inform watershed management or be used independently to assess and guide nearshore fisheries management, even in data-poor regions. Nearshore fisheries are vital for global subsistence and yet methods to value them are lacking or limited to data-rich species-specific fisheries. This approach enables mapping, quantifying, and valuing blue foods using available data on effort, catch-per-unit effort, and habitat maps that are typically available for tropical environments.
Equally important, protecting habitats and restoring Indigenous food systems offer biocultural benefits, including perpetuating knowledge and practices (ʻIke), social networks (Pilina), spirituality (Mana), and well-being (Ola Mau)46. Silvopasture can sustain paniolo (local ranching) culture while restoring biodiversity, sediment retention, and providing financial returns49. Healthy resources, like nearshore fishes and cultural crops, enable traditional practices to be passed down through generations. In the Pacific, producing and sharing local food strengthens social networks70,72,73,74. Other studies found that food systems can also increase people’s resilience in the face of market shocks, like COVID-19, through increasing food access and security when supply chains break down and borders close75. Agroforestry and local fisheries provide benefits that extend beyond where the food is gathered and provide opportunities for that perpetuation.
Modeling involves simplifying assumptions and working with data limitations. One key challenge is linking static models to dynamic management scenarios, as watershed interventions may take 10–30 years to fully function as sediment traps48 and benefit nearshore ecosystems and seafood production76 (Methods). There is also a need for empirical measurements of erosion under the various land covers modeled in this study as, due to a paucity of local data, we used available information from other locations to parameterize the sediment model. We did not measure the benefits of sediment retention on benthic habitats, which can create more positive outcomes for fisheries76,77. The sediment retention and blue food production models simplify complex ecological and social processes (Methods). Although we did not validate the InVEST SDR model in this study, it has been validated for Hawaiʻi in previous research78. We minimized uncertainty by validating fish biomass with reef survey data79 and scaling catch values by island to align with empirical catch data69 (Methods). We report marginal changes and relative spatial differences, rather than absolute modeled values, which are recommended when InVEST SDR is not validated80. These results are a ‘screening’ tool, requiring further investigation and empirical studies to inform the design and implementation of NBS22.
For the decision-maker community, accounting for these sources of uncertainty and implications on management outcomes is important when communicating these results. For the scientific community, our methodology calls for more frequent land use and benthic habitat health mapping, better attribution of management interventions to ecosystem dynamics, and open access research and empirical data sharing. This will help integrated tools like this to be able to reflect the latest conditions of the resources, predict land-sea management outcomes more accurately, center people’s values, and promote holistic management. Advancing research on mapping beneficiaries of ecosystem benefits and empirical studies on how change in marine water quality impacts fisheries is key to more accurately predicting the outcomes of land-sea management.
The spatial insights generated across the entire group of islands (pae ʻāina) can help large landowners and agencies that have responsibility (kuleana) at landscape scales prioritize watershed interventions. Currently, DOFAW’s 30×30 initiative focuses on fencing priority watersheds (mauka), while the Department of Aquatic Resources’ Holomua Marine Initiative manages nearshore resources. Our findings can inform the Holomua Marine Initiative by modeling mauka interventions, and addressing gaps in current approaches. For instance, Hawaiʻi Monitoring and Reporting Collaborative (HIMARC), who provide scientific support to Holomua, use land-based pollution models (like nutrients from cesspools) but do not account for marine outcomes from watershed actions, which is often what communities call for. Incorporating land-sea processes in 30 × 30 and resilience planning will provide a clearer understanding of how sediment impacts marine environments, which have not explicitly been considered in Hawaiʻi and across the Pacific. This study can foster collaboration among agencies and landowners to unify land and ocean care, supporting island resilience equitably via biodiversity, food production, and biocultural benefits.
Mobilizing resources to prioritize transitions to agroforestry in Hawaiʻi offers a triple win for people, nature, and culture; however, large-scale investment in these transitions is lacking. Many agroforestry efforts are small-scale and rely on their ability to self-fund, write grants, and recruit volunteer and in-kind donations to be economically viable53. Yet, agroforestry has more revenue potential than forest protection alone and could create over 165,000 green jobs, assuming one full-time employee per hectare (Noʻeau Peralto PhD, personal communication, May 15, 2024) and 1650 km2 of agroforestry restored. This value does not account for the large numbers of volunteer hours spent at existing sites, which could greatly increase this number (Noʻeau Peralto, PhD, personal communication, May 15, 2024) and highlights that people value caring for the land. Many rural communities on islands are losing their workforce as youth seek job opportunities elsewhere, in industries such as tourism, which can be volatile as shown by COVID-1981. Investing in biocultural forest restoration can create a green workforce dedicated to nurturing nature and generate positive externalities like fisheries and higher water quality for recreation. Financial support, including through public and private financing, is essential to sustain these societal interventions.
Future climate projections for Hawaiʻi show rising temperatures82 and more extreme rainfall, leading to increased wildfire risk61 and sediment runoff. Fallow agricultural lands are near urban areas and pose an unprecedented fire risk83 as shown by the devastating 2023 Maui fires. Land use changes have a greater impact on fire risk than climate change83, suggesting that transitions from fallow agricultural land to agroforestry may be a key opportunity for enhancing public safety. On the marine side, local fisheries management is just as crucial for seafood production as climate change in island contexts84,85. Without improved management, Hawaiʻi’s growing population could reduce local coral reef systems’ ability to meet seafood demand by 40%67. Given that reefs currently contribute 7 million meals annually68, it is pivotal to identify more resource management measures that could enhance this food source (and explicitly link agroforestry footprints to food production). To this end, we used island-specific catch-per-unit-effort (CPUE) scaled to coral reef habitats, and fish biomass, and modeled sediment projections to estimate reef fish catches under different watershed management scenarios.
Our results suggest that biocultural NBS, rooted in local culture, can co-produce social-ecological benefits and help us thrive amidst change. There are, however, key barriers that must be overcome to facilitate the biocultural transitions outlined in this paper. Achieving resilient Indigenous food systems and land care will require political and economic shifts to remove barriers that marginalize Pacific Islanders and other local communities from engaging in land care. Amplifying and (re) valuing Indigenous principles like kinship, relationship to land, and reciprocity through public and private investments necessary to support these transitions will require substantial increases in existing funds for land management. Future work will usefully explore the economic resources needed to support these transitions and explore practical ways to fund these transitions given the broad societal benefits they provide. Restoring land-sea connectivity, integrating Indigenous knowledge, and securing financial support for these interventions can build resilience, meet SDGs, and address climate challenges.
Methods
Modeling approach
Our approach to quantify the societal benefits provided by combining native forest protection with the restoration of multiple habitats to multi-strata agroforestry from summit-to-sea consists of four key components: (1) land cover transition scenarios (Supplementary Fig. 1), (2) the open source InVEST Sediment Delivery Ratio (SDR) (version 3.14.1)86 to quantify the change in sediment export to the coast based on topography, soil erodibility, and rainfall erosivity (Supplementary Table 3), (3) a marine water quality model incorporating wave energy and currents to estimate TSS55 (Supplementary Table 3), and (4) a blue food production model combining fishing effort71,87, CPUE69, benthic habitat structure88, and fish surveys79. We conducted this workflow on each land stewardship transition independently and then computed the relative change in societal benefits.
Land stewardship design
The land stewardship strategies illustrate a mid-century timeline (30 years from now) without predicted rainfall change under climate change. See Supplementary Table 3 for all data sources.
Constant land cover types
The 2015 Carbon Assessment Hawaiʻi Land Cover Map (CAH)89 was chosen as the most updated land cover map that integrated components from previous land cover and land use mapping efforts with LANDSAT TM imagery at 30 m × 30-meter resolution, resulting in 48 detailed land cover units. This base map provides detailed attention to vegetated areas, describing general species assemblages in forests, shrublands, wetlands, and grasslands across the state. Descriptors of urban or agricultural lands are less detailed, encouraging use with the Hawaiʻi Statewide Agricultural Land Use Baseline layer (ALUB)90. The ALUB was created to show contemporary commercial agricultural land use activity across the state, made using WorldView-2 satellite imagery (2011–2013). Aerial analysis was combined with State and County datasets including County Real Property Tax and Agriculture. Water Use data. Combined, these state-wide datasets provide detailed data on both vegetation classification as well as increased understanding of how these areas are used. For example, CAH allows us to see the array of vegetation on a parcel while ALUB allows us to understand land cover in use. So we combined both layers using ArcGIS 10.8.291. Finally, to ensure that we didn’t overestimate sediment erosion in the younger islands, we overwrote vegetation types with the spatial extent of the lava rock from the 2020 land fire cover map92.
Forest protection land cover transition
DOFAW provided a GIS shapefile showing the location of existing and proposed fenced units. In the first scenario, we assumed no reduction in fire-driven forest loss and unrestricted spread of non-native forests at a 2% annual rate of expansion48. We compared this to a scenario that includes existing and planned fencing in the next 30 years, where we assumed that non-native forests does not spread into the protected areas and there is a 50% reduction in fire-driven forest loss within protected areas. Where non-native species do not spread and fire-driven forest loss does not occur, we assumed no change from the baseline conditions. Last, we computed the area (km2) of native forest that gets protected by those fences by the island.
Multi-strata agroforestry land cover transition
We developed a multi-strata agroforestry transition suitable for dry (550–1500 mm/yr), mesic (1500–3000 mm/yr), and wet (>3000 mm/yr) rainfall zones based on interviews with agroforestry practitioners from 30 sites in Hawaiʻi53,58. Multi-strata agroforestry systems in Hawaiʻi are site-specific and diverse relative to other agriculture in Hawaiʻi; they include both native and non-native, culturally important understory, mid-story, and canopy plants integrated together in mixed systems of over 10 species per site58. We identified the average annual rainfall of each site based on their location on the Hawaiʻi Rainfall Atlas93 and categorized sites as dry, mesic, and wet systems according to the rainfall zones in Price & Jacobi94.
While each multi-strata agroforestry system has a unique and diverse mix of species, some common species of dry systems include koa (Acacia koa, native), ʻulu (Artocarpus altilis, canoe plant), citrus trees (Citrus sp.), and cacao (Theobroma cacao) with native understory plants like ‘ipu (Lagenaria siceraria, native), ʻuhaloa (Waltheria indica, native), and ʻilima (Sida fallax, native), sweet Potato (Ipomoea batatas, canoe plant), and Cassava (Manihot esculenta)53. Mesic systems often include ‘ulu, koa, niu (Cocos nucifera, canoe plant), Papaya (Carica papaya), Avocado (Persea americana), Mango (Mangifera indica), Citrus trees, and mai’a (Musa sp., canoe plant) with culturally important plants like māmaki (Pipturus albidus, endemic), kalo (Colocasia esculenta, canoe plant), Ginger (Zingiber officinale), and ti (Cordyline fruticosa, canoe plant) in the mid- and understory53,65. Wet systems frequently incorporate ʻōhiʻa (Metrosideros polymorpha, endemic) and kukui (Aleurites moluccanus, canoe plant) in the overstory with ʻŌlena (Curcuma longa), māmaki and ʻawa (Piper methysticum, canoe plant) in the mid- and understory53,95. Based on the characteristics of transitions described in the interviews and practitioners’ common motivations of biocultural restoration, we assumed that multi-strata agroforestry transitions could occur on environmentally feasible land that was either: (1) zoned agriculture, but not used currently for agriculture (i.e., fallow or unmanaged); (2) zoned conservation, but considered low priority given a dominance of non-native species; (3) zoned urban, but undeveloped.
To determine unmanaged or fallow agricultural lands, we used a combination of the 2020 State of Hawaiʻi Agricultural Baseline90, which identified areas in active agricultural production, and state land use district boundaries map, which delimits agricultural zoned land96. Those lands zoned agriculture, but were not in production in 2020 were considered unmanaged agricultural lands. Within these areas, we excluded any areas classified as developed or as native vegetation in the CAH land cover map89 and young lava flows92. Following the Kurashima et al.50 spatial models of colluvial agriculture (agroforestry) systems, we constrained the scenarios from sea level to 855 meters in line with crop growth restrictions and excluded areas with slopes over 30 degrees. We assumed multi-strata agroforestry would not occur in areas with less than 550 mm rainfall per year, since long-term irrigation is often cost-prohibitive for agroforestry practitioners50. In addition to fallow agricultural lands, we also considered undeveloped urban and rural zoned areas as well as non-native dominated conservation zoned lands, which overlap with projections of suitable area for historical Indigenous colluvial agriculture (agroforestry)50. This aligns with several examples of agroforestry transitions on conservation lands dominated by invasive species53, and on urban, but not developed lands.
Silvopasture land cover transition
We combined the multi-strata agroforestry land use transition with a transition from ranching to silvopasture, another form of agroforestry that integrates trees into pastureland. We discussed and co-developed the silvopasture system with several ranches and a state department, which manages ranch land. In particular, one ranch is developing a high elevation (>914 m; 3000 ft) silvopasture system that integrates the native tree koa (Acacia koa) with cattle and is considered a model by some other ranches. The goals of this work are to maintain the cultural practice of ranching while also producing revenue from koa harvesting over a 40-year time horizon and enhancing societal benefits of rangelands49, including by increasing carbon storage and augmenting fog interception. We focus on this silvopasture system because it has the potential for large-scale implementation and a wide range of desired co-benefits.
Spatially, silvopasture was considered feasible only on existing pasture lands and alien grasslands located in agriculture zones above 914 m (3000 ft) with rainfall of at least 550 mm. Due to the elevation restriction, silvopasture is only feasible on Maui and Hawaiʻi Island and because research and development of wilt-resistant genotypes for lower elevations is still ongoing. In addition, we only focused on areas where growing Koa is suitable97.
To determine the sediment erosion factor, we assumed that a 66% tree cover per hectare approximately corresponds to 16 trees per hectare. This assumption was based on information provided by a ranch, corroborated by USDA, where mature koa, can account for 70% of crown cover, and reach heights of 20 m in 40 years, with crown widths of >20 m. With Koa corresponding to mesic native forest type, we did a weighted average of erosion factors for native mesic forest (66%) and 34% of pasture (Supplementary Table 4).
Land-sea modeling framework and sub-ecosystem services models
We adapted an existing land-sea modeling framework developed to prioritize wastewater management in Hawaiʻi and forest management in Fiji in order to promote coral reefs habitat health and targeted fish biomass benefits54,98. This framework was then scaled to the archipelago of Vanuatu55 and the Mesoamerican Reef region to inform the design of watershed-based NBS that can support coastal and marine societal benefits22.
Using this land-sea framework, we mapped and quantified when feasible the effects of native forest protection and agroforestry transitions on four social-ecological benefits from summit to sea: (1) Native forest protected area (km2, a proxy for biodiversity that we derived from the forest protection land cover transition described above), (2) Agroforestry restored area (km2) for wet, mesic, dry climate region (a proxy for biocultural values), (3) sediment retention (tonnes/year), (4) nearshore fisheries production (kg of catch) and associated blue food production (# of seafood meals).
We report the change in listed metrics above, relative to the status quo (native forest protection). We applied three ecosystem services models to understand the effect of watershed management on blue food production: (1) InVEST Sediment Delivery Ratio model (sediment retention benefit); (2) marine water quality model (TSS loads/year); and (3) habitat-based blue food production model. We used information from interviews with local community members to compute the other societal benefits metrics (ha of agroforestry restorable, # jobs creation potential, biocultural value, and food production).
InVEST Sediment retention model
The Sediment Delivery Ratio model is from the open-source and spatially-explicit suite of InVEST models are designed to map and measure the flow of nature’s benefits to people86. The SDR model incorporates the influence of precipitation, soil properties, topography, and vegetation cover, which can be modified by land stewardship transition option80,86. For each watershed management scenario, the SDR model calculates (1) the annual soil erosion at the pixel scale (30 m) using the Revised Universal Soil Loss Equation (RUSLE) and the ability of downslope vegetation to retain sediment, (2) the sediment delivery ratio (i.e., proportion of soil eroded from a given area) that will travel to the stream mouth at the shoreline, and (3) summarizes the sediment export pixel values at the watershed scale99. The output metric reported for this service is a change in tonnes of sediment retention per watershed per year, relative to the status quo/forest protection. We assumed no sediment runoff for Keauhou, Kealakekua, and Kiholo (West Hawaiʻi) based on the lack of streams and soils in the area100.
To estimate the sediment retention (t.yr-1) and, indirectly, the change in sediment export to the coast by watershed, InVEST SDR model (version 3.14.1)99 operates at the DEM resolution (10 m × 10 m, aggregated to 30 m × 30 m) obtained from USGS101. After testing a range of streamflow accumulation thresholds on the DEM, we selected the following values for each island to delineate stream network and watershed boundaries using ArcHydro: (1) Kauaʻi = 1000, (2) Oʻahu = 3000, (3) Molokaʻi = 2000, (4) Lanaʻi = 2000, (5) Maui = 5000, (6) Hawaiʻi = 5000. The connectivity of SDR and the watershed boundaries were verified by comparing predicted stream pourpoints at the coast to the available DAR stream map and local watershed maps. At the pixel-scale, SDR computes the amount of sediment erosion using the Revised Universal Soil Loss Equation (RUSLE) (Eq. 1)99. The RUSLE equation estimates the overland gross erosion per pixel (see Eq. 1 and Supplementary Table 3 for data sources):
Where (R) = rainfall erosivity factor (MJ.mm.ha-1.hr-1), represent the ability of rainfall to cause erosion and was derived using historical annual precipitation (P)93 and the equation from Bols 1978: R = 2.5 P/[100(0.073 P + 0.73)]102, (K) = soil erodibility factor (tons⋅ha⋅h⋅(ha⋅MJ⋅mm)−1) represent the rate of soil loss per rainfall erosion index unit, obtained from SSURGO database, with no data assumed to be 0.01 and converted to SI by K = [KfactRF] × 0.1317103, ({LS}) = slope-length and gradient factor, (C) = Cover management factors (C-factor) represent the ratio of soil loss for different land cover types compared to the soil loss from well-tilled and continuous fallow land, assuming the same soil, slope, and rainfall conditions104,105 and (P) = Conservation practice factors (P-factors) represent the impact of management practices on soil erosion rates. C-factors and P-factors were assigned to each land cover use type and derived from peer-reviewed and white literature where possible containing comparable land uses and geographies (Supplementary Table 4). SDR uses local topography from the DEM to model sediment transport across the landscape and determine the ratio reaching the shoreline86. Sediment retention is then aggregated at the watershed scale. Although the modeling results were not validated against local datasets for this study, this approach allows us to explore the relative change between management interventions80. We may underestimate sediment retention due to erosion processes not accounted for by SDR, such as landslides and stream bank erosion86. We recommend fieldwork to collect TSS measurements at catchment outlets and compare them to SDR outputs.
When parametrizing SDR on the land cover types we made 4 key assumptions: (1) Canopy is less dense and understory cover is denser in dry forest and shrublands than in their wet counterparts and we ignored the variation in the understory. (2) Most remaining native species are fenced, which results in removal of non-native ungulates, we assumed a denser understory than in invasive species cover types63,64. (3) Mesic forest, shrublands, and grasslands erosion factors are somewhere in between dry and wet but research on those is lacking, so we assumed a weighted average of wet and dry erosion factor values. We note that those values for shrubland and grassland would depend a lot on the management, such as well managed pasture, unmanaged, over-grazed/intensive. (4) Multi-strata agroforestry is similar to natural forests with more people trafficking around for care, so we assumed a little more erosion on those relative to native forests.
Marine water quality model
The sediment model connects to the fisheries model by diffusing the sediment load from all the watersheds into the nearshore waters from a pourpoint for forest protection and agroforestry transitions, separately. The pourpoints along the shoreline are proxies for stream mouths. Using google satellite imagery from 2021 and a local stream map106 to determine their location whenever feasible. To represent the impedance of sediment moving through water from their source, we created a diffusion factor surface layer (c) using the sum of two marine variables rescaled from 0–10 using equal intervals, known to affect sediment diffusion: wave power (kW)107 and currents (m/second)108. The sediment then spread into coastal waters is modeled for each pour point by applying a non-linear decay function over the diffusion factor surface layer pertaining to each watershed until a maximum distance of 1.5–2 km from the shoreline is reached (see Eq. 2) (see Supplementary Table 3 for model inputs data sources):
where ({TSS}) = Total Suspended Sediment per grid cell value (t/yr),(,{s}_{p}) = Sediment load (t/yr) at each pourpoint of watershed i (obtained from SDR InVEST), (c) = diffusion factor surface (unitless) represents the impedance of moving planimetrically through each cell from each pourpoint using a composite of two oceanographic drivers known to affect sediment dispersion: wave power (kW)107 and current (degree and seconds)55,108,109, ({D}_{c}) = diffusion threshold. The distance from the shore for each decayed sediment plume per watershed was set to not exceed 1.7 km from the shoreline. This threshold was based on field studies that tested the influence of land-based source pollutants in Hawaiʻi110,111 and modeled studies87. This model does not account for tidal or longshore transport influence, which may impact the dispersion of TSS along the coastline by over- or under-estimating the TSS deposited on the bottom of the ocean. Future investigations can compare modeled water quality to local observations, satellite imagery, and/or in-situ data available for specific areas.
Blue food production model
We linked the effect of watershed management to fisheries through the impact of total suspended sediment on resource fishes. Fish taxa, identified as important for subsistence and commercial fisheries by local Hawaiian communities (Hāʻena and Kaʻupulehu)98 (resource fishes) and aligned with McCoy et al.69: Acanthuridae (15 spp), Carangidae(4 spp), Fistulariidae (1 spp), Kyphosidae (3 spp), Labridae (6 spp), Lethrinidae (1 spp), Lutjanidae (4 spp), Mullidae (7 spp), Scaridae (8 spp), Serranidae (1 spp) were considered. We modeled total resource fish biomass (kg/ha) as a function of habitat structure and TSS. We derived the empirical resource fish biomass (g/m2) from reef survey data collected by NOAA79, which comprised 1162 survey locations, collected between 2010–2016. We omitted Kahoʻolawe and Niʻihau from the analysis because there was no land use transition due to a lack of climate data93 and no CPUE data69.
We derived the in-situ resource fish biomass by assigning averaged values by habitat strata for each island (with Hawaiʻi split into leeward and windward). We used a subset of 10 NOAA habitat structure classes including a variety of hard-bottom habitats as well as a sand habitat type88. The rubble and mud classes were removed. The ‘unknown’ habitat class was included within 1 km of the shoreline, under the assumption that there are suitable habitats for fishes given the presence of surveys (which normally focus on hard-bottom habitats) but cloud cover and oceanographic conditions precluded habitat mapping using satellite imagery. The empirical fish biomass values from each site were assigned to each habitat strata and averaged. When there was no empirical data available for a stratum, we assigned the value from a similar habitat class (Supplementary Table 4). For instance, for Aggregated Patch Reef and Individual Patch Reef, we used fish biomass values from aggregate reefs. Similarly, for Scattered Coral/Rock, we used values from Rocks/boulders.
A study by Wakawella et al.77 in Palau found that herbivore biomass declined linearly with increasing total sedimentation rate (GAMM, p < 0.001, χ2 = 37.29, d.f. = 2) from a 45.5 g/m2 at low sediment sites to 1.4 g/m2 at high sediment sites, equivalent to a 95% reduction. The study defined high sediment regimes as areas with TSS greater than 21.9 tonnes/ha/year and low sediment regimes as areas with less than 21.9 tonnes/ha/year. Using those breaks, we reclassified the TSS plumes for forest protection and agroforestry transitions and intersected this layer with the nearshore habitat map by island, so portions of each habitat were either exposed to low or high sediment regimes. Then, we decreased the standing fish biomass from transect averaged values by 95% based on the high sediment regime for each land use transition. The shapefiles were then converted into raster grids for the fisheries model (100 m × 100 m).
We fitted a linear regression for average in situ target fish biomass (g/m2) to standardized catch per unit effort (sCPUE) at the island scale69. The sCPUE by island combines the CPUE from all the gear types (boat- and shore-based fishing using line, net, or spear), resulting in the following sCPUE values: Kahoʻolawe and Niʻihau (no data), Kauaʻi (2.6), Oʻahu (3.51), Molokaʻi (4.49), Maui (3.12), Lanaʻi (3.33), Hawaiʻi (2.92). The intercept was set to zero assuming that zero biomass results in zero sCPUE. We then predicted CPUE spatially as a function of standing fish biomass per pixel using this linear regression equation (Supplementary Fig. 4).
We computed the nearshore catch at the pixel level (100 m × 100 m) by multiplying spatially explicit sCPUE with total fishing effort (boat and shoreline fishing for spear, net, and line fishing gears)71 (Supplementary Fig. 4) and summarize the total modeled catch in kg by island. We then derived scaling factors by dividing the total modeled catch by island under the current land cover by the reconstructed total catch from McCoy et al.69. Then we calculated the relative difference in catch for each land cover transition and applied the same scaling factors for each island: Hawaiʻi (7.2), Kauaʻi (6.5), Lanaʻi (3.1), Maui (3), Molokaʻi (3.4), Oʻahu (3.1)
To convert nearshore catch to seafood production, we applied conversion factors derived from interviews with Native Hawaiians from the community of Kīholo, Hawaiʻi on how they prepare fish for cooking to calculate edible weight and meals70. A conversion factor of 0.67 was applied to all the modeled species and the number of meals was calculated from edible weight by using a standard seafood portion size of 0.17 kg (6 oz) derived from interviews with local restaurant owners70. Finally, we summarized the change in catch (kg/year) and seafood meals production (count/year) by Moku (traditional management divisions). To do this, we applied Moku marine boundaries, created by the State of Hawaii Division of Aquatic Resources to group and summarize ridge-to-reef datasets, which are based on the traditional Moku land divisions that extended seaward to reef edges and beyond.


Responses