SEMA7A-mediated juxtacrine stimulation of IGFBP-3 upregulates IL-17RB at pancreatic cancer invasive front
Introduction
Pancreatic ductal adenocarcinoma (PDAC), an aggressive cancer with a high prevalence of metastases, is one of the leading causes of mortality. Metastases begin when primary tumors breach the basement membrane boundaries and invade surrounding tissue. An invasive infiltration pattern at the tumor’s leading edge is highly associated with metastasis and reduced survival [1]. According to spatial transcriptomic studies, tumor cells at the leading edge exhibit upregulation of collagen and epithelial–mesenchymal transition (EMT)-associated genes compared to the tumor cells in the tumor core [2], indicating an invasive phenotype and influence from peripheral host tissue. Since tumor characteristics at the leading edge are a strong indicator of its invasive and metastatic abilities, strategies to regulate the biological behavior of tumor cells at the invasive front warrant further investigation.
Invasion occurs at the tumor–stromal interface, where tumor and microenvironmental cells interact heavily. Within this boundary region, intimate direct cell–cell interactions and the subsequent propagation of the signal generate a highly heterogeneous tumor and normal cells. Therefore, spatial regulation of invasion is probably affected by bidirectional signals exchanged between the tumor and adjacent microenvironment. However, there has been limited research focusing on the role of direct tumor–stromal interactions in tumor invasion.
IL-17RB (interleukin 17 receptor B) is overexpressed in about 40% of pancreatic ductal adenocarcinoma (PDAC) [3]. The autocrine IL-17B/IL-17RB pathway enhances cell motility and cancer stem cell properties, leading to invasion and metastasis [3, 4]. Although the downstream effects of IL-17RB on invasion and metastasis are well documented [3], the upstream regulators responsible for inducing its expression during the metastatic cascade have yet to be identified. In breast cancer, TGF-β secreted by regulatory T cells in the lymph node induces IL-17RB expression [5]. This finding highlights the relevance of the tumor microenvironment to IL-17RB regulation. In the present study, IL-17RB was found to be overexpressed at the tumor invasion front. Because IL-17RB is a key driver of tumor invasion in pancreatic cancer [3], understanding its spatial regulatory mechanism provides insight into how direct cell–cell interactions and juxtacrine-stimulated cytokine secretion collaborate to promote successful invasion.
Tumor-fibroblast interactions directly induce marginal IL-17RB expression, which is associated with poor clinical outcomes. Mechanistically, ATP1A1 (Sodium/potassium-transporting ATPase subunit alpha-1) regulates the surface expression of SEMA7A (Semaphorin-7A). Upregulation of SEMA7A in the plasma membrane subsequently induces IGFBP-3 (Insulin-like growth factor-binding protein 3) secretion from fibroblasts, resulting in a localized gradient. Accumulation of IGFBP-3 boosts IL-17RB expression at the tumor margin, ultimately promoting invasion through SNAI2 regulation. understanding this mechanism opens up novel therapeutic avenues to disrupt the development of an IL-17RB-overexpressing invasive population at the tumor’s leading edge.
Materials and methods
Patient information in the cohort study
Between 2011 and 2015, pancreatic cancer specimens were collected from 44 patients who underwent pancreaticoduodenectomy in NTUH. Based on the 7th edition of the American Joint Committee on Cancer (AJCC) criteria, PDAC patients were staged as IIA (n = 21) and IIB (n = 23) (Supplemental Table 1). Immunohistochemistry (IHC) analysis of marginal IL-17RB was performed on all patient specimens to assess its association with progression-free survival and overall survival.
Laboratory animals
6 to 8-week-old male NOD/SCID/IL2Rγnull (NSG) mice were bred in Academeia Sinica SPF animal facility (Taipei, Taiwan). Mice were maintained in a SPF (specific pathogen-free) animal facility at 20 ± 2 °C with a 12/12 h light/dark cycle and had free access to water and standard laboratory chow diet.
Cell lines
All pancreatic cancer cell lines were purchased from ATCC. Human pancreatic cancer cell lines BxPC-3 and AsPC-1 were cultured in RPMI 1640 medium. Human pancreatic cancer cell line HPAF-II was cultured in MEM medium. Human pancreatic cancer cell line MIA PaCa-2 was cultured in DMEM medium. All the culture medium was supplemented with 10% fetal bovine serum (FBS), 2mM L-glutamine, 1 mM non-essential amino acid (NEAA), 1 mM sodium pyruvate, penicillin and streptomycin (100 IU/mL and 100 μg/mL, respectively). Culture medium of MIA PaCa-2 added an extra 5% horse serum. Human primary pancreatic stellate cells (PSC) and human primary hepatic stellate cells (HSC) were obtained from ScienCell Research Laboratories, inc. Patient-derived pancreatic fibroblasts CAF-1 is a SV40-immoralized cell line obtained from Professor Ching-Shih Chen [6]. Patient-derived pancreatic fibroblasts CAF-2 were isolated from human PDAC specimens and then immortalized via transduction with a lentivirus containing hTERT. Fibroblasts (including PSC, HSC, CAF-1, and CAF-2) were cultured in stellate cells medium (#5301, ScienCell Research Laboratories, USA). For co-culture experiments, both tumor cells and fibroblasts were cultured in DMEM/F12 medium supplemented with 10% FBS, 2mM L-glutamine, 1 mM NEAA, 1 mM sodium pyruvate, penicillin and streptomycin (100 IU/mL and 100 μg/mL, respectively). To assess the effect of activin A or IGFBP-3 on IL-17RB induction, BxPC-3 cells were serum starved (supplemented with 0.1% FBS) during recombinant activin A (#PRO-CYT-145, Prospec) or IGFBP-3 (#CYT-300, Prospec) treatment. The cell lines were regularly checked for mycoplasma infections.
Plasmids and shRNA
The lentiviral expression vectors for labeling cells with Luciferase and mCherry were pHAGE PGK-GFP-IRES-LUC-W (#46793, Addgene) and 7TFC (#24307, Addgene). The cDNA clone of human IL17RB in pCMV6-XL5 was obtained from OriGene. pLAS5w-IL17RB-Flag was constructed by insertion of a 1509-bp fragment of the full-length human IL17RB cDNA (NM_018725.4) and Flag at NheI site and Sbf1 site of pLAS5w.Pbsd-L-tRFP (National RNAi Core Facility, Taiwan) vector. The cDNA clone of human SNAI2 in pcDNA3.1 was a kind gift from Professor Muh-Hwa Yang (National Yang-Ming University, Taiwan). pLAS5w-SNAI2 was constructed by insertion of an 807-bp fragment of the full-length human SNAI2 cDNA (NM_003068.5) at NheI site and EcoRI site of pLAS5w.Pbsd-L-tRFP (National RNAi Core Facility, Taiwan) vector. Primers used for cloning were listed in Supplementary Table 3.
To develop 7TFC-IL17RB-FFluc//SV40-mcherry vector for IL17RB reporter assay, IL17RB promoter (region at -1709/0) was amplified from genomic DNA of BxPC-3 cells and cloned into 7TFC (pCF829: pLenti 7xTcf-Firefly luciferase//SV40-mCherry, #24307, Addgene) vector at AscI and NheI sites. Primers used for IL17RB promoter amplification with restriction enzyme binding sites were 5′-AGGGGGTAAGATCAAAGGGGTTGAGCTTGCAGACGAGGCTGTTTTCATCTGGGC-3′ (forward sequence) and 5′-GTCTAGATCTCGAGCCCGGGCGCCGGGCCACTGCGCGG-3′ (reverse sequence).
The lentiviral shRNA expression vectors of pLKO.1-shALK4, shANXA2, shAPP, shATP1A1, shCD40, shCTLA4, shDPP4, shENG, shFAS, shIL17RB, shITGB1, shITGB2, shITGB3, shITGB6, shITGAV, shNotch1, shSEMA7A, shSMAD2, shSMAD3, shTGFBR2, shTMEM219, and shTREM1 were purchased from the National RNAi Core Facility (Taipei, Taiwan). The negative control was shRNA against β-galactosidase (shLacZ). The target sequences of shRNA were listed in Supplemental Table 4. BxPC3 cells with IL-17RB knockdown were simultaneously infected with three different types of lentiviral shRNA.
Lentiviral shRNA and cDNA were packaged in HEK-293T cells. For lentivirus production, HEK-293T cells were co-transfected with lentiviral vector, packaging plasmid psPAX2, and envelope plasmid pMD2G. Virus-containing supernatant was collected 48 h post transfection. Cells were infected with lentivirus and then selected with 1 ~ 2 μg/mL puromycin.
Immunofluorescence staining in formalin-fixed paraffin-embedded (FFPE) tissue sections
Formalin-fixed paraffin-embedded (FFPE) whole tissue sections (4μm thick) were subjected to immunofluorescence (IF) co-staining. Antigen retrieval was performed on an automated staining system (Bond-max, Leica, UK). After blocking with 5% FBS, slides were incubated with primary antibodies for 4 °C overnight. For co-staining of PanCK and IL-17RB in human PDAC specimens, anti-PanCK antibody (1:200; ab9377, abcam) and anti-IL-17RB antibody (1:500; A81, homemade) were used. For co-staining of SNAI2 or VIM with IL-17RB in human PDAC specimens, anti-SNAI2 antibody (1:30; 9585, Cell Signaling) or anti-vimentin antibody (1:500; 10366-1-AP, Proteintech) and anti-IL-17RB antibody (1:500; A81, homemade) were used. For co-staining of αSMA or CD45 with IL-17RB in human PDAC specimens or xenograft tumors of HPAF-II co-injected with fibroblasts, anti-αSMA antibody (1:200; ab32575, abcam) or anti-CD45 antibody (1:200; ab40763, abcam) and anti-IL-17RB antibody (1:500; A81, homemade) were used. Slides were incubated with secondary antibody (1:100; anti-mouse Alexa 488 and anti-rabbit Alexa 594, Invitrogen) and nucleus were stained with DAPI (or Hoechst 33342). Fluorescent signals were captured by Leica SP8 confocal.
Immunofluorescence (IF) staining of adherent cell cultures
For IF staining of IGFBP-3, PSCs and BxPC-3-mCherry cells were mono-culture, transwell-coculture, or direct-coculture for 2 days. 6 h before fixation, protein transport inhibitor (554724, BD) was added to culture medium. Then, cells were washed with PBS, fixed with 4% paraformaldehyde, and permeabilized with 0.5% TritonX-100. After blocking with 5% FBS, cells were incubated with anti-IGFBP-3 antibody (1:100; MAB305, R&D Systems) for 4°C overnight. After wash with PBST (PBS + 0.1% Tween20), cells were incubated with secondary antibody (1:100; anti-mouse Alexa 488) and nucleus were stained with Hoechst 33342.
For IF staining of αSMA or PanCK in PSC, HSC, CAF-1, and CAF-2, cells were washed with PBS, fixed with 4% paraformaldehyde, and permeabilized with 0.5% TritonX-100. After blocking with 5% FBS, cells were incubated with anti-αSMA antibody (1:200; ab7817, abcam) or anti-PanCK antibody (1:200; ab9377, abcam) for 4°C overnight. After wash with PBST (PBS + 0.1% Tween20), cells were incubated with secondary antibody (1:200; anti-mouse Alexa 488) and nucleus were stained with Hoechst 33342.
For IF co-staining of SEMA7A and ATP1A1, PSCs and BxPC-3-mCherry cells were mono-culture or direct-coculture for 2 days. Cells were washed with PBS and fixed with 4% paraformaldehyde. After blocking with 5% FBS, cells were incubated with anti-SEMA7A antibody (1:30; sc-374432, Santa Cruz Biotechnology) and anti-ATP1A1 antibody (1:100; 14418-1-AP, proteintech) for 4°C overnight. After wash with PBS, cells were incubated with secondary antibody (1:100, anti-mouse 488; 1:200, anti-rabbit Alexa 647) and nucleus were stained with Hoechst 33342. Fluorescent signals were captured by Leica SP8 confocal.
IHC staining and image assessment
The formalin-fixed, paraffin-embedded whole tissue sections (4 μm thick) were processed for IHC studies. IHC for each antigen was performed on an automated staining system (Bond-max, Leica, UK) following manufacturer’s instructions. The sections were counter-stained with hematoxylin. For staining of IL-17RB, anti-IL-17RB antibody (1:500; A81, homemade) was used for human PDAC specimens or xenograft tumors of HPAF-II co-injected with fibroblasts. For staining of SEMA7A, anti-SEMA7A antibody (1:100; sc-374432, Santa Cruz Biotechnology) was used for human PDAC specimens. For the negative controls, the primary antibodies were replaced with normal mouse IgG and normal rabbit IgG. IHC staining of IL-17RB in tumor regions were visually scored by a trained pathologist. IHC score for IL-17RB is 0 to 3 + , including: (1) a score of 0: staining undetectable in tumor cells, (2) a score of 1 + : staining expressed in <10% tumor cells, (3) a score of 2 + : staining expressed in 10 to 50% tumor cells, and (4) a score of 3 + : staining expressed in ≥50% tumor cells. For statistical analyses, the score of 0 and 1+ was combined as the low expression group, and the score of 2+ and 3+ was combined as the high expression group. H score for IL-17RB and SEMA7A were measured by Aperio ImageScope (Aperio, USA) using positive pixel count v9 algorithm. For IL-17RB expression in tumor margin, tumor regions of 0 ~ 20 μm from tumor margins were circled as annotated layers for analysis. H-score was assigned by [1 x (% of weak positive cells) + 2 x (% of positive cells) + 3 x (% of strong positive cells)].
The association between SEMA7A and IGFBP-3 expression was measured in three PDAC patient specimens collected at NTUH. For each case, 10 randomly selected 400x high-power field regions with their corresponding regions in serial sections were stained with SEMA7A (by IHC) and IGFBP-3 (by RNAscope). To measure the expression level of SEMA7A, each 400x high-power field tumoral regions were outlined by pen tools and analyzed by positive pixel count v9 algorithm of Aperio ImageScope software (Aperio, USA) to calculate the average percentage of 1 + , 2 + , and 3+ cells. H-score was assigned by [1 x (% of 1+ cells) + 2 x (% of 2+ cells) + 3 x (% of 3+ cells)]. For the corresponding expression levels of IGFBP-3, number of IGFBP-3 positive and negative nucleus in stromal regions of 0–20 μm from tumor margins were measured, and the percentage of IGFBP-3 positive nucleus was calculated.
RNAscope in situ hybridization
RNAscope in situ hybridization (RNAscope) was performed on FFPE-fixed human PDAC slices according to the manufacturer’s protocol. The signals were amplified and detected with RNAscope® 2.5 Duplex Detection Kit (Chromogenic) (Cat# 322500, ACDBio, USA). The experiment consisted of five hybridization strategies containing: (1) Hs-INHBA-C2 probe (Cat# 415111-C2), (2) Hs-IGFBP3-C2 probe (Cat# 310351-C2), (3) Hs-INHBA-C1 (Cat# 569271) and Hs-IGFBP3-C2 (Cat# 310351-C2) probes, (4) Hs-IL17RB-C1 (Cat# 422021) and Hs-IGFBP3-C2 (Cat# 310351-C2) probes, and (5) Hs-IL17RB-C1 (Cat# 422021) and Hs-INHBA-C2 (Cat# 415111-C2) probes. 2-Plex Negative Control Probe (Cat# 320751) was used as negative control.
Luciferase reporter assay
BxPC-3 cells were transduced with a luciferase reporter 7TFC-IL17RB-FFluc//SV40-mcherry vector containing IL17RB promoter. After three days, BxPC-3-mCherry cells were isolated using fluorescence-activated cell sorting and separated into 16 groups. Each group subjected to shRNA knockdown of one candidate plasma membrane protein (including 15 potential plasma membrane proteins and one shLacZ control, listed in Supplementary Fig. 5A). After puromycin selection, each shRNA knockdown stable cell line was mono-cultured or direct-cocultured with PSC. After 48 h of coculture, cells were lysed by Passive Lysis Buffer (Cat# E1910, Promega Corporation) and agitated at room temperature for 15 min. The luciferase activity was analyzed using a One-Glo™ Luciferase Assay System (Cat# E6110, Promega Corporation) according to the manufacturer’s recommendations. For each transfection, luciferase activity was averaged from three replicates. Luminometry readings were obtained using a luminometer VICTOR3.
Generation of IL-17RB knockout cell lines using HDR-dependent CRISPR/Cas9-based genome editing
To delete IL-17RB in HPAF-II, and MIA PaCa-2 cells, we used Clustered Regularly Interspaced Short Palindromic Repeat (CRISPR) and CRISPR-associated protein (Cas9) system (IL-17RB CRISPR/Cas9 KO Plasmid, sc-404114, Santa Cruz Biotechnology, USA) and co-transfected with homology-directed repair (HDR) plasmid (IL-17RB HDR Plasmid, sc-404114-HDR, Santa Cruz Biotechnology, USA). IL-17RB CRISPR/Cas9 KO Plasmid is a pool of 2 different gRNA plasmids targeting exon regions: (1) sc-404114A1, gRNA sequence: 5′-GGCCTTCAACAAGCGGATGC-3′, targeting human IL-17RB exon 3, responding to GRCh38.p14 reference at chr3: +53849650. (2) sc-404114A2, gRNA sequence: 5′-AGCCAGCATCCGCTTGTTGA-3′, targeting human IL-17RB exon 4, responding to GRCh38.p14 reference at chr3: +53851997. Cells were co-transfected with 2.5 μg of CRISPR/Cas9 KO Plasmid and 2.5 μg of HDR Plasmid using TransIT-LT1 Transfection Reagent (MIR 2300, Mirus Bio) in 6 cm dish following the manufacturer’s instruction. After 3 days of transfection, cells with successful Cas9-induced double-strand breaks (DSBs) were selected with 1 ~ 2 μg/mL puromycin. After 3 ~ 5 days of selection, we performed limiting dilution to derive single cell clones and measured the IL-17RB expression by Western blotting.
Invasion assay
For mono-culture condition, 104 HPAF-II tumor cells were seeded in the top chamber with Matrigel-coated membrane (24-well BD Falcon HTS Fluoro Block insert; pore size, 8 μm; BD Biosciences) in growth medium without serum. Medium supplemented with 10% FBS was used as a chemoattractant in the lower chamber. After 24 to 48 h incubation, the invaded cells were fixed with methanol, stained with Hoechst 33342, and counted with fluorescence microscopy.
For direct-coculture condition, before seeding in the top chamber, cells were detached by Accutase (Merck Millipore), a gentle cell detachment solution to preserve cell surface proteins. Mixed 104 BxPC-3 cells and 104 PSCs were seeded in the top chamber. After 48 h incubation, the invaded cells were fixed with methanol and stained with anti-CK19 antibody (1:100; GTX27755, Genetex). Chambers inserts were incubated with primary antibodies for 4°C overnight, and then incubated with fluorescent secondary antibodies (1:100; anti-mouse Alexa 594, Invitrogen) for 1 h at room temperature. Nucleus were stained with Hoechst 33342. CK19+ invading tumor cells were counted with fluorescence microscopy.
Co-immunoprecipitation (Co-IP) assay
Whole-cell lysates were prepared using a Triton X-100 lysis buffer (50 mM HEPES, 150 mM NaCl, 1% Triton X-100, 5% Glycerol, protease inhibitors cocktail, pH 7.4) followed by sonication, solubilization for 30 min at 4 °C, and centrifugation at 7000 × g at 4 °C. For Co-IP, 1 mL of the crude whole-cell extract was incubated with 1 μg anti-ATP1A1 (14418-1-AP, proteintech) or control IgG antibodies at 4 °C overnight. Then, 40 μl prewashed protein A/G agarose were added to the mixture and incubated at 4°C for 4 h with gentle agitation. After extensive washing with Triton X-100 lysis buffer (1% Triton X-100), ATP1A1 interacting proteins were eluted with SDS buffer and analyzed by Western blotting.
Quantitative real-time PCR
Total RNAs were extracted with TRIzol® reagent (Thermo Fisher Scientific), and reversely transcribed with Maxima First Strand cDNA Synthesis Kit (Thermo Fisher Scientific). To quantify specific gene expression, the quantitative real-time RT–PCR was performed using SYBR FAST qPCR Kit (KAPA Biosystems) as manufacturer’s instruction and analyzed on a Step One Plus Real-Time PCR system (Applied Biosystems, Thermo Fisher Scientific). Glyceraldehyde 3-phosphate dehydrogenase (GAPDH) was used as an internal control for gene expression. All primers were listed in Supplementary Table 2.
Western blotting
Western blotting was performed as previous reported [5]. Briefly, equal molarity of protein extracts was loaded and separated in an SDS–PAGE, and transferred to a PVDF membrane. Immunoblot analysis was performed with overnight incubation of anti-VIM (1:1000; 5741, Cell Signaling), anti-CDH1 (1:1000; 3195, Cell Signaling), anti-SNAI1 (1:1000; 3879, Cell Signaling), anti-SNAI2 antibody (1:500; 9585, Cell Signaling), anti-Twist1 (1:1000; 711565, Invitrogen), anti-ZEB1 (1:1000; 3396, Cell Signaling), anti-IL-17RB (1:1000; A81, homemade), anti-Flag (1:1000; F3165, Sigma), anti-TGFBR2 (1:500; GTX129909, Genetex), anti-TMEM219 (1:500; AF7556, R&D Systems), anti-ALK4 (1:1000; GTX102873, Genetex), anti-SMAD2/3 (1:1000; 610842, BD Biosciences), anti-ITGB3 (1:500; sc-52685, Santa Cruz Biotechnology), anti-SEMA7A (1:500; sc-374432, Santa Cruz Biotechnology), and anti-ATP1A1 (1:10000; 14418-1-AP, Proteintech). anti-β-Actin (1:10000; GTX629630, Genetex) and anti-GAPDH (1:10000; GTX627408, Genetex) was used as loading controls for total cell lysates. After incubation of horseradish peroxidase (HRP)-conjugated goat-anti-rabbit, goat-anti-mouse, or rabbit-anti-sheep secondary antibodies for 1 h, signals were detected using Immobilon Forte Western HRP Substrate (Merck Millipore, WBLUF0500) and captured by ChemiDoc MP Imaging System (Bio-Rad, USA). The intensity of each band in immunoblotting was quantified using the Gel-Pro software.
Orthotopic injection
NOD/SCID/IL2Rγnull (NSG) mice were anesthetized by using isoflurane. Local shaving and disinfection were performed around the left upper quadrant, and the abdominal cavity was opened by a 0.5 ~ 1 cm longitudinal incision. The spleen was lifted and the pancreatic tail was identified. Tumor cells (105 cells) and mixed tumor cells (105 cells) /fibroblasts (2 × 10⁵ cells) in pre-diluted Matrigel (10 μl Matrigel + 10 μl PBS) were then slowly delivered to the pancreas using a 0.3 mL insulin syringe with 29 G needle. The pancreas was placed back, the muscle layer was closed with 6-0 absorbable surgical suture, and the skin was closed with skin staples. NSAID drug meloxicam subcutaneous injection was used for postoperative analgesia.
Liver colonization assay
Pancreatic tumor cells-labeled with GFP/Luciferase were filled in insulin syringe within 100 μl HBSS. Before injection, insulin syringes were placed vertically to allow cells to go into spleen first, and then HBSS flushed the cells to liver. NOD/SCID/IL2Rγnull (NSG) mice were anesthetized by using isoflurane. Local shaving and disinfection were performed around the left upper quadrant, and the abdominal cavity was opened by a 0.5 ~ 1 cm longitudinal incision. The spleen was identified. Tumor cells slowly delivered to the spleen using a 0.3 mL insulin syringe with 29 G needle. The spleen became white upon injection and placed back later. After injection, the muscle layer of abdominal cavity was closed with 6-0 absorbable surgical suture, and the skin was closed with skin staples.
Subcutaneous injection
NOD/SCID/IL2Rγnull (NSG) mice were anesthetized by using isoflurane. Local shaving and disinfection were performed around the left and right flanks. Tumor cells (105 cells) and mixed tumor cells (105 cells) /fibroblasts (2 ×10⁵ cells) in pre-diluted Matrigel (10 μl Matrigel + 10 μl PBS) were delivered to subcutaneous site using a 0.3 mL insulin syringe with 29 G needle.
Statistical analysis
To analyze the effect of marginal IL-17RB on prognosis of pancreatic cancer patients, Kaplan–Meier curves were plotted and log-rank tests were used to evaluate progression-free survival (time from surgical resection to local recurrent or distant metastasis) or overall survival (time from surgical resection to death). Student’s t-test and Pearson’s correlation coefficient were used for testing the difference and correlation between variables. One-way ANOVA with post-hoc test (Tukey) was used to compare the difference between multiple groups. The statistical analysis was performed using MedCalc 11.5.1.0 (MedCalc software, Belgium) and Prism 10 (GraphPad Software, USA).
Results
Overexpression of IL-17RB at invasive tumor margin is correlated to poor prognosis
Previous research has established the role of IL-17RB in tumorigenesis, invasion, and metastasis [3]. However, the specific mechanisms governing IL-17RB upregulation during the metastatic cascade remain elusive. To understand the spatial regulation of IL-17RB, we examined the tumor invasive front where the initial step of metastasis occurs. Interestingly, IL-17RB expression levels were significantly enriched in the tumor outer margin within 0–20 μm from the tumor–stromal interface (Fig. 1A, B) and regions of the invasive tumor (Fig. 1C, D). To examine the clinical significance of IL-17RB expression in the tumor margin, a retrospective cohort containing stage II PDAC patients (n = 44) who underwent pancreaticoduodenectomy at the National Taiwan University Hospital between 2011 and 2015 was studied. Patient characteristics are listed in Supplemental Table 1. The results showed that patients with tumor expressed high IL-17RB within 0–20 μm of the tumor–stromal interface experienced shorter progression-free survival (p = 0.046) and overall survival (p = 0.053) compared to patients with low marginal IL-17RB expression (Fig. 1E, F). These results suggest that increased IL-17RB expression at the tumor margin elevates pancreatic cancer malignancy.
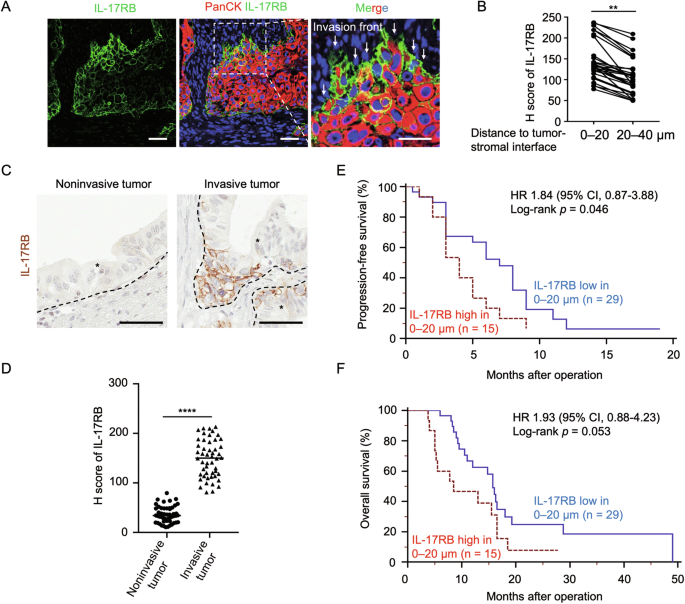
A Representative IHC images of PanCK (red signal), IL-17RB (green signal), and Hoechst 33342 (blue signal) expression in FFPE samples of PDAC patients. PanCK (Pan-Cytokeratin) is an epithelial marker to indicate tumor cells. Scale bar, 25 μm. B H score of IL-17RB expression levels in regions with 0–20 μm and 20–40 μm distance from the tumor–stromal interface in PDAC patients (n = 29). **, P < 0.01 (paired t-test). C, D Representative IHC images (G) and H scores (H) of IL-17RB expression in regions of invasive and noninvasive tumors. The brown signal denotes IL-17RB expression. Scale bar, 50 μm. Each dot represents the datum from one high-power field (n = 50). E, F Kaplan–Meier analysis of progression-free survival (I) and overall survival (J) in regions with 0–20 μm distance from the tumor (P = 0.046 and P = 0.053, separately, Log-rank test). IL-17RB expression levels were scored by 0 (no staining), 1+ ( < 10% among cancer cells), 2+ (10 to 50% among cancer cells, and 3+ ( ≥ 50% among cancer cells). For statistical analyses, the score of 0 and 1+ was combined as the low expression group, and the score of 2+ and 3+ was combined as the high expression group. Blue line, IL-17RB low in 0–20 μm, n = 29; Red line, IL-17RB high in 0–20 μm, n = 15. Values are expressed as mean ± SD. *, P < 0.05; **, P < 0.01; ****, P < 0.0001 (two-tailed Student’s t-test).
IL-17RB-modulated transcription factor SNAI2 correlates with tumor invasiveness
To determine the mechanism by which marginal IL-17RB promoted tumor malignancy, we compared parental and IL-17RB-deleted cells to demonstrate that IL-17RB promoted tumor invasion (Fig. 2A, B). We hypothesized that IL-17RB promoted epithelial–mesenchymal transition (EMT), a process known to enhance tumor invasiveness, particularly at the tumor invasive front [2]. To test this hypothesis, we compared the EMT signature genes, including those that encode CDH1, VIM, SNAI2, SNAI1, TWIST1, and ZEB1 between parental and IL-17RB-deleted cells (Fig. 2C; Supplementary Figs. 1A and 2) or vector versus IL-17RB overexpressing cells (Fig. 2D; Supplementary Fig. 1B). Our findings revealed that VIM and SNAI2 were consistently regulated by IL-17RB expression (Fig. 2C, D; Supplementary Fig. 2). These patterns of IL-17RB-mediated SNAI2 and VIM upregulation were further validated in human PDAC specimens (Fig. 2E–H). Functional assays demonstrated that SNAI2 overexpression significantly restored the invasive capacity of IL-17RB-deficient cells (Fig. 2I, J). These results suggest that IL-17RB expression at the tumor margin modulates SNAI2 upregulation and tumor invasiveness. Previous studies illustrated the importance of IL-17RB in EMT through upregulating Snail and Twist1 [7]. The present study identified SNAI2 as another downstream effector. Collectively, the results suggest that IL-17RB is a key regulator of EMT through multiple signaling pathways.
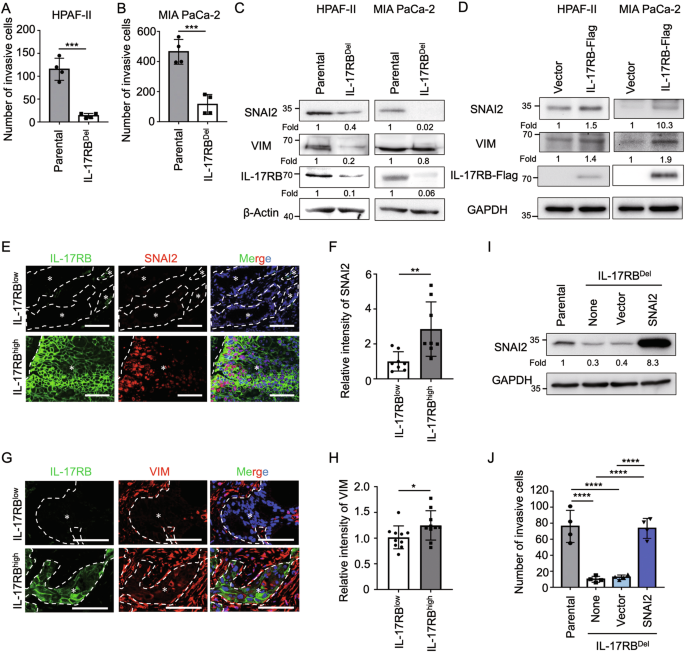
Matrigel invasion assays of HPAF-II (A) and MIA PaCa-2 (B) cells from parental or IL-17RBDel clones. Each dot represents the datum from one independent experiment (n = 4). Values are expressed as mean ± SD. ***, P < 0.001 (two-tailed Student’s t-test). C Western blotting analysis of proteins harvested from parental or IL-17RBDel tumor cells (HPAF-II or MIA PaCa-2). D Western blotting analysis of proteins harvested from HPAF-II or MIA PaCa-2 cells transduced with lentiviral pLAS5w (vector) or pLAS5w-IL17RB-Flag (IL17RB-Flag). E Representative IHC images of IL-17RB (green signal), SNAI2 (red signal) and Hoechst 33342 (blue signal) expression in FFPE samples of PDAC patients. Scale bar, 100 μm. F Relative intensity of SNAI2 in IL-17RB low and high expressing regions. IL-17RB low expressing regions were defined as IL-17RB staining expressed in <10% tumor cells per high power field, and IL-17RB high expressing regions were defined as IL-17RB staining expressed in ≥50% tumor cells per high power field. Each dot represents the datum from one high-power fields (n = 8). Values are expressed as mean ± SD. **, P < 0.01 (two-tailed Student’s t-test). G Representative IHC images of IL-17RB (green signal), VIM (red signal), Hoechst 33342 (blue signal) expression in FFPE samples of PDAC patients. Scale bar, 100 μm. H Relative intensity of VIM in IL-17RB low and high expressing regions. IL-17RB low expressing regions were defined as IL-17RB staining expressed in <10% tumor cells per high power field, and IL-17RB high expressing regions were defined as IL-17RB staining expressed in ≥50% tumor cells per high power field. Each dot represents the datum from one high-power field n = 10). Values are expressed as mean ± SD. *, P < 0.05 (two-tailed Student’s t-test). I, J Western blotting analysis (I) and Matrigel invasion assays (J) of cells from parental, IL-17RBDel (none), IL-17RBDel transduced with pLAS5w (vector), and IL-17RBDel transduced with pLAS5w-SNAI2 (SNAI2). Each dot represents the datum from one independent experiment (n = 4). Values are expressed as mean ± SD. ****, P < 0.0001 (one-way ANOVA).
Tumor-adjacent fibroblasts upregulate IL-17RB at tumor invasive margin
Upregulation of IL-17RB at the tumor margin provided critical downstream signaling cues to promote tumor invasion and metastasis. Potential mechanisms for IL-17RB overexpression at the tumor margin include 1) IL-17RB-overexpressing cells exhibit significant invasiveness and are inclined to migrate toward the tumor margin. 2) Increased expression of IL-17RB at the tumor margin by tumor microenvironmental signals. We studied the association between microenvironmental cells and IL-17RB expression levels in tumor cells to determine whether microenvironmental factors influenced the spatial distribution and expression levels of IL-17RB. The analysis focused on fibroblasts and immune cells due to their prevalence in the microenvironment of PDAC. A positive correlation was observed between IL-17RB expression levels and αSMA+ fibroblasts (Fig. 3A, B), but not CD45+ immune cells (Supplementary Fig. 3A, B). To examine whether fibroblasts altered IL-17RB expression levels and patterns, HPAF-II pancreatic cancer cells were co-injected with diverse types of fibroblasts, including pancreatic stellate cells (PSC), hepatic stellate cells (HSC), and patient derived cancer-associated fibroblasts (CAF-1 and CAF-2) (Supplementary Fig. 4). The findings showed that the percentage of tumor cells expressing IL-17RB was positively correlated with the number of αSMA+ fibroblasts (Fig. 3C, D; Supplementary Fig. 5). Moreover, the depletion of αSMA+ fibroblasts by all-trans retinoid acid [8] suppressed fibroblast-induced IL-17RB expression (Fig. 3E, F). These findings demonstrated that fibroblasts upregulated the expression of IL-17RB at the tumor margin.
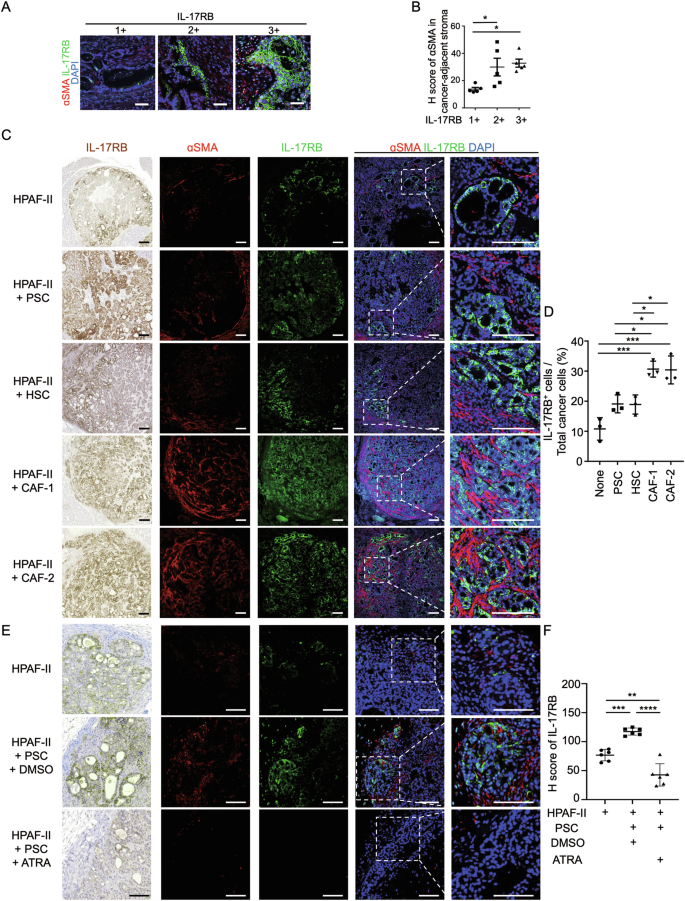
A Representative IHC images of ɑSMA (red signal), IL-17RB (green signal), DAPI (blue signal) expression in FFPE samples of PDAC patients. Scale bar, 50 μm. B H score of ɑSMA expression levels in stromal regions adjacent to IL-17RB+, IL-17RB++, or IL-17RB+++ cancer regions in PDAC patients (n = 5 high-power fields per group). IL-17RB expression levels were scored by 0 (no staining), 1+ ( < 10% among cancer cells), 2+ (10 to 50% among cancer cells, and 3+ ( ≥ 50% among cancer cells). Values are expressed as mean ± SD. *, P < 0.05 (one-way ANOVA). C, D Representative IHC images of ɑSMA (red signal), IL-17RB (green signal), DAPI (blue signal) (C) and H Score of IL-17RB expression (D) in xenograft tumors collected from orthotopic injection of HPAF-II cells and mixed HPAF-II cells/fibroblasts (PSC, HSC, CAF-1, and CAF-2) in NOD/SCID/IL2Rγnull mice at day 14 after inoculation (n = 3 mice per group). Scale bar, 100 μm. Values are expressed as mean ± SD. *, P < 0.05; ***, P < 0.001 (one-way ANOVA). E, F Representative IHC images (E) and H Score (F) of IL-17RB expression in xenograft tumors collected from subcutaneous injection of HPAF-II cells and mixed HPAF-II/PSC cells in NOD/SCID/IL2Rγnull mice treated with DMSO or 2 μM all-trans retinoid acid (ATRA, R2625, Sigma) every 3 days and collected tumor samples at day 14 after inoculation (n = 6 mice per group). Scale bar, 100 μm. Values are expressed as mean ± SD. **, P < 0.01; ***, P < 0.001; ****, P < 0.0001 (one-way ANOVA).
Fibroblasts secrete IGFBP-3 and activin A to promote IL-17RB expression upon direct contact with tumor cells
To investigate the mechanism by which fibroblasts promoted IL-17RB expression in adjacent tumor cells, fibroblasts and tumor cells were cocultured either in direct contact or using the transwell coculture method. Significantly, IL-17RB expression levels were upregulated by direct coculture (Fig. 4A; Supplementary Fig. 6A) but not transwell coculture (Fig. 4B; Supplementary Fig. 6B). Direct contact may regulate IL-17RB through plasma membrane protein interactions or secretory factors produced by direct cell–cell interactions. To test the hypothesis, BxPC-3 tumor cells were either treated with conditioned medium (Fig. 4C; Supplementary Fig. 7) or seeded on 2% paraformaldehyde-fixed tumor-fibroblast cell layers (Supplementary Fig. 8). Since IL-17RB was specifically up-regulated by soluble factors in direct co-cultured conditioned medium (Fig. 4C; Supplementary Fig. 7), we employed a cytokine array (Quantibody Human Cytokine Array 4000; RayBiotech) to compare the cytokine profiles of conditioned medium obtained from direct- versus transwell-co-cultured conditions of BxPC-3 and PSCs. Activin A and IGFBP-3 were the top two cytokines that were enriched in the direct-cocultured condition (Fig. 4D). IGFBP-3 and activin A were consistently upregulated in direct-cocultured conditions as compared to transwell-cocultured or monocultured conditions, as determined by ELISA analysis (Fig. 4E, F). To examine the role of IGFBP-3 or activin A in IL-17RB induction, pancreatic cancer cells were treated with recombinant forms of these proteins. This treatment resulted in upregulation of the protein (Fig. 4G, H) and RNA (Supplementary Fig. 9A, B) levels of IL-17RB. Conversely, neutralization of IGFBP-3 and activin A in direct-cocultured conditioned medium suppressed IL-17RB expression (Fig. 4I). In addition, IGFBP-3 is reported to bind TGF-beta receptor type 2 (TGFBR2) [9] and IGFBP-3 receptor (TMEM219) [10], while activin A binds to activin receptor ALK4. Knockdown of TGFBR2 and ALK4 by shRNA suppressed IL-17RB induction (Fig. 4J–M). Thus, IGFBP-3 and activin A induced increased expression of IL-17RB through TGFBR2 and ALK4, respectively. Consistently, inhibition of the activin and TGF-β pathways by SB431542 suppressed IL-17RB expression (Fig. 4N). SMAD signaling, which induces IL-17RB expression in breast cancer [5], is the common downstream pathway for IGFBP-3 and activin A signaling [9, 11]. Indeed, shRNA knockdown of SMAD2 and SMAD3 suppressed IGFBP-3 and activin A-induced IL-17RB expression (Fig. 4O, P). These results imply that direct tumor-fibroblast contact promotes secretory IGFBP-3 and activin A, which correspondingly bind to TGFBR2 and ALK4 on tumor cells and induce IL-17RB through the SMAD pathway.
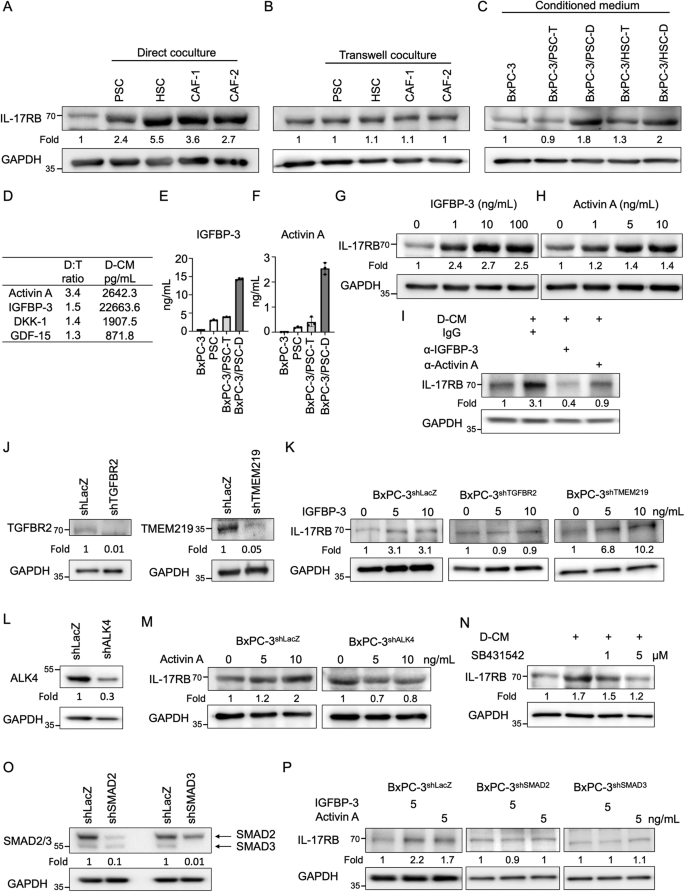
A After 48 h of direct coculture with fibroblasts, BxPC-3-mCherry tumor cells were isolated using fluorescence-activated cell sorting analysis and subsequently subjected to Western blotting analysis. B After 48 h of transwell-coculture with fibroblasts, BxPC-3 tumor cells were harvested for Western blotting analysis. C BxPC-3 tumor cells were treated with conditioned medium isolated from transwell (T) or direct (D) cocultured BxPC-3 cells and fibroblasts (PSC or HSC) for 48 h, and subsequently subjected to Western blotting analysis. D The human cytokine array used conditioned medium from transwell (T) versus the direct (D)-cocultured BxPC-3 cells and fibroblasts (PSC). Cytokine levels in direct (D) cocultured condition were normalized to those in the transwell (T) cocultured condition (D:T ratio). Cytokine levels in direct-cocultured conditioned medium (D-CM) were expressed in picograms per milliliter (pg/mL). E, F ELISA analysis of IGFBP-3 (E) or Activin A (F) in the supernatant of monocultured BxPC-3 cells (BxPC-3), monocultured PSCs (PSC), transwell-cocultured BxPC-3 cells/PSCs (BxPC-3/PSC-T), and direct-cocultured BxPC-3 cells/PSCs (BxPC-3/PSC-D). Values are expressed as mean ± SD, with n = 3. G, H BxPC-3 cells were treated with recombinant human IGFBP-3 (1, 10, and 100 ng/mL) (G) or Activin A (1, 5, and 10 ng/mL) (H) for 72 h and subsequently subjected to Western blotting analysis. I Direct-cocultured conditioned medium (D-CM) were collected from direct-cocultured BxPC-3 cells and PSCs. BxPC-3 cells were treated with direct-cocultured conditioned medium (D-CM) and IgG (2 μg/mL), anti-IGFBP-3-neutralizing antibodies (2 μg/mL; AF675, R&D Systems), or anti-activin A-neutralizing antibodies (2 μg/mL; 693604, Biolegend) for 72 h and subsequently subjected to Western blotting analysis. J Western blotting analysis of proteins harvested from BxPC-3 cells stably expressing lentiviral-based LacZshRNA, TGFBR2shRNA (left panel), or TMEM219shRNA (right panel). K BxPC-3shLacZ, BxPC-3shTGFBR2, or BxPC-3shTMEM219 cells were treated without or with recombinant human IGFBP-3 (5 and 10 ng/mL) for 72 h and subsequently subjected to Western blotting analysis. L Western blotting analysis of proteins harvested from BxPC-3 cells stably expressing lentiviral-based LacZshRNA or ALK4shRNA. M BxPC-3shLacZ or BxPC-3shALK4 cells were treated without or with recombinant human activin A (5 and 10 ng/mL) for 72 h and subsequently subjected to Western blotting analysis. N Direct-cocultured conditioned medium (D-CM) were collected from direct-cocultured BxPC-3 cells and PSCs. BxPC-3 cells were treated with direct-cocultured conditioned medium (D-CM) without or with SB431542 (1 and 5 μM) for 72 h and subsequently subjected to Western blotting analysis. O Western blotting analysis of proteins harvested from BxPC-3 cells stably expressing lentiviral-based LacZshRNA, SMAD2shRNA, or SMAD3shRNA. P BxPC-3shLacZ, BxPC-3shSMAD2, or BxPC-3shSMAD3 cells were treated without or with recombinant human IGFBP-3 (5 ng/mL) or activin A (5 ng/mL) for 72 h and subsequently subjected to Western blotting analysis.
SEMA7A-expressing tumor cells induce directly contacting fibroblasts to secrete IGFBP-3 for IL-17RB upregulation
To identify the source of IGFBP-3, we treated cells with a protein transport inhibitor (containing monensin) and performed immunofluorescence staining. These results showed that IGFBP-3 was secreted by fibroblasts during direct tumor-fibroblast interactions (Fig. 5A–D). Similarly, mRNAs of IGFBP-3 were identified in the mesenchymal-type cells adjacent to the tumor cells and analyzed by in situ hybridization using an RNAscope (ACDBio, USA) in tumor specimens from PDAC patients (Fig. 7C).
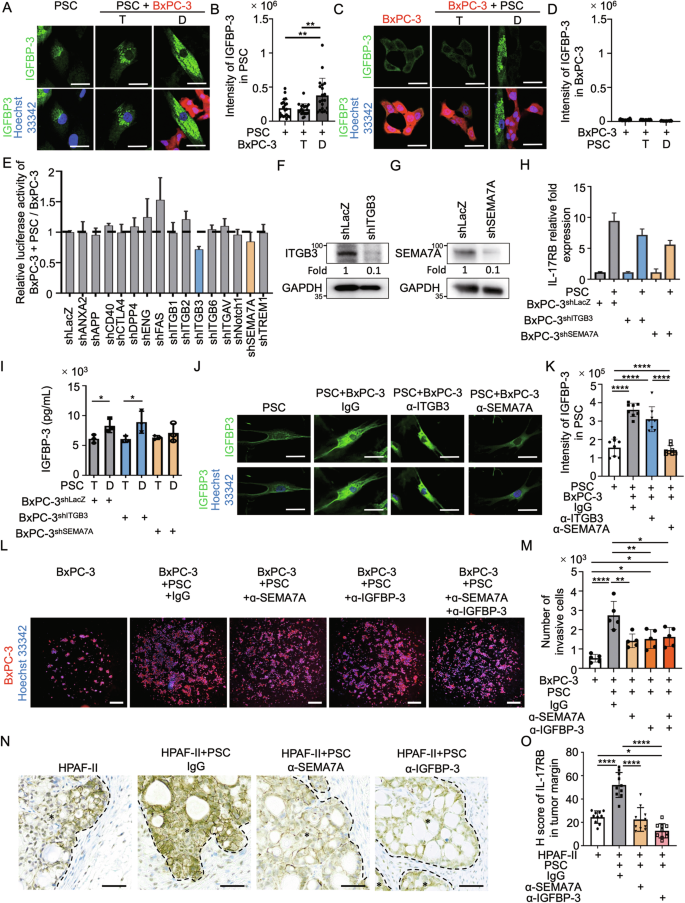
A, C Immunofluorescence staining of IGFBP-3 (green signal) and Hoechst 33342 (blue signal) was conducted on PSC (A) or BxPC-3-mcherry (red signal) (C) under monocultured, transwell-cocultured, or direct-cocultured conditions with the other cell type, and images were captured using a confocal microscope. A protein transport inhibitor (containing monensin) was used for IGFBP-3 accumulation in the Golgi complex before staining. Scale bar, 20 μm. B, D Quantification results of IGFBP-3 intensity in perinuclear regions of PSC (B) or BxPC-3 (D) analyzed by Image J. Each dot represents the datum from one cell (n = 20). Values are expressed as mean ± SD. **, P < 0.01 (one-way ANOVA). E RNAi knockdown screening of candidate plasma membrane proteins (n = 15) that induced IL-17RB expression during direct tumor-fibroblast contact. Luciferase activity of the IL-17RB reporter in cocultured PSCs/BxPC-3 cells was normalized to monocultured BxPC-3 cells. F, G Western blotting analysis of proteins harvested from BxPC-3 cells stably expressing lentiviral-based LacZshRNA, ITGB3shRNA (F), or SEMA7AshRNA (G). H IL-17RB mRNA levels were measured by quantitative real-time PCR in BxPC-3 cells (shLacZ, shITGB3, shSEMA7A) following 24-hrs mono-culture or direct coculture with PSCs with three technical repeats. I IGFBP-3 protein levels were measured by ELISA analysis in supernatant of BxPC-3 cells (shLacZ, shITGB3, shSEMA7A) following 48-hrs transwell (T) or direct (D)-cocultured with PSCs with three technical repeats. Values were presented as mean ± SD. *, P < 0.05 (two-tailed Student’s t-test). J, K Immunofluorescence staining of IGFBP-3 (green signal) in PSCs under different conditions. In these conditions, PSCs are grown alone or cocultured with BxPC-3 cells and treated with IgG (control), anti-ITGB3 (sc-52685, Santa Cruz Biotechnology), or anti-SEMA7A (sc-374432, Santa Cruz Biotechnology) neutralizing antibodies (all at 1 μg/mL). Representative images (J) and quantification results (K) of IGFBP-3. Scale bar, 20 μm. Each dot represents the datum from one cell (n = 8). Values are expressed as mean ± SD. ****, P < 0.0001 (one-way ANOVA). L, M Representative images (L) and quantification results (M) of Matrigel invasion assays of BxPC3 cells under different conditions. These conditions include BxPC-3 cells alone or those cocultured with PSCs treated with IgG, anti-SEMA7A (sc-374432, Santa Cruz Biotechnology), or anti-IGFBP-3 (AF675, R&D Systems) neutralizing antibodies (all at 1 μg/mL). Each dot represents the datum from one independent experiment (n = 5). Values are expressed as mean ± SD. *, P < 0.05; **, P < 0.01; ****, P < 0.0001 (one-way ANOVA). N, O HPAF-II cells and mixed HPAF-II/PSC cells were injected subcutaneously in NOD/SCID/IL2Rγnull mice. Mice in the mixed HPAF-II/PSC group received treatment every 3 days with IgG (control), anti-SEMA7A (sc-374432, Santa Cruz Biotechnology), or anti-IGFBP (AF675, R&D Systems) neutralizing antibodies (all at 1 μg/mL). The neutralizing antibodies were subcutaneously injected adjacent to subcutaneous tumors every 2 days. After 14 days, all mice were sacrificed, and tumor samples were collected for analysis. Representative IHC images (N) and H scores (O) of IL-17RB expression. Scale bar, 50 μm. Each dot represents the datum from a single high-power field (n = 10). Values were presented as mean ± SD. *, P < 0.05; ****, P < 0.0001 (one-way ANOVA).
Upstream regulators of IGFBP-3 were identified by screening potential plasma membrane proteins that stimulated cytokine release to upregulate IL-17RB using an IL-17RB reporter assay. The potential plasma membrane proteins (n = 15; Supplementary Fig. 10A) were predicted by ingenuity pathway analysis upstream regulator analysis (QIAGEN, Germany) of cytokines enriched in direct-cocultured conditions (n = 9; Supplementary Fig. 10A). The IL-17RB reporter assay was designed considering the increment of IL-17RB mRNAs in direct-cocultured conditions (Supplementary Fig. 11A). BxPC-3 tumor cells infected with the 7TFC-IL-17RB-FFluc//SV40-mCherry reporter constructs consistently exhibited enhanced IL-17RB luciferase activities in direct-cocultured conditions (Supplementary Fig. 11B, C). Among the 15 candidate genes, shRNA knockdown of ITGB3 and SEMA7A reduced direct-contact-mediated IL-17RB transcriptional activation (Fig. 5E; Supplementary Figs. 10B–P). For result validation, mRNA levels of IL-17RB were examined in tumor cells depleted of ITGB3 and SEMA7A, with and without direct interaction with fibroblasts (Fig. 5F–H). To examine whether ITGB3 or SEMA7A regulated IGFBP-3, we depleted these two proteins and analyzed the difference in IGFBP-3 levels between transwell- and direct-cocultured conditions. The results showed that SEMA7A in tumor cells regulated IGFBP-3 secretion (Fig. 5I). Neutralizing antibodies against SEMA7A consistently downregulated IGFBP-3 secretion in fibroblasts (Fig. 5J, K). Furthermore, SEMA7A and IGFBP-3 were both found to be important for tumor invasion through direct tumor-fibroblast interactions (Fig. 5L, M). Finally, tumor xenograft assays were performed to demonstrate the significance of SEMA7A and IGFBP-3 in fibroblast-mediated upregulation of IL-17RB expression at the tumor margin (Fig. 5N, O). In summary, fibroblasts in direct contact with SEMA7A-expressing tumor cells secrete IGFBP-3 to promote IL-17RB expression at the tumor margin, facilitating enhanced tumor invasion.
SEMA7A cooperates with ATP1A1 to induce IGFBP-3 secretion and IL-17RB upregulation
Activin A was secreted upon direct tumor-fibroblast contact in regulating IL-17RB (Fig. 4G–I). Direct binding to ATP1A1-expressing tumor cells induces activin A secretion from fibroblasts [12]. Considering the concurrent occurrence of ATP1A1-induced activin A and SEMA7A-induced IGFBP-3 secretion in response to tumor-driven fibroblast alterations and direct tumor-fibroblast interaction, it is plausible that ATP1A1 and SEMA7A collaborate across the plasma membrane during adhesion. To examine the potential interactions between ATP1A1 and SEMA7A, we co-stained these two proteins and observed their colocalization in plasma membrane protrusions of BxPC-3 cells (Fig. 6A). In addition, coimmunoprecipitation exhibited interactions between ATP1A1 and SEMA7A in BxPC-3 cells (Fig. 6B). These results suggest that ATP1A1 and SEMA7A form protein complexes in tumor protrusion regions.
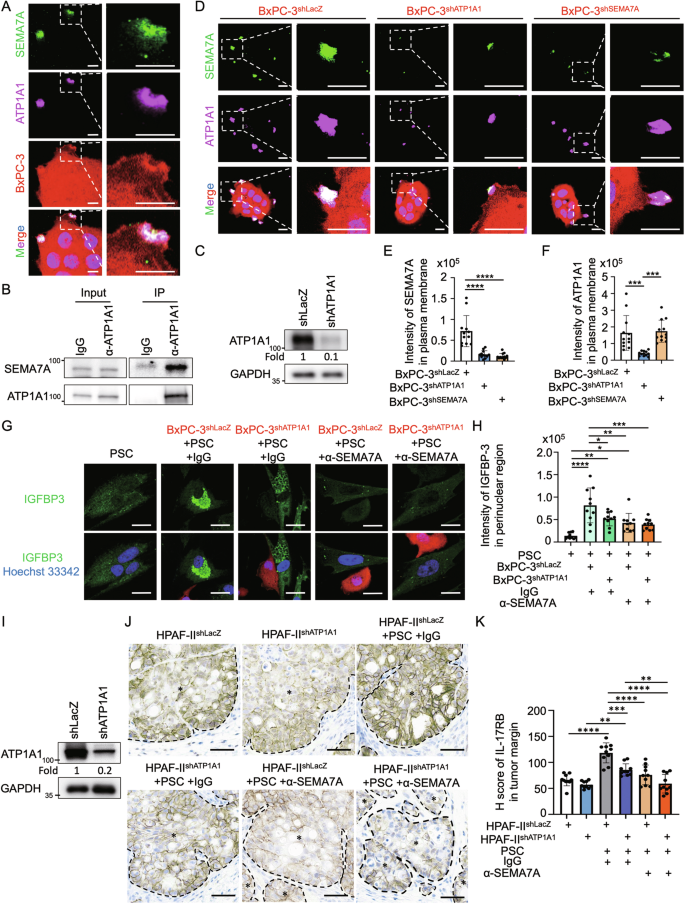
A Immunofluorescence staining of SEMA7A (green signal), ATP1A1 (magenta signal) and Hoechst 33342 (blue signal) in BxPC-3 cells (red signal). Plasma membrane proteins were stained without cell permeabilization. Scale bar, 5 μm. B Western blotting analysis of protein immunoprecipitated using IgG and anti-ATP1A1 antibodies in BxPC-3 cells. The left panels were input; the right panels were immunoprecipitated fractions. C Western blotting analysis of proteins harvested from BxPC-3 cells stably expressing lentiviral-based LacZshRNA and ATP1A1shRNA. D–F Immunofluorescence staining (D) and quantification results of SEMA7A (green signal) (E) and ATP1A1 (magenta signal) (F) in mcherry+ BxPC-3shLacZ, BxPC-3shATP1A1, and BxPC-3shSEMA7A cells. Scale bar, 10 μm. Each dot represents the datum from one cell (n = 12). Values are expressed as mean ± SD. ***, P < 0.001; ****, P < 0.0001 (one-way ANOVA). G, H Immunofluorescence staining (G) and quantification results (H) of IGFBP-3 in PSC alone, cocultured with BxPC-3shLacZ-mcherry, or cocultured with BxPC-3shATP1A1-mcherry. Cocultured cells were treated with IgG (control) or anti-SEMA7A (sc-374432, Santa Cruz Biotechnology) neutralizing antibodies (all at 1 μg/mL). Scale bar, 20 μm. Each dot represents the datum from one cell (n = 10). Values are expressed as mean ± SD. *, P < 0.05; **, P < 0.01; ***, P < 0.001; ****, P < 0.0001 (one-way ANOVA). I Western blotting analysis of proteins harvested from BxPC-3 cells stably expressing lentiviral-based LacZshRNA and ATP1A1shRNA. J, K HPAF-IIshLacZ and HPAF-IIshATP1A1 cells, either alone or mixed with PSCs, were injected subcutaneously in NOD/SCID/IL2Rγnull mice. Mice in the mixed HPAF-II/PSC groups received treatment every 3 days with IgG (control) or anti-SEMA7A SEMA7A (sc-374432, Santa Cruz Biotechnology) neutralizing antibodies (all at 1 μg/mL). After 14 days, all mice were sacrificed, and tumor samples were collected for analysis. Representative IHC images (J), H scores (K), and IL-17RB expression. Scale bar, 50 μm. Each dot represents the datum from one high-power field (n = 10). Values are expressed as mean ± SD. **, P < 0.01; ***, P < 0.001; ****, P < 0.0001 (one-way ANOVA).
Since ATP1A1 is a key component for the formation of Na/K-ATPase-related adhesion complexes, we hypothesized that SEMA7A might be involved in facilitating the role of Na/K-ATPase-related adhesion complexes during direct tumor-fibroblast interactions. Indeed, knockdown of ATP1A1 reduced the expression of SEMA7A, while knockdown of SEMA7A did not affect ATP1A1 expression (Figs. 5G, 6C–F). Therefore, ATP1A1 is crucial for the plasma membrane expression of SEMA7A. Depletion of ATP1A1 suppressed IGFBP-3 expression in fibroblasts (Fig. 6G, H) and IL-17RB expression near the tumor invasion margin (Fig. 6I–K). To sum up, ATP1A1 facilitated plasma membrane expression of SEMA7A, leading to IGFBP-3 induction and upregulation of IL-17RB via feedback mechanisms.
Histological analysis in human PDAC reveals adjacent localization of IGFBP-3-expressing stromal cells with SEMA7A- or IL-17RB-expressing tumor cells
To investigate the clinical importance of SEMA7A-induced IGFBP-3 secretion in PDAC tumor specimens, the correlation between the spatial locations of SEMA7A and IGFBP-3 was analyzed. Positive correlations were observed between expression levels of IGFBP-3 in stromal cells and SEMA7A in adjacent tumor cells in serial sections (Fig. 7A, B).
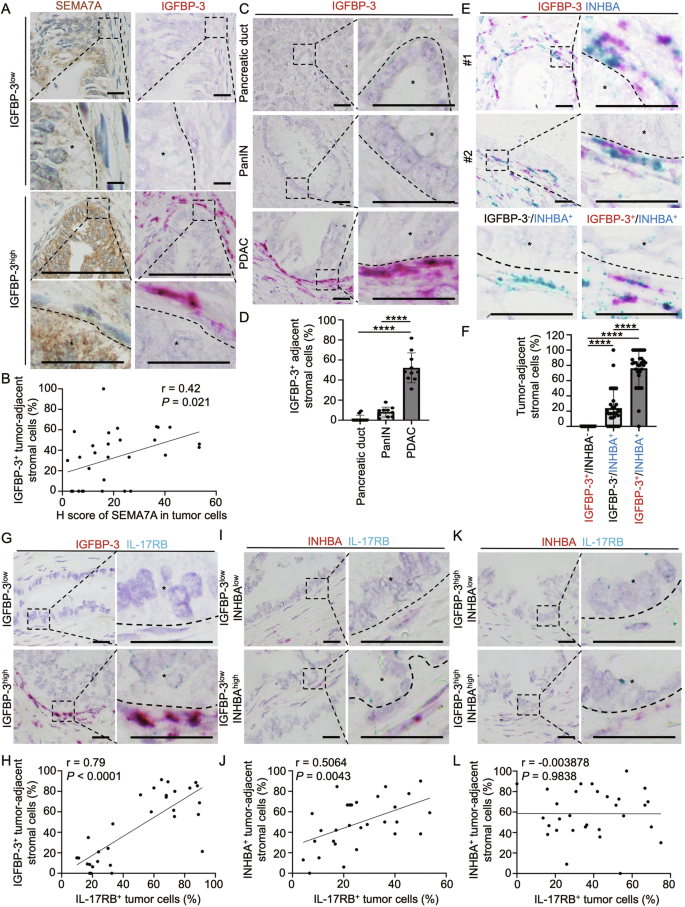
A, B Correlation of SEMA7A and IGFBP-3 protein expression levels in tumor specimens from PDAC patients. (A) Representative images of SEMA7A protein expression (brown signal, IHC) and IGFBP-3 mRNA expression (pink signal, in situ hybridization RNAscope). Scale bar, 25 μm. B Pearson’s correlation coefficient analysis of SEMA7A and IGFBP-3 according to H score of SEMA7A and tumor-adjacent IGFBP-3+ cells (%) (n = 30; r = 0.42; P = 0.021). Each dot represents the datum from one high-power field. C Representative images of in situ hybridization (RNAscope) using a probe for IGFBP-3 mRNA in tumor specimen from a PDAC patient. mRNAs of IGFBP-3 (pink signal dots) were located in peri-tumoral regions. The nucleus was stained with hematoxylin. Scale bar, 25 μm. D Percentage of IGFBP-3+ adjacent stromal cells in normal pancreatic duct, PanIN (Pancreatic intraepithelial neoplasia), and PDAC (pancreatic ductal adenocarcinoma) in patient specimen. Each dot represents the datum from one high-power field. Values are expressed as mean ± SD (n = 10). ****, P < 0.0001 (one-way ANOVA). E Representative images of in situ hybridization (RNAscope) using probes for IGFBP-3 (pink) and INHBA (blue, gene name of activin A) mRNA in tumor specimen froma PDAC patient. The pink signal dots (IGFBP-3) were co-localized with blue signal dots (INHBA) in peri-tumoral regions. The nucleus was stained with hematoxylin. Scale bar, 25 μm. F Percentage of IGFBP-3+/INHBA–, IGFBP-3–/INHBA+, and IGFBP-3+/INHBA+ tumor-adjacent stromal cells. Each dot represents the datum from one high-power field. Values are expressed as mean ± SD (n = 30). ****, P < 0.0001 (one-way ANOVA). G, H Representative images (G) and Pearson’s correlation analysis (H) of IGFBP-3+ tumor-adjacent fibroblasts and IL-17RB+ tumor cells in PDAC patient specimen (n = 30). Scale bar, 25 μm. Each dot represents the datum from one high-power field. I, J Representative images (I) and Pearson’s correlation analysis (J) of INHBA+ tumor-adjacent fibroblasts and IL-17RB+ tumor cells in IGFBP-3 low expression regions in tumor specimen from PDAC patients (n = 30). Scale bar, 25 μm. Each dot represents the datum from one high-power field. K, L Representative images (K) and Pearson’s correlation analysis (L) of INHBA+ tumor-adjacent fibroblasts and IL-17RB+ tumor cells in IGFBP-3 high expression regions in tumor specimen from PDAC patients (n = 30). Scale bar, 25 μm. Each dot represents the datum from one high-power field.
IGFBP-3 and activin A were significantly overexpressed by the mesenchymal-type cells adjacent to the tumor cells of human PDAC compared to normal pancreatic ducts and pancreatic intraepithelial neoplasia (PanIN) lesions (Fig. 7C, D; Supplementary Fig. 12A, B). To investigate the spatial association between IGFBP-3+ or activin A+ fibroblasts and IL-17RB+ tumor cells, we first examined fibroblast heterogeneity by assessing their expression of either IGFBP-3 or INHBA (the gene that encodes activin A) using an RNAscope. As depicted in Fig. 6, ATP1A1 was required to recruit SEMA7A, which subsequently induced IGFBP-3. IGFBP-3-expressed fibroblasts concurrently expressed INHBA (Fig. 7E, F). Analysis of IGFBP-3 and INHBA (activin A) expression in stromal cells revealed a dominant population (80%) exhibiting dual marker expression (IGFBP-3+/INHBA+), a minority population (20%) solely expressing INHBA (IGFBP-3−/INHBA+), and an almost undetectable population (0%) expressing only IGFBP-3 (IGFBP-3+/INHBA−) (Fig. 7E, F). These results indicated that ATP1A1 interactions, which eventually led to activin A secretion, were required for SEMA7A-induced IGFBP-3 secretion. Next, we analyzed the spatial correlation between IL-17RB expressing tumor cells and stromal cells adjacent to them (IGFBP-3, or activin A secreting). The percentage of IGFBP-3 secreting stromal cells was positively correlated to IL-17RB-expressing tumor cells (Fig. 7G, H), while INHBA-expressing stromal cells were positively correlated to IL-17RB-expressing tumor cells only in regions with low expression of IGFBP-3 (Fig. 7I, J). No correlation was seen between IL-17RB-expressing tumor cells and INHBA-expressing stromal cells in regions exhibiting increased expression of IGFBP-3 (Fig. 7K, L). These results indicate that IGFBP-3 plays a major role in regulating IL-17RB expression near the tumor margin.
To evaluate the clinical significance of SEMA7A-induced IGFBP-3 secretion in promoting tumor malignancy, patient prognosis related to mRNA levels of these two proteins was analyzed using the TCGA database. High mRNA levels of SEMA7A and IGFBP3 were associated with poor progression-free survival and overall survival in PDAC patients (Supplementary Fig. 13A–D). In conclusion, this study identified a major role of ATP1A1 in facilitating SEMA7A to induce IGFBP-3 secretion, leading to IL-17RB upregulation and tumor invasion.
Discussion
IL-17RB overexpression is a key promoter of pancreatic cancer metastasis. This study unveils the mechanisms that trigger its upregulation at the onset of metastasis. Direct cell-cell interactions provide a localized signal for the spatial organization of cellular heterogeneity. We demonstrated that direct tumor-fibroblast interactions generate tumor-promoting fibroblasts and IL-17RB-overexpressing tumor cells, which together facilitate invasion. Mechanistically, the sequential processes include (1) tumor cells with genetic/epigenetic changes that were capable of expressing IL-17RB. (2) direct tumor-fibroblast interactions occurred at the tumor-stromal interface. (3) ATP1A1-expressing tumor cells induce activin A secretion from fibroblasts to mildly upregulate IL-17RB through feedback mechanisms. (4) ATP1A1 additionally recruited SEMA7A in the plasma membrane to induce IGFBP-3 secretion from fibroblasts adjacent to tumor cells. (5) Accumulated IGFBP-3 at the tumor-stromal interface provided spatial cues to cause significant upregulation of IL-17RB expression at the tumor margin for invasion in a specific direction. (6) IL-17RB upregulated SNAI2 to promote invasion. In summary, ATP1A1-facilitated SEMA7A expression on tumor cells directly bound to fibroblasts causes IGFBP-3 secretion, leading to increased IL-17RB induction. Disruption of the SEMA7A-mediated increase in IGFBP-3 in regions of direct tumor-fibroblast interactions might serve as a potential therapeutic target to counteract marginal IL-17RB enhancement and tumor invasion.
Invasion is a complex process involving changes in adhesion molecules, breakdown of the basement membrane, and remodeling of the extracellular matrix. Previous studies show that fibroblast-derived TGF-β and SDF-1 play a key role in enhancing tumor invasion [13, 14]. Therefore, when tumor cells are situated near tumor borders and encounter these cytokines, their invasive ability will be enhanced. These findings can explain the phenomenon that tumor cells located at the leading edge display increased expression of genes associated with TGF signaling compared to the tumor core [2]. Conversely, invasions that occur in specific regions require localized signals. A recent study reveals that the local microenvironment is the key determinant of invasion by tumor cells [15]. Invasion is enhanced in basal regions, where epithelial cells increasingly interact with fibroblasts and immune cells compared to apical regions [15]. Contrary to the classic diffusion–consumption mechanism, direct interactions that create localized high levels of cytokines may be the crucial signal for initiating an invasion. In the present study, SEMA7A-expressing tumor cells were found to induce IGFBP-3 secretion, leading to the development of IL-17RB-overexpressing tumor cells at specific invasive regions.
SEMA7A (Semaphorin 7A) is a glycosyl-phosphatidylinositol-anchored plasma membrane protein that regulates motility, morphology, and cytokine secretion in diverse cell types. Since SEMA7A lacks a cytoplasmic tail, the function of SEMA7A in altering intracellular signaling is mediated by its receptors (Plexin C1 or β1-integrin) located on adjacent cells [16, 17]. Previous studies demonstrate SEMA7A’s involvement in axon growth [18], neutrophil migration [16], and cytokine production of various cell types [17, 19]. Similarly, our study elucidates its role in promoting cell migration through IGFBP-3 secretion.
Overexpression of SEMA7A in tumor cells enhances the tumor’s intrinsic properties for tumor growth [20], invasion [21], epithelial–mesenchymal transition [22], and chemoresistance [23]. Moreover, tumor derived SEMA7A modulates the tumor microenvironment through the promotion of lymphatic endothelial cell tube formation [24, 25] and angiogenesis [26]. In the present study, direct binding to SEMA7A-expressing tumor cells induced IGFBP-3 secretion in fibroblasts. Although the mechanism remains unclear, evidence from literature review suggest a connection between SEMA7A and IGFBP-3. GIPC (Synectin) can enhance IGFBP-3 expression levels in fibroblasts [27]. GIPC proteins are cytosolic proteins involved in the trafficking and signaling of various transmembrane proteins, including neurophilins and integrins [28], which are receptors for semaphorins [29]. Therefore, we hypothesize that the binding of SEMA7A to neurophilins/integrins recruits GIPC to upregulate IGFBP3. Further research is needed to validate this hypothesis.
Insulin-like growth factors (IGFs) are key growth-promoting hormones that require robust regulation by IGF-binding proteins (IGFBPs). IGFBP-3, as the most abundant IGFBP in the blood, has IGF-dependent and IGF-independent functions. Like other IGFBPs, IGFBP-3 binds to IGF with greater affinity than IGF1R [9]. Therefore, IGFBP-3 extends the circulating half-life and modulates the biological activity of IGF1/2 [9]. For IGF-independent actions, IGFBP-3 binds directly to plasma membrane receptors (TMEM219/IGFBP-3R, TGF-βRII, and TGF-βRV [9]) or undergoes uptake by endocytosis and enters the nucleus to regulate RXRα signaling [9]. Our study identified one of the IGF-independent functions of IGFBP3 that involves its interaction with TGF-βRII and facilitation of SMAD2/3 signaling. In addition, IGFBP-3 promotes cell migration in both normal [27] and tumor cells [30]. Similarly, our study demonstrated that IGFBP-3 secreted by fibroblasts within the tumor microenvironment promotes tumor invasion.
Our research revealed a connection between SEMA7A and IGFBP-3, two molecules involved in cell migration, and discovered that they collaborate at the tumor’s invasive edge. SEMA7A from tumor cells stimulates fibroblasts to secrete IGFBP-3, which in turn influences a subset of IL-17RB-expressing cells to facilitate invasion. Moreover, SEMA7A and IGFBP-3 have independent roles in affecting fibroblast functions. SEMA7A influences fibroblast migration [31], adhesion [31], and collagen production [21], while IGFBP-3 promotes migration [27] and myofibroblast differentiation [32]. Therefore, it is plausible that SEMA7A and IGFBP-3 work together to modulate the migratory and secretory functions of fibroblasts to influence tumor invasion.
TGFβ-SMAD signaling is an important pathway to regulate cellular motility and epithelial–mesenchymal transition. While TGFβ signals suppress tumorigenesis in the early stages, they promote tumorigenesis in the advanced stages. To evade the tumor-suppressive responses of this signaling pathway, SMAD4 is mutated in 55% of PDAC patients, while the SMAD2/3 mutation is rare. Previous investigations suggest that SMAD signaling in SMAD4 mutant cells may be initiated via SMAD4-independent mechanisms involving SMAD2/3 activation [33]. Similarly, we observed that activin A (belonging to the TGF-β family) and IGFBP-3 (binding to TGFβRII) activated SMAD2/3 signaling to promote IL-17RB expression in SMAD4-mutated BxPC-3 cells.
In conclusion, our study reveals a novel mechanism to regulate the spatial organization of IL-17RB-expressing cells at the tumor’s invasive margin to promote invasion. SEMA7A-expressing tumor cells directly bind to fibroblasts and trigger IGFBP-3, which upregulates IL-17RB expression in tumor cells through feedback mechanisms to promote invasion. This localized induction of IL-17RB promotes escape from local constraints and drives tumor invasion. These findings emphasize the significance of intercellular communication in the tumor microenvironment and suggest that targeting the SEMA7A-IGFBP-3-IL-17RB axis holds promise for devising innovative therapeutic approaches to combat pancreatic cancer metastasis.
Responses