SenMayo transcriptomic senescence panel highlights glial cells in the ageing mouse and human retina

Introduction
Cellular senescence was first described by Hayflick and Moorhead, who observed a gradual decline in replicative potential in cultured human fibroblasts leading ultimately to stable cell cycle arrest. Senescence is a complex, dynamic, and diverse cellular response to various intrinsic and extrinsic stimuli1,2. Cellular senescence is accompanied by alterations in metabolic activity and gene expression profiles as well as the development of a secretory phenotype. This senescence-associated secretory phenotype (SASP) is characterised by the secretion of high levels of pro-inflammatory cytokines, immune modulators, extracellular matrix (ECM) degrading enzymes, growth factors and proteases3,4,5. Multiple markers need to be evaluated to define senescence. The recently published SenMayo gene set was established in an effort to identify senescent cells in large transcriptomics datasets6. This gene panel was derived following extensive literature mining and comprises 125 transcriptomic markers for human and 118 transcriptomic markers for mouse that identified senescent cells in human and mouse datasets6.
The observation that senescent cells increase with advancing age in the liver, skin, lung and spleen has led to the assumption that senescence directly contributes to the ageing process7,8. This hypothesis was further fuelled by the discovery that clearance of p16INK4A-positive cells delayed the onset of age-related diseases in mice9. As life expectancy increases, there is an associated increase in the incidence of chronic health conditions associated with ageing10. Ageing remains a risk factor for many neurodegenerative diseases including Alzheimer’s disease11, Parkinson’s disease12 and ocular diseases such as glaucoma and age-related macular degeneration13,14 and further work is needed to determine the importance of senescence in this process. In comparison to many other organ systems, our understanding of senescence in the retina and how this changes with physiological ageing remains largely unexplored. There are various factors that complicate the detection of senescence in the retina and CNS. These tissues are comprised of both mitotic and post-mitotic cell populations complicating the identification of senescent cells15,16. In addition, the phenotype of senescent cells itself is largely heterogeneous and dependent on the type of cell, the stressor and the microenvironment17 making detection of senescence in post-mitotic neurons and glia challenging. Studies have explored the expression of senescence markers mainly in the context of experimental disease of retinal/optic nerve injury models, usually performed in young mice18,19,20,21.
In this manuscript, we explored signatures of senescence in the ageing mouse and human retina using the SenMayo panel of senescence markers6. Using this gene panel, we find that retinal glial cells were most enriched for the SenMayo panel in both human and mouse retina and show an age-related increase in senescence markers only in the human retina. Interleukin signalling driven by IL-4, -13 and 10 were highly enriched in these cells across species and cell types and the AP1 transcription pathway was additionally observed in SenMayo gene set enriched microglia.
Results
Mouse retinal glial cells are highly enriched for the SenMayo gene panel
Our scRNA mouse retina dataset comprised 63,303 cells from 3-, 12- and 24-month-old retinal samples. Rods, cones, bipolar cells (BCs), amacrine cells (ACs), retinal ganglion cells (RGCs), horizontal cells (HCs), Mueller glia (MG), astrocytes (Asc), microglia (Mic) and Endothelial cells and Pericytes (ECs & Pericytes) were the major cell types identified as clusters in the UMAP (Fig. 1a, Supplementary Fig. 1d–f). A small cluster of retinal blood cells (Ret blood) was also identified. Glial cells and ECs and Pericytes scored the highest in the gene set enrichment analysis (GSEA) (performed at the single-cell level using the escape package) of the SenMayo gene panel (Fig. 1b, c) with ~69% SenMayo-hi astrocytes, ~57% ECs and pericytes, ~47% SenMayo-hi microglial and ~30% SenMayo-hi MG (Fig. 1d). In comparison, retinal neurons had very low numbers of SenMayo-hi cells (ACs- 0.22%, BCs- 0.26%, Cones- 1.2%, HCs- 0%, RGCs- 0.37%, Rods- 0.006%). SenMayo-hi cells were also enriched for two other independently established ageing gene sets – CellAge22 and GenAge23 and expressed higher levels of Tgfb2, a driver of senescence which is not a part of the SenMayo panel24,25 (Fig. 1e). Using a third independent senescence gene panel26 (Cherry_2023), we observed again that glial cells had the highest enrichment for senescence-related genes (Supplementary Fig. 2c). Since the microglial cells showed very high SenMayo enrichment score as seen in the density plot (Fig. 1b), we wanted to verify whether this was due to a high proportion of SenMayo genes being microglial marker genes. Using a published retinal microglial gene set (HU_FETAL_RETINA_MICROGLIA)27 as a reference, we removed the 14 overlapping genes from the SenMayo panel. GSEA for this SenMayo-reduced gene set was performed, which resulted in the same enrichment pattern in which we found that retinal glia and ECs & Pericytes had the highest SenMayo (SenMayo-reduced panel) enrichment scores (Supplementary Fig. 2d). To further verify our results, we performed enrichment analysis on another large independent dataset- the mouse retinal atlas from Rui Chen lab (Supplementary Fig. 2g). Here too the SenMayo and the SenMayo-reduced gene panels highlighted glial cells, ECs and Pericytes (Supplementary Fig. 2h, j). Microglial cells scored the highest SenMayo enrichment scores among the cell types (Supplementary Fig. 2i). The various senescence gene panels used here were derived from different experiments and backgrounds and when comparing these different panels, we only detected minimal overlap of the genes, thus strengthening our findings (Supplementary Fig 8a). We performed cell-cell interaction analysis in our dataset since it is known that senescent cells have a paracrine influence on their neighbouring cells28. Cell-cell interaction analysis of our mouse retina dataset revealed extensive interaction amongst the SenMayo-hi cells themselves and retinal glial and vascular endothelial cells. Interactions were also observed between SenMayo-hi cells with other neuronal cells such as BCs and cones, although to a lesser extent (Fig. 1f, Supplementary Fig. 2e, f). Interaction pathways include neuromodulatory and neuroinflammatory pathways such as pleiotrophin (PTN), prosaposin (PSAP) and neural cell adhesion molecule (NCAM), Midkine (MK) (Fig. 1f). PSAP29, MK30 and PTN31 for example are senescence modulating factors and can contribute to SASP factor production.

a UMAP plot of murine retina samples collected from 3-, 12-, and 24-month-old mice representing an ageing series. Cells detected include neurons such as Rods, Cones, Retinal Ganglion Cells (RGCs), Bipolar cells (BCs), Amacrine Cells (ACs), Horizontal cells (HCs), glia including Mueller Glia (MG), Astrocytes (Asc) and Microglia (Mic), Endothelial cell, Pericytes (ECs & Pericytes) and retinal blood cells (Ret blood). b Density plot showing the cell type distribution of SenMayo gene panel enrichment scores obtained using the escape package. Mic cells score the highest. c UMAP highlighting the SenMayo-hi cells, which correspond to Mac, Mic, Asc and Endothelial cells. d Percentage of SenMayo-hi cells per cell type. e SenMayo-hi cells also score high for GenAge and CellAge. Inset- Violin plot shows the upregulation of Tgfb2 gene expression in SenMayo-hi cells in the mouse retina. f Chord diagram representing ligand-receptor (L-R) signalling pathways in the mouse retina, that includes signalling both from and to the SenMayo-hi cells. These cells mainly interact with themselves, suggesting a strong signalling network within this category.
SenMayo-hi microglia in the mouse retina has the potential to attract immune cells into the retina
Immune cell attraction (“Leukocyte Cell-Cell Adhesion”, “Leukocyte migration”, “Mononuclear cell migration”,” Monocyte Chemotaxis”) and activation (“Macrophage activation”, “T cell activation”) were among the most enriched biological processes (GO-BP) in SenMayo-hi microglial cells (Fig. 2a, b, Supplementary Table 4a), highlighting the role these cells play in immune cell infiltration into the retina.
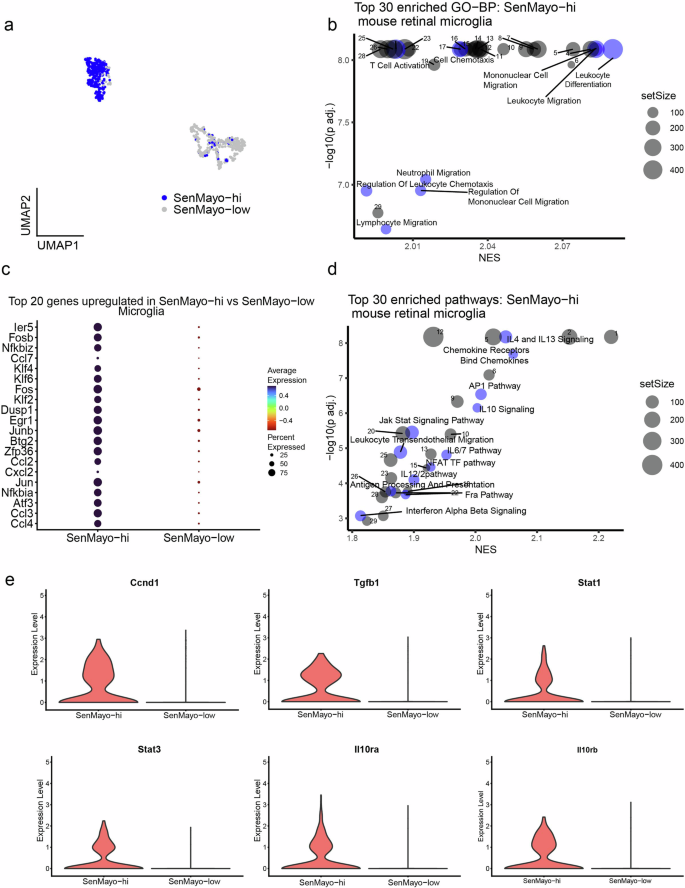
a UMAP plot of SenMayo-hi cells in the Mic subcluster. b Top 30 enriched biological processes (BP) in SenMayo-hi Mic, with senescence and immune response-related processes highlighted in blue (FDR < 0.01). See the Supplementary Table 4a for a full list. c Top 20 genes upregulated in the SenMayo-hi Mic (vs SenMayo-low Mic). d Top 30 enriched pathways in SenMayo-hi Mic with senescence-related pathways highlighted in blue (FDR < 0.01). See the Supplementary Table 4b for a full list. e Violin plots depicting increased expression of genes related to AP1 pathway, IL4/13 and IL10signalling in SenMayo-hi Mic.
Among the top upregulated genes in the SenMayo-hi microglia (compared to SenMayo-low microglia), we observed genes from the Jun/Fos transcription factor family such as Jun and Junb32 as well as other genes related to inflammation and senescence regulation such as Nfkbia33, and Neat134. (Fig. 2c, Supplementary Table 3). Pathway analysis in SenMayo-hi microglia revealed enrichment of interleukin signalling including IL4, 6, 10, 12 and 13, AP1 signalling and Nod-like receptor (NLR) signalling that are all known to modulate senescence and senescence activated secretory phenotype (SASP)35,36,37,38,39. (Fig. 2d, Supplementary Table 4b). Tgfb140 and Ccnd1(CyclinD1)41 genes, which are downstream of the AP1 pathway, Il10ra, Il10rb42, Stat143, and Stat344 which control interleukin signalling, were highly expressed in SenMayo-hi microglia compared the SenMayo-low microglia (Fig. 2e, Supplementary Table 3).To further strengthen our findings, we also analysed the retinal microglia dataset from the Saban lab and found that the SenMayo-hi microglia from these datasets also showed enrichment for IL4/13, IL10, NLR as well as the AP1 signalling pathway (Supplementary Table 12).
SenMayo-hi Mueller glia in the mouse retina are in a highly activated state
GO-BP analysis of SenMayo-hi Mueller glia (Fig. 3a) indicated that they are in an activated state- “Gliogenesis”, “Glial Cell differentiation”, “Astrocyte differentiation” (Mueller glia are very closely related to astrocytes45,46) and have the potential to activate retinal microglia – “Microglial cell activation”. TGF-β signalling and SMAD protein signal transduction, which are involved in SASP factor signalling, were among the enriched pathways24 (Fig. 3b, Supplementary Table 6a). Among the top DEGs, we once again observed several members of the Jun/Fos family, such as Jun, Fos, Fosb, and other senescence modulators such as Ccn147 and Timp348 (Fig. 3c, Supplementary Table 5). AP1 pathway is similarly enriched in SenMayo-hi Mueller glia (Fig. 3d, Supplementary Table 6b). Other pathways such as the NFAT pathway49, IL-4/13 signalling36,50,51 and IL6 signalling35,36 are also known to play a role in senescence (Fig. 3d, Supplementary Table 6b). Genes such as Ccnd141, Cdkn1b52,53 (p27Kip1) which are related to AP1 and Stat1/354,55, Il1856,57, and Anxa158 (Annexin A1) which are involved in interleukin signalling are more highly expressed in the SenMayo-hi cells compared to the SenMayo-low Mueller glia (Fig. 3e, Supplementary Table 5). Though astrocytes, the other macroglial cell type found in the retina were highly enriched for SenMayo-hi cells, they were detected at low numbers that did not yield itself to statistically significant results.
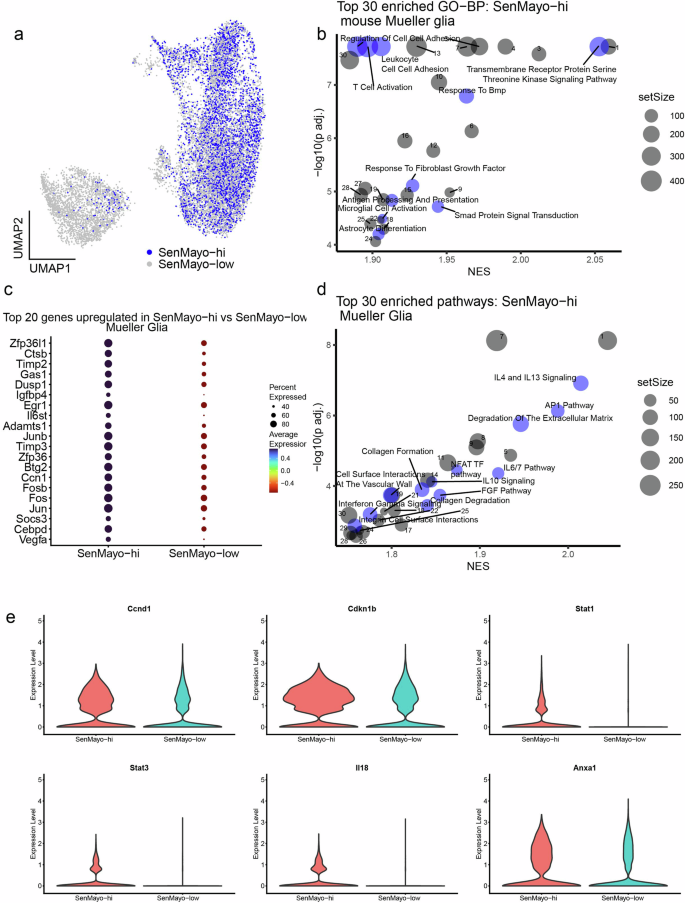
a UMAP plot of SenMayo-hi cells in the MG subcluster. b Top 30 enriched biological processes (BP) in SenMayo-hi MG with senescence and glial response processes highlighted in blue (FDR < 0.01). See the Supplementary Table 6a for a full list. c Top 20 genes upregulated in the SenMayo-hi MG (vs SenMayo-low MG). d Top 30 enriched pathways in SenMayo-hi MG with senescence-related pathways highlighted in blue (FDR < 0.01). See the Supplementary Table 6b for a full list. e Violin plots depicting increased expression of genes related to AP1 pathway and interleukin 4/13 signalling in SenMayo-hi MG.
Human retinal glia is also highly enriched for the SenMayo gene panel
We analysed a published human retina dataset with around 74,000 cells (GEO: GSE148077)59 and successfully annotated the various retinal cell types. (Fig. 4a, Supplementary Fig. 3d–f). Similar to the mouse retina dataset, glial cells score high for the SenMayo panel (Fig. 4b). Enrichment scores in the glial cells and endothelial/pericytes were among the highest and the retinal neurons scored much lower (Fig. 4b). Since the microglia scored the highest, scores of this subcluster were used to set the threshold for SenMayo-hi cells (Fig. 4c), which were bimodal like the mouse microglial cells (Supplementary Fig. 4a, b). Microglia (~88%) once again have the highest percentage of SenMayo-hi cells (Fig. 4d). This is followed by endothelial cells (ECs) and pericytes (78%), Asc (54%), MG (17%), ACs (0.62%), RGCs (0.33%), HCs (0.21%), BCs (0.2%), Cones (0.18%), Rods (0.015%) SenMayo-hi cells are enriched for GenAge and CellAge gene sets (Fig. 4e) and also for key senescence-related genes such ah as MIF and AXL (Fig. 4f). Similar to the mouse gene sets, there was little overlap between the different ageing and senescence gene panels used for the human data (Supplementary Fig 8b). Like in the mouse dataset, neuroinflammatory and neuromodulatory pathways were key among interactions between SenMayo-hi cells and other retinal cells. Various key cell-cell communication pathways detected in the mouse retina such as PSAP, PTN and NCAM were also identified in the human retina. SPP1 (Osteopontin) was a key interaction partner within the SenMayo-hi cells (Supplementary Fig. 5c).

a UMAP plot depicting cell types in the human retina59 (GEO: GSE148077). Cells detected include Rods, Cones, Retina Ganglion cells (RGCs), Bipolar cells (BCs), Amacrine cells (ACs), Horizontal cells (HCs), Mueller glia (MG), Astrocytes (Asc), Microglia (Mic) and Endothelial cells & Pericytes (ECs and Pericytes). b SenMayo enrichment score (ES) distribution in the human retina by cell type. c UMAP plot of human retina depicting SenMayo-hi cells. Mic cells score the highest. d Percentage of SenMayo-hi cells in different cell types in the human retina. e SenMayo-hi cells also score high for GenAge and CellAge gene sets. f Violin plots show the upregulation of MIF and AXL in SenMayo-hi cells in the human retina.
Interleukin and AP1 signalling pathways are conserved in mouse and human SenMayo-hi retinal microglia
Comparison of gene expression changes of SenMayo-hi glial cells (microglia and Mueller glia) in human and mouse retina showed a good correlation of DEGS (Fig. 5a, b). In retinal microglia, apart from some AP1 transcription factor genes that were upregulated in both human and mouse, we identified genes such as Gpr18360, Cited261, Mcl162 and Cd8363 that are involved in senescence and inflammatory regulation (Fig. 5a). Similarly in the Mueller glia, a number of genes upregulated in both mouse and human SenMayo-hi cells, were positive and negative regulators of senescence, several of which were related to the ECM maintenance64 such as Mmp14, Adamts1 and Sparc65,66,67,68 (Fig. 5b).
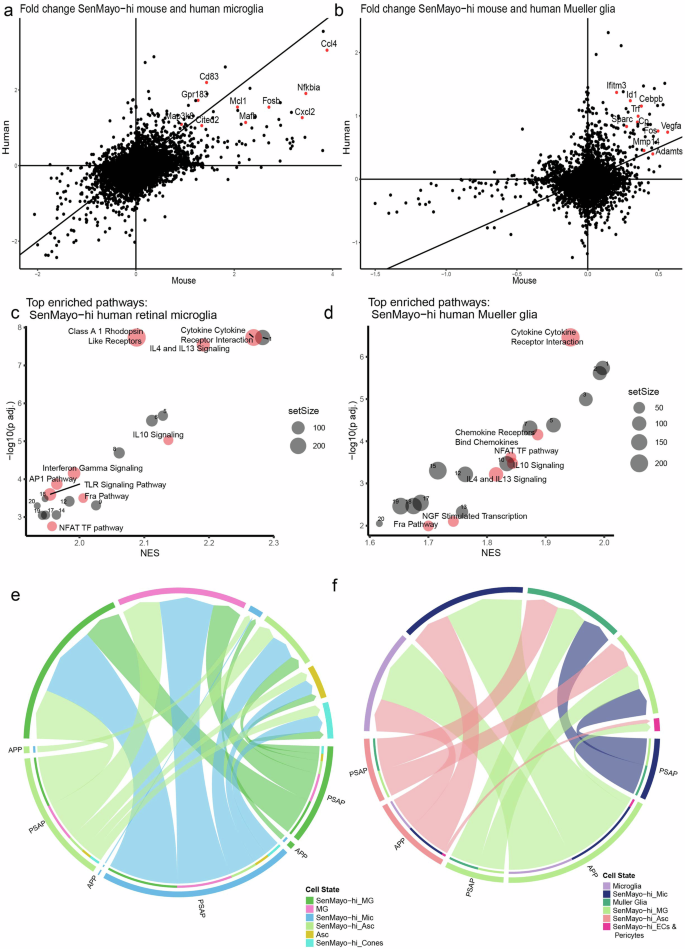
a Scatter plot comparing log fold change of genes in SenMayo-hi microglia (Mic) (against SenMayo-low Mic) in mouse and human retina. b Scatter plot comparing log fold change of genes in SenMayo-hi Mueller glia (MG) in mouse and human retina (against SenMayo-low Mueller glia). c Dotplot of enriched pathways in human SenMayo-hi Mic with pathways that are also enriched in mouse Mic highlighted and labelled in red (FDR < 0.01) See Supplementary Table 9a for a full list. d Dotplot of enriched pathways in human SenMayo-hi MG with pathways that are also enriched in mouse MG highlighted and labelled in red (FDR < 0.01) See Supplementary Table 9b for a full list. e and f Selected common interaction pathways in mouse and human SenMayo-hi cells include APP and PSAP pathways. In both e mouse and f human many interactions of SenMayo-hi cells include signalling to other SenMayo-hi glia.
Pathways that were commonly enriched in SenMayo-hi microglia across species included key interleukin signalling pathways such as IL4/13, IL10 and AP1 signalling (Fig. 5c, Supplementary Table 4b, 7a), which were also enriched in the SenMayo-hi retinal microglia from the Saban lab dataset (Supplementary Table 12). SenMayo-hi human and mouse Mueller glia and SenMayo-hi human astrocytes also showed enrichment for IL4/13 and IL10 signalling (Fig. 5d, Supplementary Fig. 5a, Supplementary Table 6b, 7b, 7c). Other pathways which can promote senescence and are conserved in microglia across species are NFAT pathway49,69 and FRA pathway70 (Fig. 5c, Supplementary Table 7a).
Since some microglial AP1 pathway genes have been implicated to be activated during tissue dissociation71, we removed these genes from the list of all genes expressed in retinal microglia in our dataset, human retina and Saban mouse retinal microglia and re-ran the GSEA pathway analysis and did not detect any significant changes to our previous results. Both AP1 pathway and interleukin 4/13 and 10 signalling were still highly enriched in the SenMayo-hi microglia of these datasets (Supplementary Table 13).
Cell-cell communication pathways were also conserved in mouse (Fig. 5e, Supplementary Fig. 5b, d) and human (Fig. 5f, Supplementary Fig. 5c, e) retinal SenMayo-hi cells. These include the amyloid precursor pathway (APP) which shows ligand-receptor (L-R) interaction from SenMayo-hi Mueller glia and astrocytes to SenMayo-hi microglia and the prosaposin pathway (PSAP) which communicates from SenMayo-hi Mueller glia/ astrocytes and microglia to SenMayo-low Mueller glia (Supplementary Fig. 5d, e).
Impact of advancing age on the SenMayo panel expression
In both the human and mouse datasets we focussed on the SenMayo-hi glia cells to determine whether there was an increase in SenMayo enrichment score with age. In our dataset (Fig. 6a) as well as in the two independent retinal datasets (Saban lab- Supplementary Fig. 6a, b, Chen lab, mouse retina atlas, Supplementary Fig. 6c, d), there was no increase in SenMayo enrichment scores with age in the mouse microglia. Similarly, no trend was observed in mouse Mueller glial cells with age (Fig. 6b). In addition, none of the retinal neurons showed an increase in SenMayo enrichment score with age (Supplementary Fig. 7). In comparison, human retinal samples showed significant increase of senescent cells with age. SenMayo-hi human microglial cells show a significant increase in SenMayo enrichment scores with age (Fig. 6c), while Mueller glia shows a significant increase of senescent scores in cells derived from both the 60 and 70 age group in comparison to the cells derived in the 50 s age group (Fig. 6d). CCL4, CXCL8, IL1B, ICAM1 are among the SenMayo genes driving the age-related increase of senescence scores in human retina microglia (Fig. 6e) and JUN, IGFBP5, DKK1, GEM and CXCL12 appear to be increasing with age in Mueller glia (Fig. 6f). We also evaluated the link between ageing and senescence gene expression in other mouse tissues using public single-cell mouse datasets. As observed in the retina, brain microglia also score highly for the SenMayo panel, as observed in an ageing mouse brain dataset from the Peng lab (Supplementary Fig. 6e). Unlike retinal microglia, brain microglia show a significant increase in SenMayo scores at 24 months of age (Supplementary Fig. 6f). This is more evident in another ageing brain microglia series comprising 3-, 14- and 24-mo samples (Supplementary Fig. 6g, h). To understand the relevance of SenMayo enrichment with ageing in non-CNS tissue, we analysed various other mouse non-CNS datasets. In mouse livers, Kupffer cells, the resident macrophage, scored highest for SenMayo enrichment scores (Supplementary Fig. 6i) showing a significant increase in SenMayo enrichment scores in Kupffer cells only from 30mo livers compared to even 24-mo livers (Supplementary Fig. 6j). In accordance with the literature72, mouse adipose tissue did not show and age-related enrichment of senescence (Supplementary Fig. 6k,l).
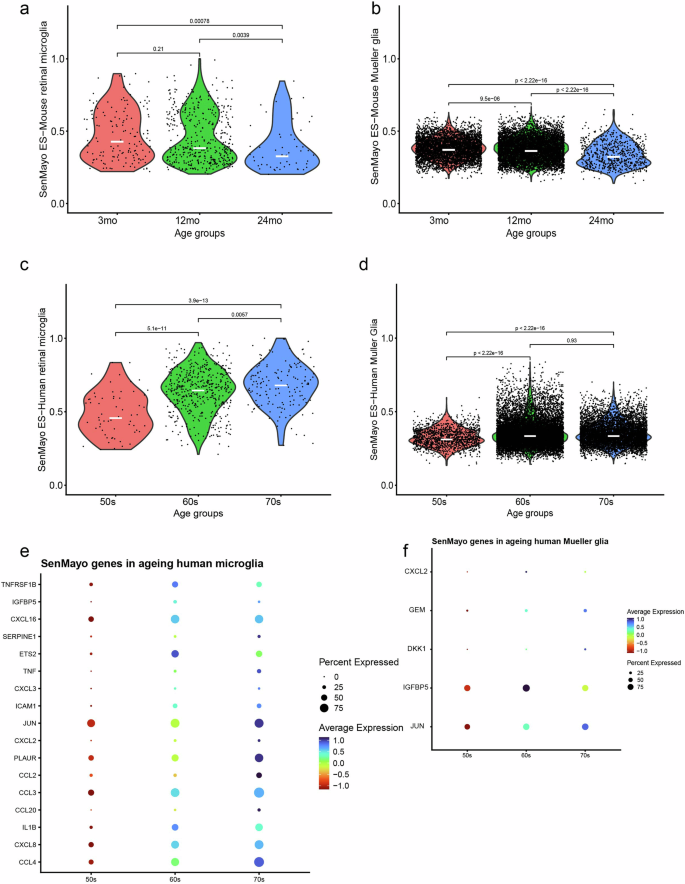
SenMayo enrichment scores (ES) in the a mouse microglia and b mouse Mueller glia clusters show no trend to increase with age. Increased SenMayo enrichment scores with age in c human microglia (significant increase) d Mueller glia (significant increase between both 60 s and 70 s vs 50 s). SenMayo genes that are increased with age in e human microglia and f Mueller glia.
To analyse other age-related changes in different mouse retinal cell types, we performed differential gene expression analysis in various retinal cell types (rods, Mueller glia, cones and bipolar cells), comparing 12- and 24-mo cells to 3-mo cells. IPA analysis of the DEGs was conducted (Fig. 7, Supplementary Tables 8–11). Reduction of synaptic signalling pathways was apparent, especially in the bipolar cells (e.g., glutaminergic and adrenergic), but also general synaptic long-term depression in the rods and cones, and Mueller glia pathways pointed towards reduction of neuroprotective and regenerative potential of Mueller glia as well as with age73,74.
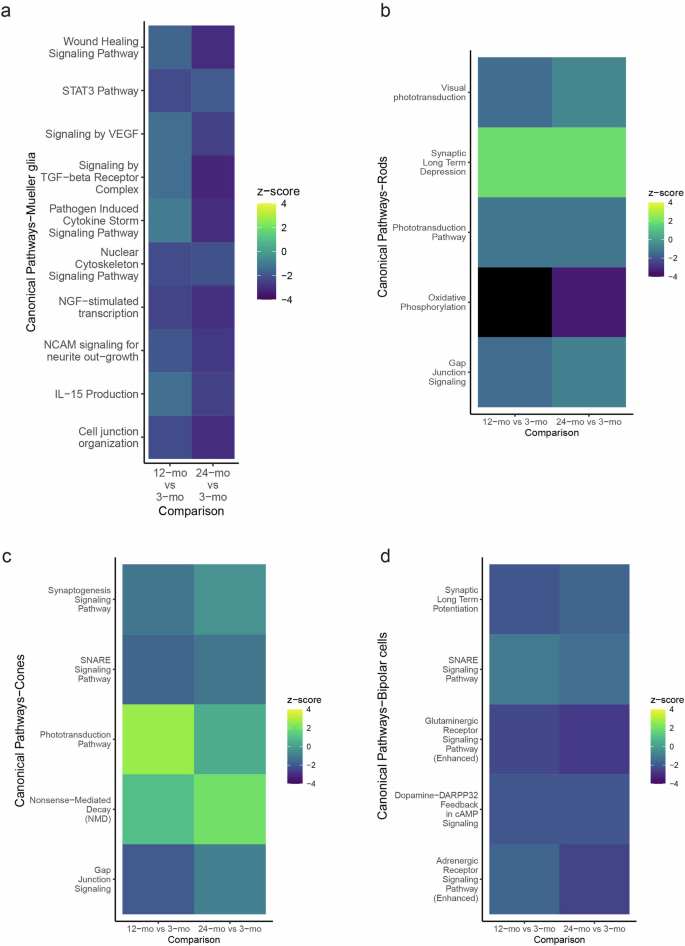
IPA canonical pathway comparison analysis of DEGs from 12-mo vs 3-mo and 24-mo vs 3-mo a Mueller glia, b rod photoreceptors c cone photoreceptors and d Bipolar cells (p-value < 0.05).
Discussion
In summary, our study explored gene expression data using single-cell RNA-seq to identify the signatures of senescence in mouse retina during normal ageing. We additionally compared transcriptomic datasets for the mouse and human retina using the recently published SenMayo transcriptomics panel. Both retinal microglial and macroglial cells (Mueller glia and astrocytes) were highly enriched for the SenMayo senescence gene panel. Our age-related analysis showed an increase of retinal glial senescence during ageing in the human retina, which was not apparent in the mouse retina up to age 24 months but interestingly was present in the ageing murine brain microglia. Interleukin signalling via Il 4, 13 and 10 signalling and the AP1 pathway were identified as conserved pathways in the senescent glial cells in mouse and human retina.
As in the rest of the CNS, glial cells play a major role in retinal health and homeostasis. Microglial cells with support of the macroglia cells are the major components of the retinal immune system75,76,77. Transcriptomic signatures of senescence in microglial and to a slightly lesser extent in macroglial cells increased in the ageing human retina and murine brain, however not in the murine retina. The increase of senescent microglia in the ageing brain has been demonstrated previously and has been postulated to be a major contributor to age-related neurodegenerative diseases, and thus potential therapeutic targets78,79,80,81,82. In comparison to the brain, microglial senescence in the retina has been less well studied. Retinal microglia show age-related changes in motility and morphology which has been discussed in the context of the senescence of these cells83 and senescence-related human microglial signatures have been linked to age-related macular degeneration84. Recent studies demonstrate significant differences in scSeq signatures between the murine brain and retinal microglia. Retinal microglia exhibited a more pro-inflammatory signature than brain microglia, which could explain opposing effects of the same microglial signals in the brain and the retina85. Human and murine microglial signals are largely conserved86, however, as microglia are highly dependent on their microenvironment, differences in senescence signatures with age could potentially be enhanced in humans living in non-controlled environments and potentially unhealthy lifestyle choices in comparison to healthy laboratory mice subjected to the standardised environment.
Interestingly, clear evidence of SenMayo-hi senescent transcriptomics was seen in the microglia and macroglia of the retina – and the brain – of young mice. As many inflammatory markers released by microglial and macroglial cells overlap with the SASP signature, inflammatory changes could provide an alternative explanation for the detection of SenMayo-hi glial cells across all ages. We do however also detect enrichment of SenMayo gene panel independent senescence markers including Tgfb225,87,88 in our SenMayo-hi cells and further senescence hallmarks such as enrichment of cell cycle arrest genes and a shift towards replicative arrest in SASP-rich cells detected as senescent by the SenMayo panel have been previously demonstrated, strengthening the likelihood that these cells are truly senescent6. As senescent cells also hold beneficial roles in various tissues and circumstances such as enhancement of cell plasticity or adaptive processes, this could explain the presence of senescent cells in younger tissues. However, this aspect of senescence is currently still widely understudied and needs to be researched in greater detail89,90,91. Other than paracrine signalling for example via SASP, autocrine signalling is a well-described phenomenon in senescent cells. This was also apparent in the senescent retinal microglia and macroglia. Looking more specifically into genes and pathways regulated in the SenMayo-hi senescent glial cells in our datasets, we identified that IL-4/13 and IL-10 signalling and respective up and downstream molecules were enriched in all the analysed senescent glial cells- microglia and Mueller glia from the retina and brain microglia. Next to their relevance in inflammation, IL-4,10 and 13 are known to drive senescence in various contexts and cell types35,50,51,92,93,94,95,96,97. AP1 pathway, and in particular Jun and Fos family members, was enriched in both the mouse and human senescent SenMayo-hi microglial cells in both the retina and the brain. In brain microglia, the AP1 pathways are not only activated with ageing but also promote accelerated microglial activation after injury98. It is regarded as a key transcriptional driver of senescence37 and downstream elements such as Cdkn1b (p27) and CyclinD1, both upregulated in the SenMayo-hi senescent retinal glial cells, are known to be upregulated in senescent cells and also promote senescence52,53,99,100,101. The AP1 family can not only drive cellular senescence such as oncogenic and replicative senescence37,38 but also plays a role in inflammageing, where an upregulation of the AP1 family members Jun and Fos has been observed102. Interestingly, co-expression analysis of the SASP cluster in the original paper characterising the SenMayo Panel revealed a strong correlation between JUN and classical senescence marker CDKN2A/p16INK4a and therefore suggests this gene as a potential marker for senescence6. A recent meta-analysis identified key pathways and proteins related to different stages of senescence and senescence stressor types35. Enrichment of pathways such as AP138, IL4/1335 and pathways related to ECM reorganisation35 in SenMayo-hi glia in the retina potentially implies that they are in the late stage of senescence and replicative senescence is the potential stressor involved. With the growing interest in retinal ageing and retinal transcriptomics, we could perform such comparative analyses of senescence signatures in the retina in future.
Potential weaknesses exist with regard to this analysis. We only aged mice to 24 months of age and senescence may increase more rapidly above this age in the retina. Our analysis of liver Kupffer cells revealed that SenMayo panel scores were significantly higher in 30-mo mice compared to 24-mo animals, and future analysis of older mouse retina would be necessary to determine if a similar acceleration in senescence is seen observed. Studies show that brain microglial cell single-cell transcriptomics analysis can be particularly sensitive to variations in experimental preparation procedures, which can influence the transcription levels of various intermediate early genes such as Jun, Fos, Egr171. Removing these genes from the SenMayo panel had no influence on our results, however, this aspect should be taken into consideration when analysing microglial transcriptomics and when comparing different datasets. We further acknowledge that future mechanistic investigations are necessary to better our understanding of IL-4,13, IL10 and AP1 pathways and their role in retinal glial senescence.
With this early look into the ageing retinal panel, we show that the SenMayo panel allows transcriptomic evidence of senescent microglia and macroglial cells in the human and mouse retina and shows an apparent increase in glial senescence in the human retina with age. Interleukins 4, 10 and 13 appear to be relevant players in retinal glial senescence and the AP1 pathway in retinal microglial senescence is also implicated across species. Application of the SenMayo gene sets to future human glaucoma single-cell datasets and mouse retinal injury models could possibly help parse the link between this disease and senescence established by GWAS studies.
Materials and methods
Animal strain and husbandry
All animal procedures conformed to the ARVO Statement for the Use of Animals in Ophthalmic and Vision Research and were approved by the SingHealth Institutional Animal Care and Use Committee (2019/SHS/1534). Male and female C57BL/6J mice (NNT mutation-positive) at 3 and 12 months of age were purchased from InVivos Pte Ltd, Singapore, and housed at the SingHealth Experimental Medicine Centre (Academia, Singapore) in a temperature- (22 ± 1 °C), light- (12 h light, 12 h dark) and humidity-controlled (30–40%) environment with free access to food and water. Mice were aged from 12 months to 24 months of age within the Animal facility of SingHealth Experimental Medicine Centre.
Single-cell isolation
2 non-injured retinae were collected from C57BL/6J mice per condition. Retinal tissue was digested using the papain dissociation system (Worthington) following the manufacturer’s protocol. Cells were passed through a 30 µm filter (Miltenyi) to obtain a single-cell suspension. Following this different magnetic activated cell sorting methods (MACS®) enrichment/depletion methods were used on the cell pool collected. ACSA-2 and Thy1.2 enrichment: Cell pool was enriched for RGCs and macroglia using Thy1.2 and ACSA-2 (astrocyte cell surface antigen-2) antibodies respectively. Two retinas from 2 mice per age group were pooled for this method – 3-month (young), 12-month (middle-aged) and 24-month-old (old). CD73 depletion: The cell pool was depleted of rod photoreceptors using the CD73 antibody. Retinae from four 12-mo mice were prepared this way (2 retinas per pooled for each replicate). Thy1.2 enrichment and CD73 depletion: Cell pool was split into two halves and each half was subjected to either Thy1.2 enrichment or CD73 depletion. Following this, the two portions were combined again. Two retinas from 2 mice per age group were used for this method – 3-mo and 12-mo.
Single-cell sequencing
10,000 cells per sample were loaded onto Chromium Next GEM Single-Cell 3′ Kit v3.1 (10x Genomics), and libraries were generated in-house using the Chromium Controller (10x Genomics). Sample QC was performed at relevant steps following the manufacturer’s protocols. The samples were sequenced on the Illumina HiSeq150 platform. FASTQ files were aligned to the mouse transcriptome mm10 with the counts function of 10x Genomics Cell Ranger 6.0.2 and analysis of the filtered counts was performed with Seurat v4 (4.1.1)103.
Analysis of in-house transcriptomics data
The dataset comprising 2 replicates for 3-mo, 4 replicates for 12-mo and 1 replicate for 24-mo retina was integrated using the Seurat canonical correlation analysis (CCA) method. After quality control of the merged datasets, the following cells were retained: percent.mt <50% & >200 nFeature_RNA & <3500 nFeature_RNA104,105 (Supplementary Fig 1). Log normalisation was performed with the scale factor set as 10,000 (default Seurat settings) following which 2000 highly variable features were identified. Integration was performed and 50 principal components (PCs) were used for clustering (k nearest neighbours graph-based clustering) and dimensional reduction via uniform manifold projection (UMAP) was performed. Clustree package (v0.4.4) was used for optimal cluster resolution106 (Supplementary Fig 1f, g). We annotated the cells using an established panel of retinal cell type markers (Fig. 1a, Supplementary Table 1)107.
After clustering and annotating for cell type, we performed gene set enrichment analysis (GSEA) using the enrichIT function of the R package escape (v1.9.0)108 for the following datasets- SenMayo6 (mouse), GenAge, CellAge22,23,109, Cherry_202326 and SenMayo panel without microglial genes (SenMayo-reduced) (Supplementary Table 2). GenAge was published in 2009 based on a meta-analysis of 127 publicly available microarray and RNA-Seq datasets from mice, rats and humans23 whereas CellAge was manually curated based on data derived from gene-manipulation studies in various human cell types22. The 862 gene containing Cherry_2023 panel was derived from a murine foreign body driven fibrosis model in p16 expressing cells26. For our analysis, we used the genes derived from the differential gene expression analysis derived from the bulk RNA sequencing performed by the authors and chose those genes upregulated in the p16+ stroma with a false discovery rate (FDR) of <0.05. To ensure that the panel is not falsely detecting microglial cells, we created a SenMayo-reduced dataset which was derived by removing all genes from the SenMayo panel that were part of the HU_FETAL_RETINA_MICROGLIA gene set (M39266) from Molecular Signatures Database (MSigDB)27,110,111. These datasets served as independent controls. All gene lists used can be found in Supplementary Table 2. The enrichment scores for the SenMayo gene panel were calculated and to determine which cells scored highest, we plotted density graphs (Fig. 1b). We observed that the SenMayo score distribution in the microglial cells was the highest, they were used to set the threshold for SenMayo-hi scoring cells. The mixtools (v2.0.0)112 R package was used to resolve the bimodal distribution of SenMayo enrichment scores in the microglial cluster (Supplementary Fig. 2a, b). We determined the intersection point of the two clusters as threshold by which cells were either classified as SenMayo-hi or SenMayo-low (Fig. 1c), which then led to a high correlation of the SenMayo-hi cells with the independent ageing control panels (Fig. 1e). After calculating fold changes of all expressed genes in different comparisons using Seurat “FoldChange”, the results were passed onto the package clusterProfiler (v4.2.2)113 to perform GSEA using the MSigDB collection to identify pathways and gene ontology biological processes and terms with FDR of <0.01 were retained. Top 30 terms (based on normalised enrichment score-NES) were depicted as a dotplot. Differentially expressed genes (LFC of 0.25 and p-value-adj <0.01) were identified with Seurat “FindMarkers”. Cell-cell communication was determined with CellChat package (v1.6.1)114. To account for the possible effect of cell dissociation on microglial gene expression, we removed genes that were identified to be upregulated during this process71 and re-ran GSEA pathway analysis. To determine age-related changes in different retinal cell types, the various cell types were subsetted, “RunPCA” and “RunUMAP” (using 30 PCs) were performed. Differential gene expression change was calculated by comparing both the 12-mo and 24-mo age group to the 3-mo age group which served as the control using Seurat “FindMarkers” (|LFC| of 0.25 and p-value-adj <0.01). IPA (Ingenuity Pathway Analysis- QIAGEN Inc., https://digitalinsights.qiagen.com/IPA)115 was performed with the DEGs from the various cell types and pathway comparison analysis was then performed across ages.
Data retrieval and analysis of publicly available retina datasets
We downloaded the human retinal dataset count files from the GSE148077 dataset deposited within the Gene-Expression Omnibus (GEO) database and analysed this using the same QC parameters as applied for the mouse retinal dataset (Supplementary Fig. 3). The human retinal dataset comprised of 7 donor samples ranging from 53–78 years of age without reported ocular disease. The cause of death was cancer-related in all but one of the donors, where the given cause of death was due to interstitial lung disease. One of the donors was female, all other donors were male. Foveal tissue was analysed from 5 donors, only the peripheral retina for one donor and both the foveal and peripheral retina for another donor. Time from death to tissue process was less than 6.5 h for all but one donor59. We grouped the samples according to age resulting in 3 age groups- 50 s (53yo), 60 s (60, 64, 65, 69yo) and 70 s (74, 78yo) for our age-related analysis of senescence. The datasets were integrated via canonical correlation analysis (CCA) method and 30 PCs were used for clustering and UMAP. A known panel of retinal cell type markers was used to annotate the cells107.
The mouse retinal immune feature barcode matrices were downloaded from the GSE195891 dataset deposited in the GEO database (Supplementary Fig. 6a). After retaining the 2-mo and 24-mo samples, quality control was performed with the parameters used in the original paper: nFeature_RNA >200 & nFeature_RNA <5000 & percent.mt <20116.
The Chen lab mouse retinal atlas was downloaded from the CZ CELL X GENE repository (Supplementary Fig. 2g)117.
Mouse adipose (Supplementary Fig. 6k) and liver (Supplementary Fig. 6i) datasets were downloaded from the Tabula Muris Senis repository118. Brain microglia (GSE207932) and whole brain (GSE208292) datasets from the Peng lab were retrieved from the GEO database119. The escape package was used on all public datasets to obtain gene set enrichment scores for various gene panels.
Statistical analysis
R software (v4.1.0) was used for statistical analysis. For differentially expressed genes in the scRNA seq analysis, the Wilcoxon rank-sum test, with Bonferroni correction (default for Seurat “FindMarkers”) was used and a cut-off of adjusted p-value < 0.01 was set.
To compare the SenMayo enrichment score in various cell types, a two-tailed Wilcoxon rank-sum test was performed, and p-values < 0.05 were considered significant.


Responses