Sequence of episodic memory-related behavioral and brain-imaging abnormalities in type 2 diabetes

Introduction
The global population of adults with diabetes is estimated to be around 536.6 million, with type 2 diabetes (T2D) accounting for 90–95% of cases [1]. Episodic memory decline is a common complication of T2D and leads to difficulties in self-care and social interactions, significantly decreasing the quality of life [2, 3]. However, the neural mechanisms underlying declining episodic memory in patients with T2D remain unclear. Understanding these mechanisms is crucial for early diagnosis and intervention.
Multimodal magnetic resonance imaging (MRI) is one of the primary tools for studying the human brain. Our team has focused on the investigation of brain and cognitive function in patients with T2D using multimodal MRI [4,5,6,7,8,9,10]. Neurobiological studies have demonstrated the importance of the hippocampus-entorhinal cortex (EC-HP) pathway and hippocampus-anterior cingulate cortex (HP-ACC) pathway in memory formation and consolidation [11, 12]. Compared to healthy individuals, patients with T2D have reduced gray matter volume in the HP [13, 14], EC [15, 16], and ACC [17, 18], in addition to abnormal spontaneous neural activity in these regions [4, 7, 19, 20], and decreased functional connectivity (FC) in the HP-ACC pathway [10, 21], all of which are related to memory impairment. However, there is a lack of research on the dynamic progression of memory decline in patients with T2D, which hinders a comprehensive understanding of the underlying neural mechanisms. Longitudinal follow-up studies are challenging due to the slow progression of memory decline in the early stages of T2D.
The event-based model (EBM) is a statistical method that investigates disease progression by simulating the sequences and uncertainty of observable abnormalities from cross-sectional data [22]. Previous studies have successfully applied the EBM to various neurodegenerative diseases, including Alzheimer’s disease [23,24,25], Parkinson’s disease [26], sporadic Creutzfeldt-Jakob disease [27], and genetic frontotemporal dementia [28], and multiple sclerosis [29, 30], indicating that this method is effective and robust. In this study, we utilized a discriminative EBM (DEBM) to track the sequence of abnormalities in behavioral and imaging biomarkers in patients with T2D, because DEBM showed higher accuracy than the existing state-of-the-art EBM methods [27, 31].
Patients with T2D and healthy controls (HC) were recruited and their episodic memory, general cognitive function, and executive function were assessed. After that, MRI biomarkers of the EC-HP pathway and HP-ACC pathway were collected. Subsequently, the DEBM method was used to analyze the order of memory-related biomarker abnormalities. After that, the study investigated the demographic distribution of patients with T2D at different DEBM stages and explored the clinical risk factors associated with the stage. Finally, a series validation analyses were conducted, including the researching specificity to episodic memory, the influence of structural data on functional data, and the robustness of the model. This research provides insight into the neural mechanisms underlying memory decline in patients with T2D and the clinical risk factors influencing this decline.
Material and methods
Subject recruitment and grouping
Subject recruitment
This study is a clinical trial and was registered on ClinicalTrials.gov (NCT02420470). A total of 127 patients with T2D and 73 HC were recruited from either the Endocrinology Department of Tangdu Hospital or the local community (Fig. 1). All participants were right-handed and had completed at least a high school education. Patients with T2D were diagnosed based on fasting blood glucose (FBG) levels ≥ 7.0 mmol/L and/or 2-h blood glucose levels ≥ 11.1 mmol/L after an oral glucose tolerance test, while HC had FBG levels <6.1 mmol/L and 2-h blood glucose levels <7.8 mmol/L after oral glucose tolerance test. Exclusion criteria included other types of diabetes, severe brain diseases, significant psychiatric illnesses, drug abuse, MRI contraindications, and severe hearing loss. Nine patients with T2D and four HCs were excluded due to incomplete neuropsychological assessments, while one patient with T2D and one HC were excluded due to incomplete MRI scans. Additionally, seven patients with T2D and six HCs were excluded due to excessive head motion during their MRI scan (>2.5 mm translation or >2.5° rotation in any direction). Ultimately, the study included 110 patients with T2D and 62 HCs.

After the exclusion of subjects with incomplete neuropsychological assessments, incomplete MRI scan and excessive headmotion during MRI scan, 110 patients with type 2 diabetes mellitus (T2DM) and 62 healthy controls (HC) were finally recruited.
This study was approved by the institutional review board of Tangdu hospital, Air Force Medical University. All the subjects provided written informed consent. All procedures performed in studies involving human participants were in accordance with the ethical standards of the institutional and/or national research committee and complied with the 1964 Helsinki declaration and its later amendments or comparable ethical standards.
Demographic and clinical information
Age, sex, smoking and drinking habits, blood pressure, body mass index (BMI), education levels, and disease duration (for patients with T2D only) were recorded. FBG, hemoglobin A1C (HbA1c), albuminuria, total cholesterol, triglyceride, low-density lipoprotein cholesterol (LDL), and high-density lipoprotein cholesterol (HDL) were assessed at 8:00 A.M. after overnight fasting in the Endocrinology Department of Tangdu hospital. Subsequently, participants with T2D drank a 75 g glucose solution, and postprandial blood glucose (PBG) was assessed at 10:00 A.M.
Assessment of episodic memory, general cognitive function and executive function
The California Verbal Learning Test – second edition (CVLT-II) is a widely used measure of episodic memory. During the assessment, a list of 16 common nouns was read aloud to the subjects, who were then asked to repeat them. Outcomes included immediate recall trials, free and category-cued recall trials after short and long delays (20 min), and recognition trials (see Table S1 for detailed items). Montreal cognitive assessment (MoCA) was used to assess the general cognitive function from comprehensive domains. Stroop color word test (Stroop) was used to measure the selective attention and cognitive flexibility of the brain, in another word, executive function. At the beginning of each trial, a word was display in the presentation panel, and subjects were required to choose a color patch in a functional panel that had the same color with the word. Finally, eleven items were estimated from Stroop (see Table S2 for detailed items).
Principal component analysis of CVLT-II and Stroop outcomes
Principal component analysis was employed to extract the principal components of CVLT-II and Stroop. Varimax rotation was applied to factor loadings of the principal component with eigenvalues greater than 1. An eigenvalue of 1 is proposed as a reasonable lower bound for selecting components in psychology research. Finally, a synthesized score based on all components was calculated to comprehensively reflect memory function or executive function.
MRI biomarkers
Rationale for MRI biomarker selection
Gray matter volume, derived from high-resolution T1-weighted imaging (T1WI), is a common biomarker used to assess brain structure. In this study, gray matter volume was selected as the structural biomarker. The amplitude of low-frequency fluctuations (ALFF), obtained from blood oxygen level-dependent (BOLD) MRI signals, is considered a reliable imaging biomarker for spontaneous neural activity in conditions such as Alzheimer’s disease [32] and mild cognitive impairment [33]. Therefore, ALFF was selected to reflect spontaneous neural activity in the brain. FC is defined as the temporal consistency of BOLD signals between spatially distant brain regions. Since brain function is the interactions between regions rather than the activity of discrete regions, FC is a valuable tool for investigating neural pathways [34]. This makes it suitable for exploring EC-HP and HP-ACC pathways in this research.
MRI data acquisition and preprocessing
MRI data was acquired with a GE discovery MR750 3.0 T scanner (General Electric Medical Systems, USA) using an eight-channel phased array head coil. Foam padding was used to restrict head movement and ear plugs were used to eliminate scanner noise. Detailed parameters of the MRI scanning are described in the Supplementary Material. The preprocessing of T1WI and BOLD data was conducted using the fMRIPrep toolbox (RRID:SCR_016216) [35]. T1WI data was spatially normalized to the Montreal Neural Institute (MNI) space and segmented into gray matter, white matter, and cerebrospinal fluid. The preprocessing procedure of BOLD data included removing the first 10 time points, slice timing, realigning, and normalization to the MNI space. Additional denoising procedures included smoothness (6 mm full width at half maximum of the Gaussian kernel), detrend, and band-pass filtering (0.001–0.01 Hz).
MRI biomarker calculation
The Brodmann atlas was used to extract the imaging biomarkers of the EC (Brodmann area 28) [36], and the ACC (Brodmann area 32) [37]. As the Brodmann atlas only includes cortex areas, the automatic anatomic labeling 3 (AAL-3) atlas was used to extract the imaging biomarkers of the HP (AAL area 37 and 38) [38]. Gray matter volume of the above areas was extracted, and the ALFF of the above areas was calculated before the band-pass filtering procedure (to avoid the influence of band-pass filtering to ALFF) and the FC was calculated by the Pearson correlation coefficient between EC and HP (EC-HP pathway) as well as between HP and ACC (HP-ACC pathways). Finally, six GMV features, six ALFF features, and eight FC features [(1) left EC-left-HP; (2) left EC-right HP; (3) right EC-left-HP; (4) right EC-right-HP; (5) left ACC-left-HP; (6) left ACC-right HP; (7) right ACC-left-HP; (8) right ACC-right-HP] were obtained.
Sequences of behavioral and imaging abnormalities
The theory behind the DEBM method has been detailed in previous publications [27, 31]. In brief, DEBM is a data-driven disease progression model that can estimate the temporal sequence of biomarker abnormality events in a disease from a cross-sectional dataset. Such estimation is feasible in a cohort of subjects encompassing a wide spectrum of disease severity because early biomarkers have a higher prevalence of abnormal values than the biomarkers that become abnormal later. In this work, five CVLT-II principal components, six gray matter volume biomarkers, six ALFF biomarkers, and eight FC biomarkers of all T2D patients were used to fit the DEBM, and the total intracranial volume, age, sex, and education level were adjusted. The model then estimated the sequence in which the above biomarkers became abnormal. The uncertainty of the sequence is estimated using bootstrap (100 times) and Markov Chain Monte Carlo. Along with this process, DEBM also estimated the stage of disease progression for each participant.
Statistical analysis
Statistical analyses were conducted using the Statistical Package for the Social Sciences (SPSS version 20.0). We calculated the mean (standard deviation [SD]) or median (interquartile range [IQR]) of the characteristic information for the total study population. Multivariable linear regression analyses were used to compare the differences in MoCA score, CVLT-II principal components, and Stroop principal components between the T2D patients and the HC groups. Analyses were adjusted for baseline age, sex, and education level. The differences between stages of disease progression estimated by DEBM (DEBM stage) were compared by using a two-sample t-test because covariates had already been adjusted in the process of DEBM fitting. Pearson correlation analysis was used to estimate the association between the DEBM stage and clinical risk factors.
Results
Demographic, clinical information and general cognitive function
Detailed demographic and clinical information are presented in Table 1. For the T2D group, the mean age was 54.74 years (SD 8.72), 24.55% were female, and the mean disease duration was 9.34 years (SD 7.11). For the HC group, the mean age was 50.24 years (SD 7.76) and 24.19% were female. The MoCA score of HC group (26.5 ± 2.35) was significantly higher than T2D group (24.96 ± 2.89, P = 0.042) after controlling age, sex and education level (Table 2).
Memory function assessment and principal component analysis
Detailed information on the CVLT-II assessment of the three groups is presented in Table S1. The Kaiser-Meyer-Olkin test indicated a measure of sampling adequacy of 0.680, and Bartlett’s test of sphericity was found to be significant (P < 0.001), suggesting that the CVLT-II results were suitable for principal component analysis. Four principal components were extracted from the 18 items of the CVLT-II, explaining 70.24% of the variance. The first to seventh items contributed the most to the first component (Memory_1), which reflected immediate recall. The eighth to eleventh items contributed the most to the second component (Memory_2), which reflected short- and long-delayed recall. The twelfth to fifteenth items contributed the most to the third component (Memory_3), which reflected intrusion and repetition. The sixteenth to eighteenth items contributed the most to the fourth component (Memory_4), which reflected long-delayed recognition. A synthesized score (Memory_S) was calculated based on the four above components, providing a comprehensive assessment of episodic memory.
Table 2 showed that the T2D compared with the HC group had a lower Memory_1 (β = 0.177, P = 0.026) and Memory_S (β = 0.157, P = 0.047) after controlling age, sex and education level.
Executive function assessment and principal component analysis
Detailed information on the Stroop assessment of the three groups is presented in Table S2. The Kaiser-Meyer-Olkin test indicated a measure of sampling adequacy of 0.766, and Bartlett’s test of sphericity was found to be significant (P < 0.001), suggesting that the Stroop results were suitable for principal component analysis. Two principal components were extracted from the 18 items of the CVLT-II, explaining 79.29% of the variance. The second and third items contributed the most to the first component (Executive_1), which reflected total false and omission number. The other items contributed the most to the second component (Executive_2), which reflected correct number and reaction time. A synthesized score (Executive_S) was calculated based on the above components, providing a comprehensive assessment of executive function.
Table 2 showed that the T2D compared with the HC group had a lower Executive_2 (β = 0.140, P = 0.032) and Executive_S (β = 0.131, P = 0.046) after controlling age, sex and education level.
Sequence of behavior and imaging abnormality during episodic memory decline
We utilized all patients with T2D to fit the DEBM. Figure 2A, B shows a visualization of the probabilistic sequence of abnormality in behavioral and imaging biomarkers of episodic memory as estimated by the DEBM. In summary, the FC biomarkers showed abnormalities first, followed by memory tests, then ALFF biomarkers, and finally structural biomarkers. The boundaries between the different biomarkers were not always clear; for instance, behavioral biomarkers Memory_4 exhibited abnormalities before the two FC biomarkers, and Memory_2 became abnormal after the six imaging biomarkers.
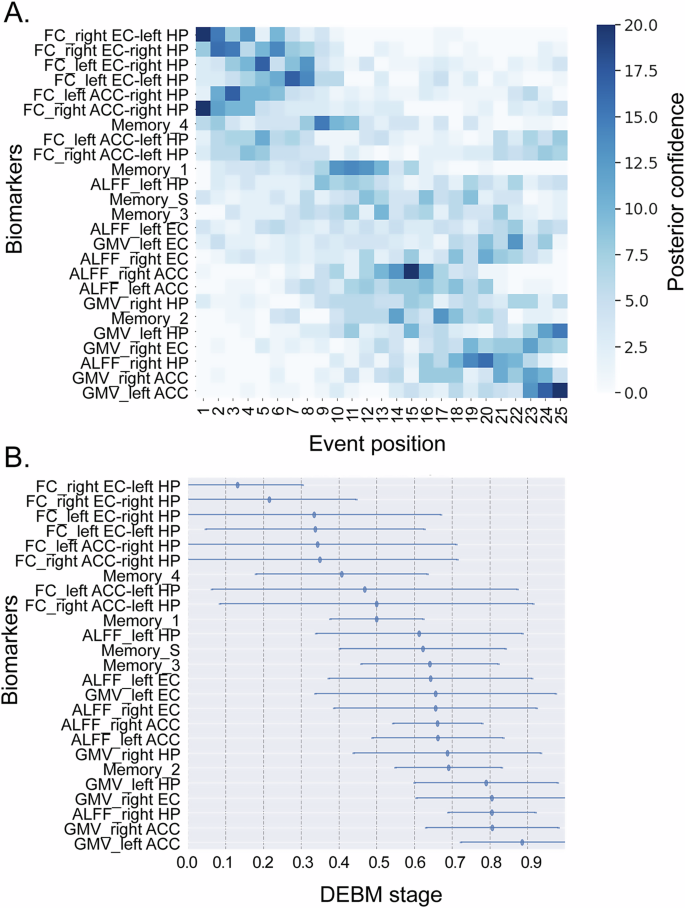
A The color intensity of each square represents the number of bootstrap resampling iterations in which the biomarker was placed at a certain position. The darkest square for each biomarker indicates the position where the biomarker was most frequently placed (i.e., most probable order). B The event center and variance diagram that displayed the estimated stage where the features became abnormal and its variance in the population. Abbreviations: ACC, Anterior cingulate cortex, ALFF Amplitude of low-frequency fluctuations, DEBM Discriminative event-based model, EC Entorhinal cortex, FC Functional connectivity, GMV Gray matter volume, HP Hippocampus, Memeory_1 the first component of CVLT, which reflected immediate recall, Memeory_2 the second component of CVLT, which reflected short- and long-delayed recall. Memeory_3: the third component of CVLT, which reflected intrusion and repetition. Memeory_4: the fourth component of CVLT, which reflected long-delayed recognition; Memeory_S: the synthesized score based on the four above components.
In terms of FC biomarkers, the EC-HP pathway showed abnormalities earlier than the HP-ACC pathway. For behavioral biomarkers, the earliest observed abnormality was in long-delayed recognition (Memory_4), followed by immediate recall (Memory_1), error and repetition (Memory_3), comprehensive memory (Memory_S), and finally short- and long-delayed recall (Memory_2). When considering ALFF biomarkers, abnormalities in the left HP and bilateral EC manifested earlier, followed by bilateral ACC, and finally the right HP. In gray matter volume, abnormalities were first detected in the HP, then the EC, and finally the ACC.
Demographic distribution of patients with T2D at different DEBM stages
To further investigate the DEBM stage, we divided all patients with T2D equally into three groups according to the DEBM stage: the early-stage group (the earliest third of the stages), the middle-stage group (the middle 1/3), and the late-stage group (the latest third of the stages). The demographic distribution of the three groups was then explored (Fig. 3A). Patients with T2D in the middle and late stages were older (F = 5.786, P = 0.004), but there was no difference in the distribution of BMI, sex, or education level between the three groups.
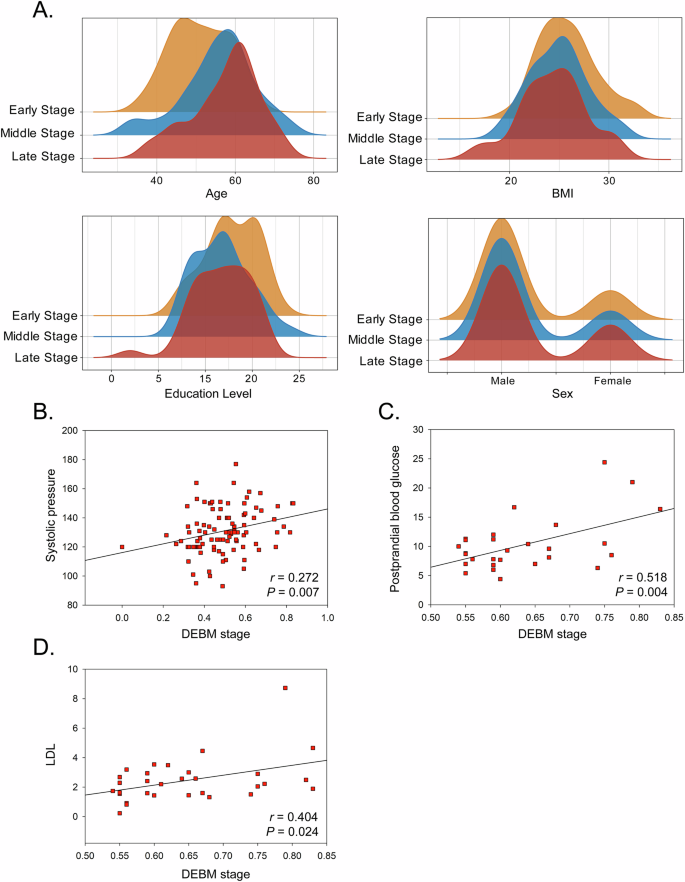
A The demographic distribution of patients with T2D at different DEBM stages. B The association between DEBM stage and systolic pressure in all patients with T2D. C The association between DEBM stage and postprandial blood glucose in patients with T2D at late DEBM stage. D The association between DEBM stage and LDL in patients with T2D at late DEBM stage. Abbreviations: DEBM discriminative event-based model, T2D type 2 diabetes, LDL Low-density lipoprotein cholesterol.
The association between DEBM stage and clinical risk factors of T2D
Figure 3B shows a positive association between systolic blood pressure and the DEBM stage (r = 0.272, P = 0.007). Upon stratifying patients with T2D into three sub-groups based on the DEBM stages, distinct associations were observed. In the early-stage and middle-stage groups, the associations between the DEBM stage and clinical risk factors were not significant. However, in the late-stage group, the DEBM stage was positively associated with PBG (r = 0.518, P = 0.004) and LDL (r = 0.404, P = 0.024) (Fig. 3C, D).
Validation test
The specificity of the research to episodic memory
To validate that our research is specific to episodic memory, we fitted the DEBM only using imaging data. After that, we correlated the stage value (derived from DEBM) with scores of episodic memory test, and we found that the stage value was correlated with Memory_1 (r = −0.365, P < 0.001) and Memory_S (r = −0.223, P = 0.027) but was not correlated with Executive_1 (r = −0.182, P = 0.073), Executive_2 (r = 0.056, P = 0.582) or Executive_S (r = −0.173, P = 0.088). The above findings indicated that the imaging features we selected to fit the DEBM were specific to episodic memory.
The influence of structural MRI features to functional MRI features
We integrated structural and functional MRI features in fitting DEBM, but there may be possible biases introduced by registration procedures (structural data is used in the normalization procedure of functional data) and partial volume effects (for brain regions where atrophy maybe present) may artificially influence the sequence of events detected by DEBM. Consequently, we studied the correlation between structural and functional MRI features, and we found that there was only weak correlation (all r < 0.25) between several pairs of structural and functional MRI features (Fig. S1), which were not significant after multiple comparison correction (Bonferroni method), indication the possible biases introduced by registration procedures should be small. Besides, we orthogonalized the functional and structural data by using Gram-Schmidt orthogonalization (in-house MATLAB code, Supplementary Material) to isolate their unique “pure” contributions and then ran a DEBM with the orthogonal measures. We found that the results were almost the same to our original results (Fig. 4A, B), further indicating that the influence of structural MRI features to functional MRI features could be ignored.
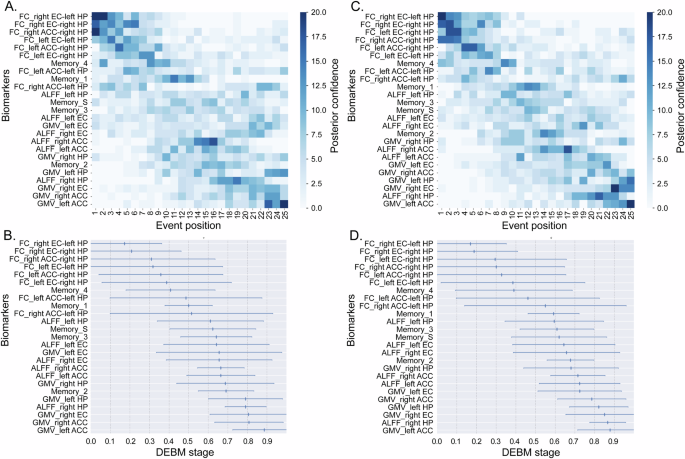
A Gram-Schmidt-orthogonalized MRI features was used in DEBM fitting. The result was closely aligned with our original findings with minor variations. B The corresponding event center and variance diagram. C Both T2D and HC groups were added into DEBM fitting. The result was also closely aligned with our original findings. D The corresponding event center and variance diagram. Abbreviations: ACC Anterior cingulate cortex, ALFF Amplitude of low-frequency fluctuations, DEBM Discriminative event-based model, EC Entorhinal cortex, FC Functional connectivity, GMV Gray matter volume, HP Hippocampus, Memeory_1 the first component of CVLT, which reflected immediate recall, Memeory_2 the second component of CVLT, which reflected short- and long-delayed recall. Memeory_3 the third component of CVLT, which reflected intrusion and repetition. Memeory_4 the fourth component of CVLT, which reflected long-delayed recognition, Memeory_S the synthesized score based on the four above components.
Validation of robustness of the results by adding HC group into the model
To assess the robustness of our findings, we included both T2D patients and HC to fit the DEBM. We did this because the above neural pathways and brain regions are closely related to episodic memory, the damage of which also exists in health aging. Therefore, after adding HC to the model, the sequence of abnormal markers should not change greatly, so as to demonstrate the stability of the model. In consistent with our hypothesis, the new sequence was closely aligned with our original findings with minor variations (Fig. 4C, D).
Discussion
We found that T2D patients exhibited poorer memory, general cognitive function, and executive function compared to healthy controls after controlling age, sex, and education level. In the progression of episodic memory decline, Biomarkers of functional connectivity showed abnormalities first, followed by CVLT-II components, the amplitude of low-frequency fluctuations, and gray matter volume. Besides, entorhinal cortex appeared abnormal earlier than hippocampus and anterior cingulate cortex. Later stage of episodic memory decline was associated with higher systolic blood pressure, postprandial blood glucose and low-density lipoprotein.
Our findings on behavioral biomarkers suggest that immediate recall may be an aspect of episodic memory that is affected by T2D early, while delayed recall impairment occurs at a later stage. Previous studies have also indicated that T2D could affect both immediate and delayed recall [2, 39, 40]. Two studies have shown that T2D patients experienced impairment in immediate recall but not in delayed recall when compared to HCs [41, 42]. This further confirms that immediate recall is impacted earlier than delayed recall. Our DEBM findings also indicate that immediate recall impairment precedes delayed recall impairment, but the delayed recognition (component Memory_4) was the earliest biomarker to appear abnormal, indicating that delayed recognition may be a more sensitive behavioral biomarker than immediate recall.
We found that abnormal neural activity and gray matter volume in the EC preceded those changes in the ACC. In addition, abnormalities in the FC of the EC-HP pathway occurred earlier than those in the HP-ACC pathway. Previous studies have also shown that patients with T2D exhibit reduced EC volume compared to HCs, while ACC remains unaffected [15, 16], suggesting that EC changes may manifest earlier than ACC changes. Further, EC is the brain region that often exhibits the earliest histological alterations in Alzheimer’s disease, including the formation of neurofibrillary tangles and cell death [43]. Besides, neurobiological research has indicated that the EC-HP pathway is crucial for immediate memory formation [11], whereas the HP-ACC pathway is crucial for long-term memory consolidation [12]. Findings of the present and previous studies also support the conclusion that immediate recall abnormalities precede delayed recall abnormalities in patients with T2D.
Functional imaging biomarkers appeared abnormal earlier than structural imaging biomarkers, which aligns with neurobiological studies that show plasticity changes in response to environmental or disease stimuli following a specific sequence [44]. The effects of this typically present as changes in brain function in the initial stages and changes in structure in later stages. Our previous research on sudden deafness also highlighted how disease can induce plasticity changes from brain function to structure [45]. Among the functional biomarkers, FC was the earliest to show abnormalities, indicating that the FC of the EC-HP and HP-ACC pathways is a highly sensitive biomarker for early assessment of episodic memory decline in patients with T2D. However, in comparison to ALFF and gray matter volume, FC exhibited greater variability (Fig. 2B), suggesting that while FC was sensitive, larger sample sizes may be necessary in future studies to minimize variability.
The relationship between the stage of memory decline, as estimated by the DEBM, and systolic blood pressure, PBG, and LDL levels in patients with T2D suggested that vascular risk factors could exacerbate memory decline progression. Past studies have also shown a strong correlation between hypertension and high LDL levels in patients with T2D and memory decline, consistent with our results [46,47,48]. Interventions targeting vascular risk factors in patients with T2D may help slow the progression of memory decline.
There are some limitations in the current research. The data size of this study is relatively small, thus the biomarkers exhibited large variability, which may limit the generalization of our model. Additionally, subject inclusion in this study may not be comprehensive due to the exclusion of patients who were too old or could not complete the CVLT-II assessment (due to low cognitive function), so a pure imaging study that includes patients with the entire spectrum of disease severity may address this issue. Third, due to challenges we encountered during the inclusion process of subjects, there was a lack of relatively older healthy controls. In future studies, we will incorporate more elderly healthy controls to better align with the age distribution of T2D patients.
In conclusion, in patients with T2D, behavioral and brain imaging biomarkers of episodic memory appear abnormal in a specific sequence, and the stage of memory decline was closely associated with old age and vascular risk factors.


Responses