Serologic LSPR-nanosensor against SARS-COV-2 antibodies and related variants outperforms ELISA in sensitivity
Introduction
The COVID-19 pandemic represented the greatest sanitary crisis in mankind’s history since the Spanish Flu pandemic in the early 1900s, causing more than 774 million reported cases and 6 million deaths worldwide1,2,3,4. SARS-CoV-2, the COVID-19 causative agent, has rapidly evolved into new virus variants with increased transmission rates and enhanced ability to evade vaccine immunity5,6. Although vaccines were developed and became available at an unprecedented speed, universal screening and isolation of infected individuals are still valid strategies to prevent the spread of a newly emerging virus with a high rate of genome mutation7.
Since the identification of SARS-CoV-2, a biotechnological race to develop diagnostic tests aiming to detect viral nucleic acids, viral antigens, and specific antibodies to decrease the impact of the disease has started8,9. Quantitative reverse transcription PCR (qRT-PCR) assays have been determined as the gold standard for SARS-CoV-2 detection; however, there are several limitations, such as expensiveness, longer read-out times, as well as the need for complex facilities and trained operators10,11. Additionally, low RNA extraction efficiency, RNA instability, and the location and time of sample collection after the onset of symptoms can lead to false-negative results in up to 41% of diagnostic attempts11,12,13.
Serological assays are advantageous in terms of cost and point-of-care operation, and in a context where most infected individuals are asymptomatic serological testing allows for large-scale access to the immune profile of different populations. Furthermore, antibodies are more stable than viral RNA and less prone to deterioration during sample preparation, transportation, storage, and testing, and therefore suitable for long follow-ups11. Nonetheless, qRT-PCR has gradually been substituted by immunochromatographic tests in most countries, especially after the WHO declared the end of the pandemic. Detection of antigens obviously represents an advantage in diagnosing an acute infection, as antibodies against SARS-CoV-2 are generally detected more than one week after the onset of symptoms14,15, limiting serology’s role in recognizing acute infections. In an evaluation of nine commercial immunoassays for SARS-CoV-2, the authors reported 100% seropositivity in severely ill COVID-19 patients 10 days after the onset of symptoms16, possibly overlooking moderate cases.
In this scenario, nanotechnology has been considered an effective tool to improve the sensitivity of the existing diagnostic methods17,18. As an example, we have been able to serologically differentiate dengue from Zika infections even in the presence of very low molar concentrations of antibodies in patient’s sera, by taking advantage of plasmonic resonance using Gold Nanorods (GNR), functionalized with Dengue virus (DENV) proteins as nanosensors19,20. Here, we used a similar approach for serological detection of anti-SARS-CoV-2 antibodies with a much superior sensitivity than ELISA. Likewise, our analyses revealed that the nanosensor was able to identify qRT-PCR-positive samples at a higher rate than ELISA and distinguish them from uninfected patients. Unfortunately, the specificity of ELISA assays is often low, with false-positive rates of up to 30% have been demonstrated. False negatives can also be frequent in ELISA when the test is performed before the immunological window due to low concentrations of antibodies present in the sample or when there is low affinity for the antibody. In addition, the ELISA immunoassay technique has an average response time of 4 h21,22.
We, therefore, present a diagnostic platform based on computationally guided localized surface plasmon resonance (LSPR) for the detection of specific antibodies targeting the nucleocapsid (N) protein of the SARS-CoV-223. Our GNR-DHLA-N nanosensor is specific and capable of early detection of very low levels of anti-N antibodies in samples from patients with ongoing infections.
Results
Anti-SARS-CoV-2 IgG detection efficacy evaluated in standard serology platforms
A key aspect in the development of a diagnostic assay is having a well-characterized sample bank. For this work, we identified positive patients in the early stages of infection by the gold-standard molecular assay (qRT-PCR). After confirmation, sera were collected after a range of days post-onset of symptoms. We, therefore, formed two sample groups: patients with less than 10 days of onset of symptoms (< 10 days), and patients with at least 10 days of onset of symptoms (≥ 10 days). All sera were evaluated by a dual-path platform assay (DPP rapid test) to characterize seroconversion status. We used 79 negative and 57 qRT-PCR positive samples to evaluate the ELISA diagnostic performance. Overall, the serologic assay presented a specificity of 100% (95% CI: 95.4–100.0), and a sensitivity of 60.3% (95% CI: 53.1–67.1) (Fig. 1A, B). Nonetheless, when including only ≥10 days of samples), sensitivity increased to 93.4% (95% CI: 84.1–97.4) (Fig. 1C, D). Sensitivity reached a peak for samples found positive by the DPP test, achieving a concordance of 97.4% (95% CI: 88.2–97.7) (Fig. 1E, F).
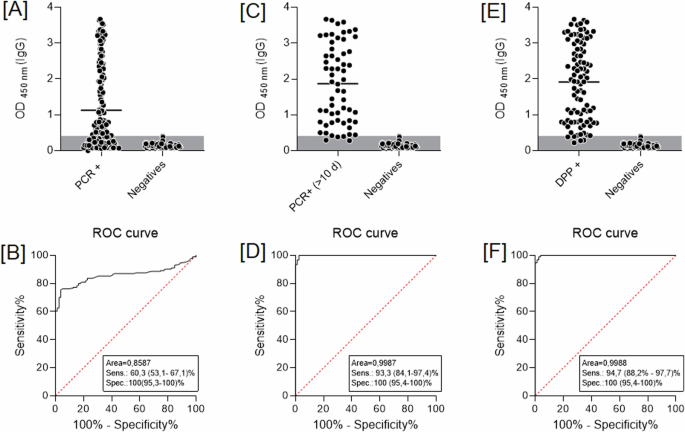
ELISA diagnostic performance considers A samples tested by qRT-PCR; C samples at least 10 days after a positive qRT-PCR result, and E qRT-PCR positive results confirmed by DPP serological assay. B, D, and F represent ROC curves from [A], [C], and [E], respectively. DPP rapid test-dual-path platform.
Construction and characterization of an anti-SARS-CoV-2 nanosensor based on the viral nucleocapsid protein
The LSPR-based nanosensor functionalization strategy (Fig. 2A) consists of the covalent binding of pristine gold nanorods (GNR) (Fig. 2B) to the SARS-CoV-2 nucleocapsid recombinant protein (N) through a carbodiimide-activated amidation reaction. To confirm the formation of the nanocomplex, we performed a range of physicochemical characterizations starting with optical absorption in the UV–Vis spectral region, where the final nanosensor (GNR-DHLA-N) extinction spectrum (blue line) was shifted in comparison to other stages of the construction (Fig. 2C).
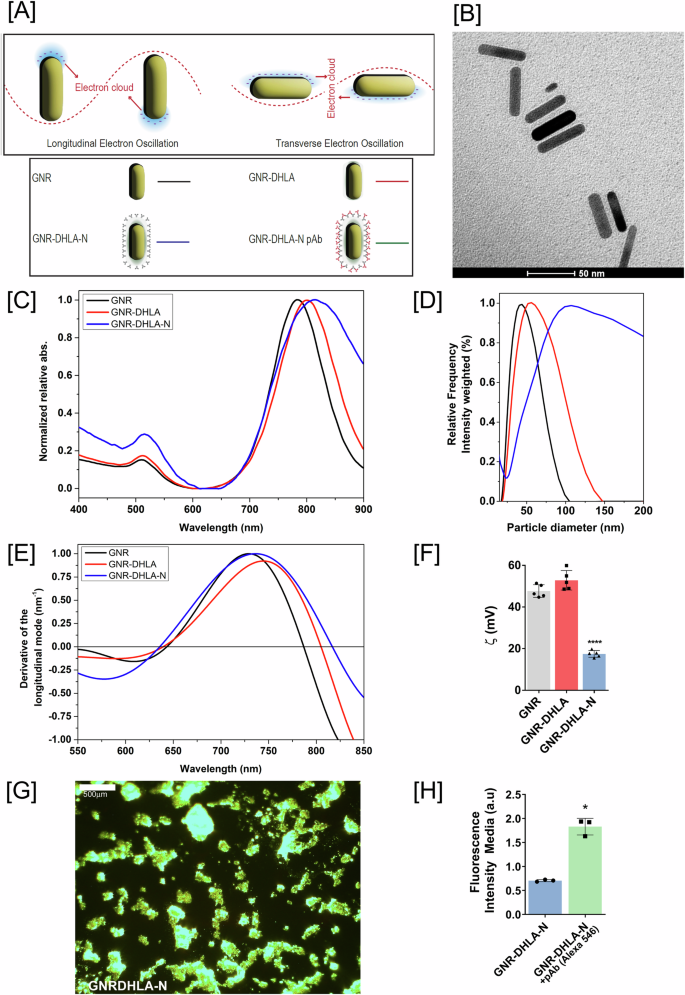
A Graphical representation of LSPR phenomena and bioconjugation (GNR, black; GNR-DHLA, red; GNR-DHLA-N, blue; GNR-DHLA-N-pAb, green). B Transmission electron microscopy (TEM) of pristine GNR, (Scale bar = 50 nm). C UV–visible spectrum of the GNR functionalization. D Dynamic light scattering (DLS) for nanocomplex size estimation. GNR (black line), GNR-DHLA (red line), and GNR-DHLA-N (blue line). E Derivative of the longitudinal x-axis mode of spectra. F Zeta potential values show surface charge changes before and after bioconjugation. G Representative dark-field image of the clusters of GNR-DHLA surrounded by nucleocapsid protein (N), (Scale bar = 500 µm). H Fluorescence intensity media of the nanocomplex before and after the addition of fluorescent antibodies. (pAb primary polyclonal antibody, a.u arbitrary units, mean ± SD, *p < 0.05, ****p < 0.0001). Figure on panel A was created by the authors using BioRender (https://www.biorender.com/).
DLS results also indicate the functionalization with DHLA and the assembly of N protein onto the GNR surface. Due to the Brownian motion, it is possible to estimate the size of a nanocomplex through hydrodynamic diameter measurements. Figure 2D shows the hydrodynamic diameter distribution of GNR (black line), GNR-DHLA (red line), and GNR-DHLA-N (blue line), which includes not only the physical size of the GNR itself but also evidence of the surface coating and solvent layer associated with the particle. The size distribution of GNR-DHLA becomes broad and shifts from ~40 nm (GNR) to 60 nm, suggesting the presence of an organic layer on the GNR surface. An even broader and shifted size distribution was observed in the GNR-DHLA-N nanocomplex (130 nm), suggesting the N protein assembly.
Moreover, to measure the correct plasmon shift, all the LSPR curves were plotted with the correspondent calculus of the x-axis intercept of the derivative of the Gaussian peak (Fig. 2E). GNR-DHLA-N presents a red-shift of 28 and 10 nm in comparison to the GNR and GNR-DHLA spectra, respectively.
The surface charge and, consequently, the electrostatic stability of the GNR-DHLA-N nanocomplex in aqueous medium, pH 6.5, were yet other evaluated parameters, and they also evidenced the GNR surface modifications (Fig. 2F). The absolute values of the zeta potential (ζ) obtained for GNR changed from 47.6 mV ± 1.7 mV to 52.8 mV ± 0.9 mV after DHLA coating and to 17.4 mV ± 0.4 mV after N protein bioconjugation. The globular protein alone presents a ζ of 5.0 mV ± 0.4 mV at the concentration of 0.1 mg/mL, and a slightly positive charge under pH 6.5, justifying the relative decrease in ζ potential value for the GNR-DHLAN complex. Colloidal particles with |ξ | >15 mV are expected to be stable24. The stability of the GNR-DHLA-N nanocomplex aqueous dispersion was also visually observed. Even though a broadening of the DLS peak of GNR-DHLA-N could be due to aggregation and heterogeneity of the samples, the limpid aspect of the dispersion was kept, and no precipitate was observed during at least 2 months of storage at 4 °C.
Due to their remarkable light scattering, gold nanoparticles appear extremely bright in dark-field images, in which bright objects deposited in the subtract surface can be observed to enhance the contrast in unstained samples, working quite well for metallic nanoparticles imaging acquisitions. Figure 2G shows a representative dark-field image of the GNR-DHLA-N, where clusters of the nanocomplexes can be observed. Finally, we exposed GNR-DHLA-N to anti-N polyclonal antibodies and marked them with a secondary fluorescent antibody. Figure 2H shows the increased fluorescence of the labeled nanocomplex compared to the unlabeled GNR-DHLA-N. Altogether, these results confirmed the successful bioconjugation of the nucleocapsid protein to the GNR surface.
Furthermore, we wanted to elucidate the nature of the interactions between GNR-DHLA and N protein by performing an in-depth chemical characterization of the GNR-DHLA and GNR-DHLA-N nanocomplexes by photoelectron spectroscopy (XPS). The survey spectra of both samples, shown in Fig. 3A, indicate that the GNR has been coated with a few nanometers of organic compounds since the Au4f lines are absent from spectra because of the very low mean free path of electrons. This suggests the GNR functionalization with both axial and longitudinal attachments. To emphasize that, the binding energy range of the Au4f lines was measured for those two samples (Fig. 3B) and compared to pristine GNR. Next, we evaluated the surface composition of the functionalized GNR by examining the individual XPS lines of the atomic species C, O, N, Br, and Na.
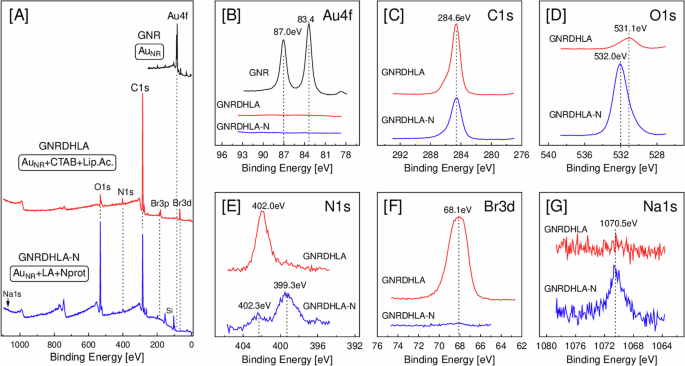
A Survey spectra, B Au4f, C C1s, D O1s, E N1s, F Br3d, and G Na1s.
First, the C1s peaks (Fig. 3C) for both samples have their main contribution at 284.6 eV (due to C-C and C-H), and the shoulders at higher binding energy are due to functional groups (C=O, C-OH, etc). The O1s peak (Fig. 3D) is observed at 531.1 eV for the sample with CTAB and α-lipoic acid (GNR-DHLA), which can be attributed to carbonyls (-C=O, O-C=O). The sample with N protein (GNR-DHLA-N) exhibits a significant growth of the O1s signal at 532.0 eV, which we relate to C-OH and is explained by the replacement of CTAB (C19H42BrN)—which has no oxygen atoms—by lipoid acid (C8H14O2S2) and N protein. Also, the two N1s spectra (Fig. 3E) show very distinct binding energies, suggesting different chemical environments for the nitrogen atoms. The GNR-DHLA sample has an N1s peak at 402.0 eV, which we ascribe to N+(CH3)3 from CTAB capping the gold nanorods25. On the other hand, the GNR-DHLA-N sample has a main peak at 399.3 eV, which we attribute to free amines (NH2) of the nucleocapsid protein. The successful replacement of CTAB by N protein can also be noticed in Fig. 3F, where the Br3d line is strongly attenuated after the conjugation of the N protein, clearly demonstrating that only residual CTAB remains on the surface of the GNR. The presence of a very small amount of sodium (Fig. 3G, Na1s) in the N protein sample is due to one of the preparation steps, in which sulfo-NHS has been added at the GNR-DHLA complex. In summary, optical absorption, fluorescence, DLS, ζ potential values, and XPS data strongly support the bioconjugation of nucleocapsid protein to the GNR-DHLA surface.
The GNR-DHLA-N nanosensor can identify low concentrations of anti-N antibodies
The first analyses of the nanosensor diagnostic performance evaluated control sera spiked with SARS-CoV-2 polyclonal anti-N antibody. The antibody was serially diluted (10 µg to 10 fg) and incubated with the GNR-DHLA-N (Fig. 4A). Figure 4B shows that, at the more concentrated anti-N antibody dilution (10 µg), the sensor was able to recognize the antibodies with shifts greater than 30 nm in the longitudinal mode. The nanosensor was able to detect as low as 1 ng of anti-N antibodies, showing a shift of 4 nm, close to the limit of the detection of the technique.
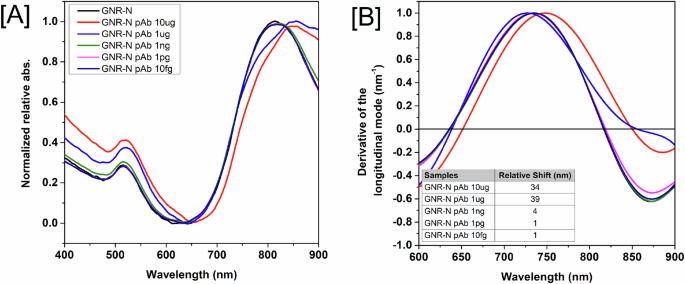
A Absorbance spectra for the completed sensor (GNR-DHLA-N) and the sensor with different concentrations of antibodies. B Derivative calculation from the LSPR signal measured from the completed sensor (GNR-DHLA-N) and the sensor with different concentrations of anti-N antibody. The region of zero (derivative axis) and the region between 600–900 nm (wavelength axis) represents the peak of the longitudinal mode. Wavelength shifts for different polyclonal anti-N antibody dilutions are shown in the inset table. The equipment wavelength accuracy is ± 2–3 nm. Therefore, only shifts equal to or higher than 4 nm were considered significant.
GNR-DHLA-N detects anti-SARS-CoV-2 antibodies in sera from naturally infected patients
Next, we assessed the limit of detection of the nanosensor in recognizing human sera-containing antibodies developed during a natural infection. For this, samples were separated into four different pooled sera considering the combined results of qRT-PCR (Supplementary Table 1) and the anti-N IgG ELISA (Suppl. Fig. 1): highPOS (confirmed positive by qRT-PCR, and positive by ELISA I > 2.1); lowPOS (confirmed positive by qRT-PCR, and positive by ELISA 1.1 > I < 2.1); UND (confirmed positive by qRT-PCR, and undetermined by ELISA 0.8 > I > 1.1); and NEG (negative sera from healthy donors collected before 2020, and ELISA I < 0.6).
The nanosensor was first tested with a highPOS (HS) pooled serum and a pooled negative control (NEG), both serially diluted in a 1:100 to 1:10.000.000 range and added to the GNR-N sensor suspension (Fig. 5A). Because the concentration of antibodies could not be measured, the results are presented according to the serial dilution of the samples. As shown before, wavelength shifts are measured by the derivative of the Gaussian peak. For the highPOS serum, spectral shifts were significant up to 1:100.000 dilution (10 nm), whereas no shift was observed at the highest concentration of the NEG (1 nm), confirming the nanosensor’s specificity and detection limit (Fig. 5B).
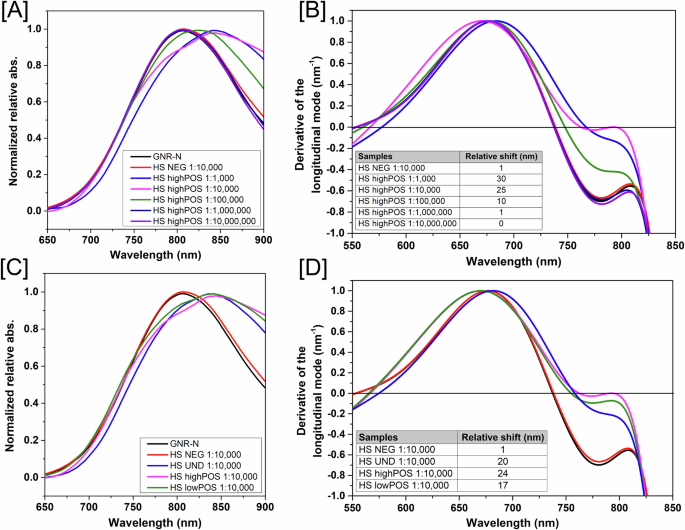
A A pool of sera high positive for SARS-CoV-2 (HS highPOS) was serially diluted in 1:100 to 1:10.000.000 ratios and added to the GNR-DHLA-N. Reads were obtained between 650–900 nm wavelength range. B Relative shifts on the region of zero of the derivative curves for different sera dilutions are shown in the table below graph. C GNR-DHLA-N tested against pools of sera differentially classified on ELISA (HS UND, HS highPOS, and HS lowPOS). Pooled sera were pooled and diluted in a 1:10.000 ratio and measured as described above. D Relative shifts of [C]. The equipment wavelength accuracy is ± 2–3 nm. Therefore, only shifts equal to or higher than 4 nm were considered significant for those tests.
The pooled highPOS serum had a similar performance at the dilutions 1:1.000 and 1:10.000, with relative shifts between 30 and 25 nm in comparison to the sensor GNR-DHLA-N without sera (black line), respectively (Fig. 5B). After that, we selected the dilution of 1:10.000 to evaluate the nanosensor performance against the other sera groups (Fig. 5C, D). As expected, the highest wavelength shift was observed for the nanosensor in the presence of the highPOS serum (24 nm), however, samples from UND and lowPOS serum were also clearly reactive, with 20 and 17 nm of shift, respectively. Although these last groups rendered distinct results on the ELISA platform, the sensor was able to detect all true-positive patients identified by the molecular assay.
GNR-DHLA-N nanosensor can detect SARS-CoV-2 specific antibodies in earlier stages of the disease when compared to ELISA
After establishing the capacity of the nanosensor to identify antibodies from natural infection, all sera samples were individually tested to evaluate the diagnostic performance of the test. The nanosensor was able to recognize either sera previously classified as lowPOS or highPOS with mean shift values of more than 20 nm (Supp. Fig. 1A). Impressively, the mean shift value observed for sera previously classified as negative for SARS-CoV-2 was 9 nm. The cut-off value was defined by the average of negative sera plus two-times standard deviation values (2 SD). The nanosensor index (I) was calculated as the relative shift (nm)/cut-off value. Based on the nanosensor index, negative samples should have I < 0.8, undetermined 0.8 ≤ I < 1.1, and positive samples I ≥ 1.1 (Fig. 6A). These analyses revealed that the nanosensor was able to identify serologically real positive samples (qRT-PCR confirmed) that could not be detected by ELISA and distinguish them from uninfected patients, with an overall sensitivity of 78.4% (Fig. 6B), in comparison with the ELISA (Fig. 1B, 60.3%). The normalized index was used to obtain a real comparison between the results evaluated by ELISA and the GNR-N Nanosensor. Thus, the numerical results obtained by the different techniques were normalized from 0 to 1, where 1 is the maximum value obtained by each technique separately. Comparing the normalized index between both serological platforms, the nanosensor statistically identified more true-positive samples than the ELISA (p-value p < 0.0001) (Fig. 6C).
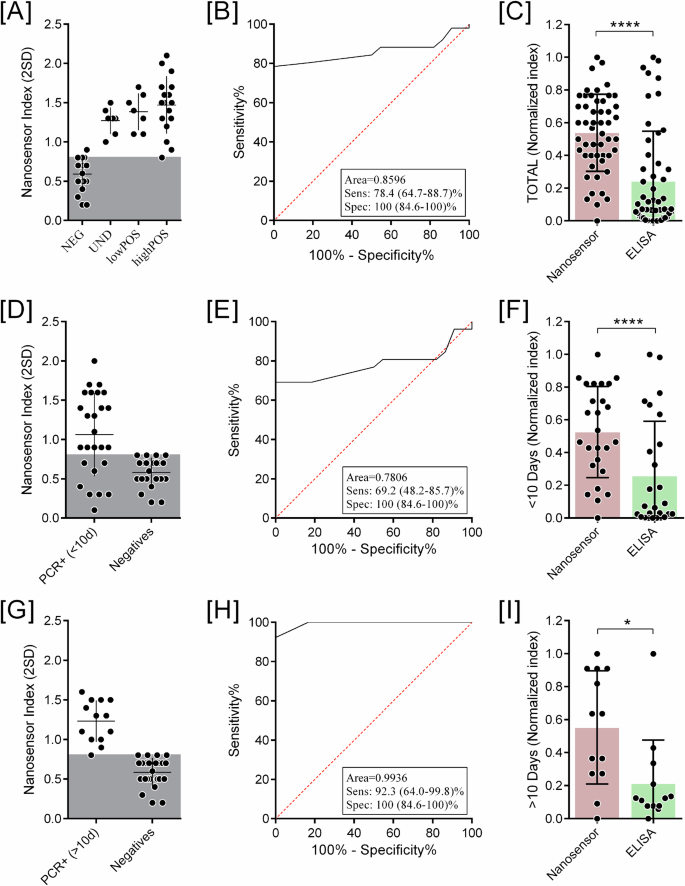
Each individual serum was diluted at a 1:10.000 ratio and incubated with the GNR-DHLA-N. A Nanosensor relative shift (nm), where the y-axis represents the spectrum shift in nm, each position on the x-axis represents one group in which the samples were separated combined results of qRT-PCR and platform by Anti-COVID IgG ELISA: NEG, UND, lowPOS, highPOS. The gray area represents the cut-off value. The larger horizontal lines represent the mean shift value of each group. Standard deviations are also represented. B ROC from [A]. C Comparison of nanosensor and ELISA diagnostic normalized index from all samples. D Nanosensor Index, the y-axis represents the nanosensor diagnostic index, of samples from patients with less than 10 days post-infection. E ROC from [D]. F Comparison of nanosensor and ELISA diagnostic normalized index from <10 days samples. G Nanosensor Index of samples from patients with more than 10 days post-infection. H ROC from [G]. I Comparison of nanosensor and ELISA diagnostic normalized index from >10 days samples. (*p < 0.05, ****p < 0.0001).
Lastly, we correlated the diagnostic performance of the LSPR-nanosensor to days post-onset of symptoms. For this, positive samples were divided into two main groups: sera samples collected before 10 days of the onset of symptoms, and sera samples collected after 10 days of the onset of symptoms. After dividing the positive samples into two main groups, comparative analyses of the Nanosensor Index, sensitivity and performance were carried out for both groups, <10 days (Fig. 6D–F) and >10 (Fig. 6G–I).
We observed that the nanosensor identified most of the positive samples with >10 days of onset of symptoms, with a sensitivity of 92.3%, but with a decreased sensitivity of 69.2% for the ones collected <10 days of onset of symptoms. Considering qRT-PCR positive samples as true-positive samples and healthy donors as true-negative controls, the nanosensor presented an overall specificity of 100% in all analyzed groups (Fig. 6E, H). Maintaining the performance observed on the overall analyses, true-positive samples from both groups ( < 10 days and >10 days) are statistically more detected by the nanosensor than by the ELISA (Fig. 6F–I).
Mutations on the nucleocapsid protein do not affect nanosensor diagnostic performance
Despite having less frequent point mutations compared to the Spike protein (S), the nucleocapsid protein (N) also presents modifications between variants that could affect the diagnostic performance of the nanosensor (Supplementary Fig. 2). In order to evaluate this hypothesis, we selected acute patients from a hospital cohort that were infected with different virus’ variants, according to nucleotide sequencing of viruses’ genomes. Sera samples were collected after confirmation of infection with variants P.1 (Gamma) or P.2 (Zeta) (Supp. Table 2). All samples were from patients with severe disease (17/17 were hospitalized, and 11/17 evolved to ICU admission). Upon evaluation, spectrum shifts vary from 20 nm to higher than 60 nm (Fig. 7A, B). GNR in sample #9 aggregated during measurements and the results were invalidated.
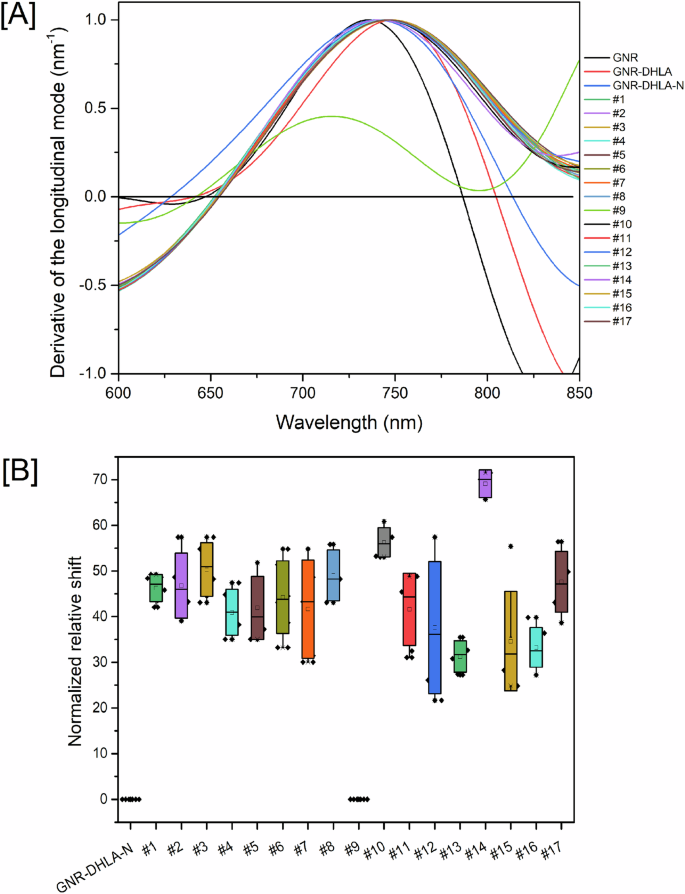
Each individual serum was diluted at a 1:10.000 ratio and incubated with the GNR-DHLA-N nanosensor. A Relative shifts on the region of zero of the derivative curves for each individual tested serum. B Box plot of the replicates of relative shifts measured on three consecutive days. Sample #9 aggregated, and its obtained spectrum did not qualify for the analysis. The equipment wavelength accuracy is ±2–3 nm, and shifts equal to or higher than 4 nm were considered significant. Samples from the sera bank depicted in Table S2 (Supplementary Material) were used in this experiment.
Discussion
Our research group has been using the diagnostic potential of GNR functionalized with viral proteins to obtain nanosensors with expressive results20,23,26,27. Here, we developed a plasmonic nanosensor that utilizes the N protein attached to GNR for detecting specific antibodies against the SARS-CoV-2 virus in human serum. Our group has demonstrated that anti-N antibodies are valuable serological markers as they last for more than one year after the onset of infection28. Exploiting optical signal perturbations, attributed to the LSPR properties of GNR, has been a critical aspect of our approach. Several groups have proposed using LSPR to detect molecules at very low concentrations29,30. The nanometric size and format of the GNR enhance the area/volume ratio, thereby increasing the number of attached bioreceptors on the sensing surface19. The efficient coupling of molecules to the GNRs’ surface enables the highly sensitive and selective detection of changes in the medium.
To confirm N protein binding, we performed a series of physicochemical characterizations. Our results unequivocally demonstrated the successful formation of the nanocomplex. The shift observed in the resonance wavelength after the interaction with the N protein was indicative of GNR bioconjugation, given that LSPR is sensitive to any local electronic disturbances. The extinction spectrum of GNR is a reference to determine LSPR shifts due to protein deposition25,31,32. The formation of the GNR-DHLA-N nanocomplex was further attributed to changes in nanocomplex’s size and charge and was also supported by the increase in fluorescence signal intensity. XPS analysis also revealed the presence of an organic layer around the GNR and functional groups at specific binding energy ranges that characterized the presence of the N protein.
The developed nanosensor was highly sensitive and specific, detecting as low as 1 ng of anti-N antibodies with a measured absorption shift of 4 nm, closer to the detection limit of the technique. However, the most interesting feature of this novel technique relies on the early serological detection of COVID-19 true-positive patients, especially when compared to well-established assays, such as DPP and ELISA. The overall diagnostic performance of the LSPR-based sensor was not only superior to the compared ELISA assay, but our results also showed the ability of the sensor to detect antibodies more efficiently on samples prior to 10 days post-infection—mainly due to the lower limit of detection of the technique. Other strategies for COVID-19 screening involve serological fast tests utilizing gold nanoparticles to detect the presence of IgM and/or IgG immunoglobulins. These label-free biosensors are based on a carbon electrode and employ electrochemical impedance spectroscopy33. Li et al.34 also reported a rapid and easy IgM/IgG test for SARS‐CoV‐2 infection detection in blood serum. The test relies on binding IgG/IgM antibodies to a gold nanoparticle-coupled S protein recombinant from the SARS-CoV-2 antigen, resulting in a change in nanocomplex color due to LSPR. This change confirms the presence of the SARS-CoV-2 virus with high specificity.
Another study focused on the serological detection of antibodies in vaccinated patients, using a biosensor based on the immobilization of the recombinant trimeric wild-type spike protein (S protein) on zinc oxide nanorods (ZnONRs). This suggests the methodology is a potential point-of-care technology for evaluating vaccine-induced humoral immunity against different SARS-CoV-2 strains35. Nunez and colleagues also compared the sensitivity and cross-reactivity of ELISA for IgG anti-SARS-CoV-2 spike protein and ELISA for IgG anti-RBDs of seasonal coronavirus (HCoVs) with a ZnONR immunosensor and the results presented higher sensitivity when compared to negative ELISA results36. As differential, however, the sensor presented here does not require any specialized read-out equipment other than a regular spectrophotometer, which may be an advantage for broad use, including in places with limited access to laboratory equipment. Recently, our research group developed another COVID-19 nanosensor functionalized with the Spike antibody (GNR-LA-S) that successfully recognized SARS-CoV-2 in samples from macerated human testes, demonstrating the broad range of possibilities offered by plasmonic biosensing25. However, there are still limitations to the platform of which one has to be mindful. For instance, evaluating curves and calculating specter shifts require knowledge that cannot be found everywhere. To that end, friendly software to help untrained operators, as well as other further developments, are still needed to make this platform truly universal.
Finally, the appearance of new viral variants is a constant concern for researchers and medical providers regarding COVID-19. Many efforts were made to adapt vaccine candidates and molecular assay protocols to fit new variants of concern or interest (VOC/VOI), but the issue was less critical on serological assays. Similar to our results, commercial assays were tested against different variants, detecting 94 to 100% of the positive samples37. Indeed, Muecksch and collaborators38 discuss how antibody levels vary widely over time after infection and how to correlate diagnostic cutoffs with the prediction of the presence of neutralizing activity of those antibodies. However, even though serological assay diagnostic performance was variable, no significant difference was observed amidst different VOCs.
Despite the advantages that can be evidenced in LSPR-based biosensors, biased analyses may arise depending on the person processing the results. For this reason, in this work, a computational analysis is presented in which the data collected from the experiments carried out are post-processed to reduce the errors induced by human manipulation, providing that even the smallest variation in the surface of the proposed biosensors produces a unique spectral response, maintaining the blue-shift or red-shift constantly in all the correlated samples analyzed23.
GNR-DHLA-N nanosensor has shown remarkable sensitivity compared to ELISA, highlighting the great potential of this technology for evaluating serological responses for COVID-19 against different SARS-CoV-2 strains, which can be beneficial for populational-level screenings and monitoring, supporting the development of novel diagnostic approaches for future events and pandemics.
Methods
SARS-CoV-2 sera banks and ethical considerations
The study was conducted according to the guidelines of the Declaration of Helsinki and done in sera samples from patients and healthy volunteers with the consent term waived approved by the Institutional Review Board of Universidade Federal de Minas Gerais (protocol code 1686320.0.0000.5149, approved on June 23, 2020), and the Institutional Review Board of the Faculdade de Medicina de São José do Rio Preto (protocol code 31588920.0.0000.5415, approved on May 14, 2020). Confidentiality was ensured by anonymizing all samples before data entry and analysis.
Prospective cohort of participants in Belo Horizonte city, Minas Gerais state, Brazil
The samples come from a serum bank of patients with confirmed natural infection, prior to vaccination. Patients were confirmed with the gold-standard molecular assay (qRT-PCR), and seroconversion followed for more than 20 days post-infection. Samples were collected during June–July 2020, in a prospective cohort of participants in Belo Horizonte City, Minas Gerais State, Brazil. From the total of 136 participants, 79 tested negative for viral RNA screening test qRT-PCR (nasal swab). Samples from 57 individuals were selected based on a reported history of a positive SARS-CoV-2 PCR nasal swab and characterized by the rapid test-dual-path platform (DPP) COVID-19 IgM/IgG (Biomanguinhos, Fiocruz, Brazil) using sera or blood according to the supplier instructions. Sample description can be found in Supplementary Table 1.
Sera bank from hospitalized patients at the ICU of the university hospital at São Jose do Rio Preto City, Sao Paulo state, Brazil
The second sera bank was collected during February–March 2021, after the introduction of SARS-CoV-2 VOCs in Sao Jose do Rio Preto, Sao Paulo, Brazil. All patients presented acute severe cases of COVID-19 and were hospitalized at an intensive care unit (ICU) at a local university hospital. Serum samples were collected between 4 to 15 days post-infection. Swab samples were tested by qRT-PCR and, due to higher CT values, selected for sequencing (n = 17). Same-day collected serum was analyzed by SARS-CoV-2 anti-N ELISA for seroconversion. Samples’ descriptions can be found in Supplementary Table 2.
SARS-CoV-2 VOCs characterization
Positive samples were submitted to viral RNA isolation by using the QIAamp Viral RNA Mini Kit (QIAGEN), and cDNA was synthesized using the High-Capacity cDNA synthesis kit (Applied Biosystems) according to the manufacturer’s protocols, respectively. A conventional PCR targeting the receptor-binding domain (RBD) region of the SARS-CoV-2 Spike (S) protein (Primer F: GAGTCCAACCAACAGAATC; Primer R: GAATCTCAAGTGTCTGTGG) was performed, and the amplicons were directly sequenced in both orientations by using the ABI3130XL platform (Applied Biosystems). Sequences were aligned with other reference sequences from GenBank by using the Clustal W method in the BioEdit software version 7.1.11. [Suppl refs. 1,2].
SARS-CoV-2 nucleocapsid protein
The SARS-CoV-2 nucleocapsid (N) protein antigen (MT126808.1) was produced by our group as previously described39.
Polyclonal anti-N antibody
Experiments were carried out following the protocols approved by the Institutional Animal Care and Use Committee of Fiocruz Foundation under the registration protocols P-29/19-3, LW-39/19, and according to Leenaars and Hendriksen40. A New Zealand rabbit was immunized subcutaneously with 100 μg of recombinant N protein and 30% of aluminum hydroxide as an adjuvant. Peripheral blood was collected before and after immunization. Eight weeks after four subcutaneous immunizations, the antiserum was harvested from the rabbit carotid artery. The antiserum titer was determined by indirect ELISA and purified by affinity (HiTrap Protein A-GE).
SARS-CoV-2 anti-N ELISA
ELISA was performed as published elsewhere39. Each sample’s index (I) was calculated as the absorbance value over the cut-off (I = OD450nm/cut-off). Samples pre-tested by ELISA were classified as lowNEG (low negatives samples, with I < 0.6), highNEG (negatives samples with index close to the cut-off, 0.6 ≤ I < 0.8), UND (undetermined samples, 0.8 ≤ I < 1.1), lowPOS (low positives samples, 1.1 ≤ I < 2.1), and highPOS (high positives samples, with I ≥ 2.1).
COVID-nanosensor construction
Commercial Gold Nanorods (GNR) [Part# A12-(10-780)-(CTAB)-(DI Water)], size 10 × 38 nm, were purchased from Nanopartz™ (USA/Canada). GNRs were covalently functionalized with the SARS-CoV-2 recombinant nucleocapsid proteins through a carbodiimide-activated amidation reaction, as previously described20. In short, in-house reduced α-lipoic acid (DHLA) re-suspended in DMSO (Dimethyl sulfoxide, Sigma Aldrich, USA) was added to the GNR solution (0.039 mg/mL). The suspension was sonicated in an ultrasonic bath (Elma Ultrasonics, GER) at 55 °C for 30 min followed by 2 h at 30 °C, and stored overnight at 4 °C. The pre-treated modified GNR-DHLA was centrifuged at 8000 rpm for 10 min, and a solution containing 16 mM EDC (1-Ethyl-3-(3-Dimethylaminopropyl)carbodiimide, Thermo Fisher Scientific Inc, USA) and 4 mM sulfo-NHS (N-hydroxysulfosuccinimide, Thermo Fisher Scientific Inc, USA) was added at the GNR-DHLA complex for 30 min in an ice bath under sonication. The pre-treated modified GNR-DHLA was functionalized with 10 µg of the SARS-CoV-2 nucleocapsid protein (N) for 1 h in an ice bath under sonication. The nanosensor was blocked with a linear monofunctional polyethylene glycol containing a reactive free thiol (MW 5k), mPEG-SH, 10-4 mM (Creative PEGWorks, USA) for 10 min in an ice bath under stirring.
Characterization of GNR, GNR-DHLA, and GNR-DHLA-N
The process of the nanocomplex construction was monitored step-by-step with several techniques to perform physicochemical characterizations of its pre-products and the final sensor. In short, we evaluated the particles by UV–Vis spectroscopy, zeta potential measurement, dynamic light scattering (DLS), fluorimetry, dark-field microscopy Image, and X-ray photoelectron spectroscopy (XPS).
Ultraviolet/Visible/Near-Infrared (UV–Vis–NIR) absorbance
UV–Vis spectroscopy was performed on the Varioskan Flash spectral scanning multimode reader (Thermo Scientific) at 400–900 nm wavelengths using a 96-well quartz microplate (Costar).
Dynamic light scattering (DLS) and zeta potential measurements
The zeta potential absolute values and the hydrodynamic diameter of the samples were measured by DLS in the Litesizer 500 particles analyzer, type BM10 (Anton Paar, USA).
Fluorimetry measurements
The samples were measured as previously described [Suppl. refs. 3,4]. Briefly, GNR-DHLA-N samples were incubated with 10 µg of polyclonal anti-N antibody and labeled with Alexa Fluor® 546 goat anti-rabbit IgG H&L (Invitrogen, USA). The samples were measured by the spectrophotometer Varioskan Flash spectral scanning multimode reader (Thermo Scientific, USA).
Dark-field microscopy image
A solution containing GNR-DHLA-N was dropped on a coverslip and dried overnight. The scattering imaging was performed with a BX51 optical microscope (Olympus, Japan) equipped with a DP72 single-chip true-color charge-coupled device (CCD) camera.
X-ray photoelectron spectroscopy (XPS)
XPS was performed under a base pressure of 1 × 10⁻⁹ mbar, using conventional Mg-Kα radiation (1253.6 eV) and a hemispherical electron energy analyzer, model PHOIBOS 100 (SPECS Surface Nano Analysis GmbH, GRE). Survey spectra (0–1100 eV) were measured at Epass = 50 eV, while high-resolution spectra of the C1s, O1s, N1s, Au4f, Br3d, Na1s lines were taken at the same experimental conditions (Epass = 20 eV) of the electron analyzer, which resulted in an instrumental resolution of ca. 0.7 eV.
GNR-DHLA-N nanosensor limit of detection and diagnostic performance evaluation
We performed in-house assays using the polyclonal anti-N antibody, as described above, to evaluate the antibody-nanosensor interaction. For this, human sera from healthy donors were spiked with serial dilutions of the polyclonal anti-N antibody (10 µg to 1 fg) and added to the GNR-DHLA-N solutions. After 30 min of incubation in an ultrasonic bath at 4 °C (Elma Ultrasonics, GER), UV–Vis spectroscopy measurements were carried out using a Multiskan GO spectrophotometer (Thermo Scientific, USA). Assessments were conducted independently during three consecutive days, with three replicates each. The data plot was expressed based on the resultant median absorbance between replicates. To measure the biosensing event more precisely, we evaluated the plasmon shift in each curve through the x-axis intercept of the derivative of the Gaussian peak for every curve. In all figures depicting LSPR detection, the spectra absorbance and the derivative calculus were plotted side by side, as described before20. Data analysis focused on red shifting measurements of the longitudinal peak, and 3 nm was considered the equipment’s maximum accuracy. To add confidence, less than 4 nm shifts were not considered significant.
Evaluation of nanosensor’s detection efficiency against naturally infected patient sera
The biosensors’ limit of detection was also tested in the same way by employing sera highPOS (I ≥ 2.1) diluted up to 1:10.000.000. Shifts were measured in comparison to controls: sensors with no sera (GNR-DHLA-N) or sensors added with SARS-CoV-2-negative sera (HS NEG). After determining the sera dilution, other groups of samples established in ELISA were tested for sensitivity and specificity measurements. Individual sera were diluted in a 1:10.000 ratio. Incubation protocol and UV–Vis spectroscopy measurements were performed as described in section 2.7.
GNR-DHLA-N nanosensor performance against different SARS-CoV-2 variants
To evaluate if viral mutations could possibly interfere with the nanosensor serologic performance, we selected patients infected with variants Gamma (P.1) and Zeta (P.2), previously characterized as described in section S1.1 and 1.2 (Supplementary material). Individual sera were diluted in a 1:10.000 ratio. Incubation protocol and UV–Vis spectroscopy measurements were performed as described in section 2.7.
Data plots and statistical analysis
This study provides reliable results that do not depend on the visual quality of the analyzer. Still, computationally calculated results are based on the real variations obtained in the proposed biosensor as described before23. Spectra analysis and derivative regression were performed using OriginPro software version 9.0 (OriginLab Corporation, USA). LSPR calculation and interpretation were performed as previously reported20. ELISA and nanosensor plots, statistics, and ROC curves were generated using GraphPad Prism version 10.1.2 (GraphPad Software Inc., USA). Kolmogorov–Smirnov test was used to evaluate the normality of data. Different groups with normal distribution were independently compared by using analysis of variance (ANOVA) with Bonferroni correction, while groups not normally distributed were compared by using the Kruskal–Wallis test with Dunn’s correction.

Responses