Shank3 modulates Rpl3 expression and protein synthesis via mGlu5: implications for Phelan McDermid syndrome

Introduction
Deletions or mutations in the SHANK3 gene have been identified in up to 1% of autism spectrum disorder (ASD) cases and are considered the main cause of the neuropsychiatric symptoms of Phelan McDermid syndrome (PMS), a neurodevelopmental disorder that causes ASD and intellectual disability [1,2,3]. Shank3 is a scaffold protein located in the postsynaptic density (PSD) of glutamatergic synapses, where it plays a critical role in modulating synaptic maturation and function [4,5,6]. While synaptic dysfunction and altered connectivity have been found in different brain regions of Shank3 KO mice, including cortex [7,8,9], striatum [10,11,12], and hippocampus [13,14,15] other mechanisms through which Shank3 could regulate neuronal functions and lead to ASD have not been clearly elucidated. In this study, we performed transcriptome analyses, RNA-sequencing (RNA-seq) in cortex and striatum of adult Shank3 KO mice to identify molecular changes induced by Shank3 deletion. Among the identified differentially expressed genes from each brain region compared to wild-type, we found that the expression of the ribosomal gene RPL3 was decreased in both brain areas. The RPL3 gene is highly conserved throughout evolution and encodes a ribosomal protein that is a component of the 60S subunit. Experimental data from yeast indicate that Rpl3 is essential for ribosomal biogenesis and function [16,17,18,19] and it plays an important role in intra-ribosomal communication by allosterically transmitting the ribosome’s tRNA occupancy status to the elongation factor binding region [20]. Defects in ribosomal proteins have already been associated with neurodevelopmental disorders [21], as mutations in the ribosomal gene RPL10 have been found in patients with ASD [22,23,24,25], where they affect the translational capacity of the cell [24]. Two distinct missense mutations of another ribosomal gene, RPS23, were found in two patients with microcephaly, hearing loss, growth deficits, dysmorphic features, and ASD [26]. Indeed, several studies linked brain protein synthesis with critical processes such as plasticity, learning and memory, suggesting that changes in ribosomal assembly, mRNA processing, and translation could have serious consequences on brain function [27, 28].
We confirmed in cortex and striatum of Shank3 KO mice a reduction in Rpl3 protein expression and a significant impairment in protein synthesis that was rescued by Rpl3 re-expression, suggesting a causal link between Rpl3 downregulation and dysregulated protein synthesis. Moreover, restoring Rpl3 expression in striatum of Shank3 KO mice was sufficient to rescue protein synthesis as well as mitigate excessive grooming. This indicates that the behavioral alteration found in Shank3 KO mice might be, at least in part, caused by dysregulated protein synthesis. Several pathways control protein synthesis, and it has been extensively demonstrated that activation of group I metabotropic glutamate receptors (mGlu1 and mGlu5) affects gene expression and mRNA translation [29, 30]; moreover, we have previously demonstrated that Shank3 deletion impaired mGlu5 intracellular signaling [9, 31]. Here we demonstrated that the reduction in Rpl3 expression and the consequent decrease in protein synthesis are caused by the chronic depression of mGlu5 activity. Consequently, chronic treatment with VU0409551, a potent and selective mGlu5 positive allosteric modulator, rescues Rpl3 expression and the resulting reduction in protein synthesis leading to long-lasting improvement of behavioral deficits in Shank3 KO mice. Altogether, we propose a new role for Shank3 in modulating ribosomal function and protein synthesis, and suggest that restoring protein synthesis could be a strategy to correct Shank3 KO-related behavioral phenotypes.
Materials and methods
Mice and behavioral assays
The Shank3Δ11-/- (referred as Shank3 KO) and Shank3Δ11LoxP/LoxP mice (C57-B6.129Sv-Prosap2<tm1.1Tmb > /J) were generated as previously described by by Schmeisser et al. [32] and re-derived in a C57BL/6 J background (Charles River Laboratories, Calco, Italy). They were housed in a constant temperature (22 °C) and humidity (50%) environment with a 12-h light/dark cycle, and fed and watered as needed. In order to obtain wild type and knockout mice, we used heterozygous mice for breeding. Meanwhile, to generate a conditional knockout, we crossed Shank3Δ11LoxP/LoxP. All experiments involving animals followed protocols (966/16 and 767/17) in accordance with the guidelines established by the European Communities Council and the Italian Ministry of Health (Rome, Italy). To minimize the number of animals, each mouse was submitted to a maximum of 4 tests with an interval of one week between every test. All efforts were made to minimize the number of subjects and their suffering. All animals used in the analyses and behavioral tests were randomized. All the behavioral scoring was performed on a blind basis by a trained experimenter. To allocate mice into experimental groups, a stratified randomization method was used.
RNA sequencing and analysis
RNA from the cortex and striatum of 3-month-old male WT and Shank3Δ11-/- (3 per genotype) was extracted using the RNeasy Lipid Tissue Mini Kit (QIAGEN, cat. no. 74804) following the manufacturer’s instructions. Library preparation, cluster generation, and sequencing were performed by Novogene Europe using Illumina PE150. Raw readings were aligned using the Rsubread package [33] of R (version 4.1.2) thus obtaining the counts for each recognized gene. The estimation of the variance-mean dependence in count data and the differential gene expression analysis have been performed by the DESeq2 package of R [34].
Self-grooming test
The repetitive self-grooming test was performed as previously described [9]. In a room illuminated at about 40 lux, a single mouse was placed in a standard cylinder (46 cm long, 23.5 cm wide, and 20 cm high). Ten minutes after the habituation period in the test cage, each mouse was scored with a 10 min stopwatch for the cumulative time spent grooming all body regions.
Sociability and preference for social novelty tests
A three-chamber apparatus used is a transparent polycarbonate box (width = 42.5 cm, height = 22.2 cm, central chamber length = 17.8 cm, and side chamber lengths = 19.1 cm) previously described in Sala et al [35]. During the 10 min habituation phase, each mouse was placed in the middle compartment, free to explore all three chambers. Then, an unfamiliar adult DBA/2 J male mouse was placed in one side compartment, while the other contained an empty wire cage. Immediately after the sociability test, without cleaning the apparatus, the social novelty test was performed by putting an unfamiliar mouse in the empty wire cage for a 10 min session. The familiar and unfamiliar animals were from different home cages and had never been in physical contact with the subject mouse or with each other. For both tests, the time spent in each chamber and the number of entries into each chamber were recorded for 10 min. The data were expressed in Social Index = (time exploring a novel mouse 1 (S1) – time exploring an empty cage (E))/(time exploring a novel mouse 1 (S1) + time exploring an empty cage (E)) and Social Novelty Index = (time exploring a novel mouse 2 (S2) – time exploring familiar mouse (S1))/(time exploring a novel mouse 2 (S2) + time exploring familiar mouse (S1)), as well as the time spent in close proximity to the novel mouse (S1) in the sociability and the novel mouse (S2) in social novelty test.
T- Maze test
Mice were deprived of food until they reached 85–90% of their free-feeding body weight. They were habituated to a black wooden T-maze (with a 41-cm stem section and a 91-cm arm section). Each section was 11 cm wide and had walls that were 19 cm high. The mice were habituated to the T-maze and trained to obtain food within the maze for 5 days, as previously described [35]. During the acquisition phase, one arm was designated the reinforcer (Coco Pops; Kellogg’s) in the ten daily trials. Each mouse was placed at the start of the maze and allowed to freely choose which arm to enter. The number of days required to reach the goal criterion (80% correct for 3 consecutive days) was recorded. Each mouse that met the goal for acquisition was then tested using a reversal procedure in which the reinforcer was switched to the opposite arm.
Dominance tube test
The tube test assessed the social dominance and aggressive behaviors of mice as described in Zhou et al. [7]. During the three days preceding the test, mice became accustomed to entering a transparent, plexiglass tube (20 cm in length, 3 cm in diameter). It was 20 min before the test mice were habituated to the room. Two mice that did not have previous contact were placed at the extremes of the tube and reached the center autonomously. The experimenter measured the time it took for one mouse to move back to the tube limit and exit with all four limbs (6 min cut-off). That was considered the loser mouse. Every mouse fought several matches, with 60 min between matches.
Novel object recognition test
The novel-object recognition test was performed in an open plastic arena (60 × 50 × 30 cm), as previously described [36]. The test had 3 phases: the habituation on the first day, when mice became accustomed to the test arena for 10 min; the familiarization and novel-object recognition on the second day after. In the familiarization phase, two identical objects were placed in the middle of the arena, equidistant from the walls and from each other. Mice were placed between the two objects until they had completed 30 s of cumulative object exploration (20 min cut-off). An experimenter measured the time that mice spent closer approximately 1 cm of an object with their noses toward the object. Climbing the object or pointing the nose toward the ceiling near the object were not considered exploring behaviors. After familiarization, mice returned to their home cage until they were tested for novel recognition after 5 min, 2 h, and 24 h. In the novel recognition phase, a novel object (never seen before) takes the place of the one more thoroughly explored in the familiarization phase. The scoring of object recognition was performed as during the familiarization phase. For each mouse, the role (familiar or new object) as well as the relative position of the two objects were randomly permuted. The objects used for the test were white plastic cylinders and colored plastic Lego stacks of different shapes. The arena was cleaned with 70% ethanol after each trial. Performance was analyzed by calculating a discrimination index (N-F/N + F), where N = the time spent exploring the novel object, and F = the time spent exploring the familiar object.
Pharmacological treatments
VU0409551 was kindly provided by Kerrie Jones from the Vanderbilt Center for Neuroscience Drug Discovery at Vanderbilt University. It was resuspended in a betaciclodextrin 20% (Sigma) solution. For the acute treatment, 30 min before each behavioral test, WT, Shank3 KO, and Shank3Δ11LoxP/LoxP conditional KO mice were injected intraperitoneally with VU0409551 or the same volume of betaciclodextrin 20% solution (vehicle). For evaluating neuronal responsivity by the immediate early gene c-Fos, animals were treated with 5 mg/kg of VU0409551 or vehicle in acute and perfused after 1 h and 30 min. During chronic treatment, 5 mg/kg of VU0409551 or vehicle was injected intraperitoneally for 15 days. Cortical neurons derived from iPSCs from a Phelan-McDermid Syndrome patient were treated with VU0409551 (40 mM) at DIV 45 for 5 days. The last day of treatment, after 5 min in which cells were treated with VU0409551, cells were treated with DHPG (100 mM) and puromycin (10 mg/ml) (Sigma P8833-10MG) for 30 min. After 30 min, cells were lysed in Hepes-Sucrose (Hepes 4 mM, Sucrose 0,32 M, pH 7.4) with protease inhibitors (Sigma, P8340) and phosphatase inhibitors (Roche). Samples were centrifuged at 800×g for 5 min at 4 °C. Resulting supernatants were collected and quantified by BCA protein assay (EuroClone) to assess protein concentration and then solubilized in 4×loading dye (250 mM Tris–HCl pH 6.8, 40% glycerol, 0.008% bromophenol blue, 8% SDS; all from Sigma- Aldrich).
MTEP treatment
WT animals were treated from 7 post-natal day to 14 post-natal day with 3 mg/kg of MTEP (Tocris, cat. 2921) or vehicle. After 30 min form the last injection animals were transcardially perfused.
Rat cortical neurons were treated with acute treatment (DIV18) and 5 days chronic treatment (DIV14-DIV18) with MTEP (30 nM) or vehicle. Cortical neurons derived from iPSCs from a Phelan-McDermid Syndrome patient were treated for 5 days (DIV45-DIV49) with MTEP (30 nM) or vehicle. For Rpl3 protein level evaluation, the last day of treatment, after 5 min in which cells were treated with MTEP (30 nM) cells were lysed in Hepes-Sucrose (Hepes 4 mM, Sucrose 0,32 M, pH 7.4) with protease inhibitors (Sigma, P8340) and phosphatase inhibitors (Roche). For protein synthesis evaluation, the last day of treatment, after 5 min in which cells were treated with MTEP (30 nM) cells were treated with puromycin (10 mg/ml) (Sigma P8833-10MG) for 30 min. After 30 min cells were lysed in Hepes-Sucrose (Hepes 4 mM, Sucrose 0,32 M, pH 7.4) with protease inhibitors (Sigma, P8340) and phosphatase inhibitors (Roche). Cells lysate was quantified by BCA protein assay (EuroClone) to assess protein concentration and then solubilized in 4×loading dye (250 mM Tris–HCl pH 6.8, 40% glycerol, 0.008% bromophenol blue, 8% SDS; all from Sigma- Aldrich).
Stereotaxic injection and viral construct
Stereotaxic injections of pENN.AAV.hSyn.HI.eGFP-Cre.WPRE.SV40 (Addgene, 105540-AAV9), AAV9-CMV-m-RPL3 (Vector Biolabs, AAV-270914) or, pAAV.CMV.HI.eGFP-Cre.WPRE.SV40 (AAV9-CMV-GFP-Cre) (Addgene viral prep, 105545-AAV9), were performed bilaterally into prefrontal Cortex (coordinates: bregma: 0.0 mm; anterior-posterior: 2.2 mm; dorso-ventral: 1.5 mm; medio-lateral: +/− 0.4 mm), striatum (coordinates: bregma: 0.0 mm; anterior-posterior: 0.7 mm; dorso-ventral: 3 mm; medio-lateral: +/− 1.8 mm) and hippocampus (coordinates: bregma: 0.0 mm; anterior-posterior: -1.88 mm; dorsal-ventral: 1.4 mm; medio-lateral: +/− 1.8 mm). Shank3Δ11-/-, Shank3Δ11LoxP/LoxP and WT mice were tested 4 weeks after recovery.
SUnSET assay
The surface sensing of translation (SUnSET) was performed as described in Schmidt et al., 2009. Shank3 KO and WT were anesthetized with isoflurane (Iso-Vet, La zootecnica) and stereotactically injected with 0.7 μl of Puromycin (50 μg/ μl) (Sigma) in the ventricles (coordinates: bregma: 0.0; anterior-posterior: −0.22 mm; dorso-ventral: 2.4 mm; medio-lateral: +/−1). Mice were scarified 1 h after the injection. Cortex, striatum, and hippocampus were dissected and homogenized in a buffer containing (Hepes 10 mM, EDTA 2 mM, protease and phosphatase inhibitors). After protein extraction, 10 μg of each sample was electrophoretically separated using two identical 10% SDS-PAGEs. Then one gel was blotted on a nitrocellulose membrane, blocked in 5% milk + TBST and incubated over night with a primary antibody against puromycin (Puromycin [3RH11], Kerafast). The membrane was treated with HRP-conjugated secondary antibodies, and the signal was visualized using Pierce ECL Western Blotting Substrate and further detected using a Chimi-Doc (Bio-Rad). The second gel was stained with Coomassie Blue Solution (45% H2O, 45% MetOH, and 10% Glacial Acetic Acid, 3 g/L Coomassie dye). The gel was washed extensively with Destaining Solution (45% MetOH, 10% Glacial Acetic Acid, and 45% H2). Western blot signals were quantified using ImageLab software (Bio-Rad) and puromycin signals were normalized to the respective Coomassie staining signals.
Synaptosome preparation
Synaptosomes were prepared from cortex and striatum of mice. Mice’s brains were dissected, and cortex and striatum were homogenized manually in homogenizing buffer (B1) (10 mM HEPES (pH 7.4), 20 mM Sucrose, 2 mM EDTA (pH 8.0), 5 mM Sodium orthovanadate, 30 mM Sodium fluoride, 20 mM β-glycerol phosphate, protease inhibitor cocktail 1:50 (Roche) and phosphatase inhibitors (PhoSTOP, Roche). Total lysate were partially collected. After centrifugation at 1000 x g for 10 min at 4 °C the supernatant was collected and centrifugate for 20 min at 10,000 x g. After the centrifuge the supernatant was collected and the pellet (P2) was resuspended in Buffer 2 (B2) (10 mM HEPES (pH 7.4), 20 mM Sucrose, 2 mM EDTA (pH 8.0), 2 mM EGTA (pU 8.0), 5 mM Sodium orthovanadate, 30 mM Sodium fluoride, 20 mM β-glycerol phosphate, 1%TritonX, protease inhibitor cocktail 1:50 (Roche) and phosphatase inhibitors (PhoSTOP, Roche) and centrifuge at 20,000 x g for 80 min. After the centrifuge supernatant was collected and pellet (synaptosomes) was resuspended in Buffer 3 (B3) (50 mM Tris (pH 9.0), 5 mM Sodium orthovanadate, 30 mM Sodium fluoride, 20 mM β-glycerol phosphate, 1% NaDOC, 1% TritonX, 0.1% SDS, 150 mM NaCl, protease inhibitor 1:50 (Roche) and phosphatase inhibitors (PhoSTOP, Roche). Total lysate and synaptosomes fraction from cortex and striatum were used for western blot.
Western blot analysis
Tissues were homogenized in RIPA lysis buffer (10 mM Tris-HCl, pH 8.0; 1 mM EDTA; 1% Triton X-100; 0.1% Sodium Deoxycholate; 0.1% SDS and 140 mM NaCl) and an equal amount of each sample (10 μg) of each sample was separated using SDS-PAGE and subsequentially blotted on nitrocellulose membranes according to standard protocol. The membranes were incubated with a primary antibody: β-III- tubulin (mouse, Sigma, cat. MA1-19187), Homer 1b/c (rabbit, Synaptic Systems, cat. 16022), mGluR5 (rabbit, Millipore, cat. AB5675), Shank3 (rabbit, Cell Signaling technologies, #64555), Rpl3 (rabbit, Novus, cat. NBP2-20214), Rps7 (3G4) (mouse, Novus, cat. H00006201-M03), Rpl5 (rabbit, Cell Signaling Technologies, cat. 14568), Rpl7a (E109) (rabbit, Cell Signaling technologies, cat. 2415), Rpl36A (M01) clone 5F8 (mouse, Abnova, cat. H00006173-M01), Rps9 (mouse, Proteintech, 18215-1-AP), Rpl8 (rabbit, Abcam, cat. AB169538), Rps19 (rabbit, Abcam, AB181365), Rpl37a (rabbit, Proteintech, cat. 14660-1-AP) followed by horseradish peroxidase HRP-conjugated secondary antibodies (anti-rabbit and anti-mouse, Cell Signaling Technologies). The signal was visualized using the Pierce ECL Western Blotting Substrate and further detected using a Chimi-Doc (Bio-Rad). Protein levels were normalized to the respective β-III-tubulin and ratios were compared between conditions.
Brain sectioning preparation and immunohistochemistry
Two-months-old mice were transcardially perfused with 5% sucrose followed by ice-cold 4% paraformaldehyde (PFA, Sigma-Aldrich, Burlington, Massachusetts, US) in PBS w/o Ca2+ and Mg2+ (PBS, Gibco, Waltham, Massachusetts, US). Afterwards, brains were dissected and post-fixed overnight in 4% PFA at 4 °C, and the day after, left overnight in 30% sucrose at 4 °C. Brains were frozen and included in cryomolds with Tissue-Tek OCT compound (Bio-Optica) using dry ice and Dehyol 95 (Bio-Optica) and stored at −80 °C until cryostat sectioning. Brains were sectioned using a Leica CM3050 S cryostat (Leica Biosystems, Wetzlar, Germany) into 40 μm coronal sections. Free-floating brain coronal sections were blocked in 3% bovine serum albumin (neoFroxx, Einhausen, Germany) and 0.3% Triton (Roche, Basel, Switzerland) in PBS w/o Ca2+ and Mg2+ for 2 h at room temperature (RT). For Shank3 staining a blocking solution of 10% goat serum, 5% FBS and 0.1% tryton in PBS3% w/o Ca2+ and Mg2+ was used. Slices were thereafter incubated with the following primary antibodies diluted in blocking solution for 24 h at 4 °C: Rpl3, rabbit, Novus, cat. NBP2-20214, 1:500; Rps7, mouse, Novus Cat. (3G4) H00006201-M03, 1:100; Shank3, rabbit, Cell Signaling, cat. 64555, 1:500; Synapsin1, mouse, Synaptic System, cat. 106 011, 1:500. The day after, after 3 washes in PBS, brain sections were incubated with the secondary antibodies in blocking solution for 2 h at RT. Secondary antibody for STED microscopy (STAR RED anti-mouse, 1:100, STRED-1001-500UG, Aberrior; STAR ORANGE anti-rabbit, 1:100, STORANGE-1002-500UG, Aberrior) or secondary antibody coupled to Alexa Fluor 568 and 647 (Jackson ImmunoResearch, Cambridge, UK, 1:500) were used. After 3 further washes in PBS, the sections were incubated for 3 min with DAPI, and after 2 washes in PBS, the sections were mounted with ProLong Gold Antifade Mountant (Invitrogen, Waltham, Massachusetts, US).
To evaluate neuronal responsivity by the immediate early gene c-Fos animals were transcardially perfused, after 1 h and 30 min the acute injection of VU0409551 (5 mg/kg) or vehicle, as previously mentioned. 40 um free-floating brain coronal sections were blocked in 3% bovine serum albumin (neoFroxx, Einhausen, Germany) and 0.3% Triton (Roche, Basel, Switzerland) in PBS for 2 h at room temperature (RT). Slices were thereafter incubated with the primary antibody diluted in blocking solution for 48 h at 4 °C. primary antibodies: c-Fos (rabbit, abcam, ab190289), NeuN (guinea pig, Synaptic System, 266-004). After 3 washes in PBS, brain sections were incubated with the secondary antibody coupled to Alexa Fluor 568, 488 (Jackson ImmunoResearch, Cambridge, UK, 1:500) in blocking solution for 2 h at RT. After 3 further washes in PBS, the sections were mounted with ProLong Gold Antifade Mountant either with or without DAPI (Invitrogen, Waltham, Massachusetts, US).
Image acquisition and analysis
Images of brain coronal sections of cortex and striatum were acquired using a Zeiss AXIO Imager.Z2 microscope equipped with Aberrior STEDYCON for super-resolution STED Imaging. Images were acquired with a 100x oil immersion objective (Zeiss 100x Plan-apochromat) for both confocal and STED acquisition. The acquisition depth on the z-axis was 1 μm at acquisition intervals of 0.1 μm. Afterwards, super-resolution STED images were analyzed by area covered by the signal, puncta number, and mean intensity using Fiji software. Huygens Deconvolution software was used for the representative picture. Analysis was carried out on 3 WT mice and 3 Shank3 KO mice and 4 coronal slices were used per animal.
For the quantification of neurons-positive for cFos confocal images were acquired with a resolution of 1024 × 1024 pixels using laser-scanning microscope (Leica Microsystems) equipped with an ACS APO 63x oil immersion objective. The confocal images were then imported in Fiji software and the total number of neurons-positive for c-Fos was manually quantified. Immunohistochemistry analysis was carried out on at least 7 animals. 2 coronal slices per animal were stained and 2 confocal images were acquired per area.
Images of GFP-Cre-expressing brain areas immunostained for pre- and postsynaptic markers were acquired using laser-scanning microscope (Leica Microsystems) equipped with an ACS APO 63x oil immersion objective with a resolution of 2048 × 2048 pixels. Analysis of puncta number was conducted using Imaris software (Bitplane, Zürich, Switzerland).
IPSC generation and differentiation into neurons
The fibroblasts obtained from a patient diagnosed with Phelan McDermid syndrome and from controls were collected according to the clinical protocol approved by the local bioethical committees of different medical centers. Participating individuals were informed of the objectives of the study and were required to sign an informed consent document before inclusion in the study. The patient with Phelan-McDermid syndrome is a 6-year-old female with a 2574 kb deletion on chromosome 22q13. Clinically, she presents with neonatal and persistent hypotonia, delays in both fine and gross motor skills, intellectual disability, and severe language impairment. The control subject is a healthy, unaffected 6-year-old female. Blood cells were reprogrammed into iPS cells and differentiated into neural progenitor cells as previously described in Verpelli et al., 2013. Neural progenitor cells were differentiated into glutamatergic neurons using the Sudhof method [37, 38]. Briefly, neural progenitors’ cells were transduced with a virus expressing rtTA and with two viruses that separately expressed the Ngn2/puromycin resistance gene and EGFP. The second day, the Ngn2 expression was induced by adding doxycycline to the cell media, and on the third day, the puromycin selection began. From the fourth day, the cells were grown in differentiation media NT3 added with cytokines and doxycycline (Neurobasal, 2% B27 w/o vitamin A, 1% Glutamax, 1% Penicilline/streptomycin, BDNF 10 ng/ml, GDNF 10 ng/ml, NT-3 10 ng/ml, Retinoic Acid 1 μM and doxycycline 4 μg/ml) until day 50. Two independent clones for condition were used in our experiments.
Statistics
For all graphic data, n indicates number of biological replicates. The n values are reported in the figure legends. Sample normality was tested using the Shapiro-Wilk test. Based on the number of comparisons and the pattern of the data distribution, an appropriate statistical test was used to analyze the data. Unpaired two-tail t test or Mann-Whitney test were used to analyze the difference between two groups; One-way ANOVA followed by Tukey’s multiple comparisons test; Two-way ANOVA analysis followed by Bonferroni correction or Holm-Šídák’s multiple comparisons test; Fisher’s exact test. Statistical analyses were performed using Prism (version 9.4.1, GraphPad, San Diego, California, US). The significance level was set at p < 0.05 and displayed as follows: *p < 0.05; **p < 0.01; ***p < 0.001. All values are shown as presented as box and whiskers plot and presented as Min to Max; as bar diagrams and presented as mean ± SEM; XY table points and connecting line.
Results
Reduced Rpl3 expression and global protein synthesis in cortex and striatum of Shank3 KO mice
To identify the genes whose expression was altered in Shank3 KO mice, we performed next generation RNA sequencing (RNA-seq) analysis in cortical and striatal samples from WT and Shank3 KO mice. Using false discovery rate (FDR < 0.1) correction and a threshold of fold-change > 1.5 we estimated a linear model including genotype (WT vs KO), regional (Cortex, CTX; Striatum, STX; CTX vs STX) and their interaction effects. By using differential gene expression analyses to compare WT to Shank3 KO mice, we identified 4285 differentially expressed genes (DEGs) (2125 up-regulated and 2160 down-regulated) (Fig. 1a, Supplementary Fig. 1a–c and Table 1). Similarly, by comparing CTX with STX regions we found 498 DEGs (218 up-regulated and 280 down-regulated, Fig. 1a–c, Supplementary Fig. 1a–c and Table 2). Enriched analyses by Gene ontology and KEGG library did not show any significant term in all of the DEGs groups. By inspecting the DEG list (volcano plots in Supplementary Figure 1d, e) we found that in both striatum and cortex, besides Shank3, one of the most down-regulated genes in Shank3 KO mice was the ribosome-related gene Rpl3 (Fig. 1d). Moreover, in cortex of Shank3 KO mice, we also found a significant reduction in the expression of Rps9 gene, which codes for another ribosomal protein (Supplementary Fig. 2a). The western blot analysis (WB) confirmed that Rpl3 expression was reduced also at the protein level in total lysates and in synaptosomes isolated from cortex and striatum of Shank3 KO and WT mice. suggesting that Rpl3 dysregulation occurs in both whole lysates and synaptic compartments. (Fig. 1e–h). On the contrary, Rps9 protein expression was not different, in both brain areas, between WT and Shank3 KO mice (Supplementary Fig. 2b, c). Then, using immunofluorescence and confocal microscopy, we examined Rpl3 expression in cortex and striatum of Shank3 KO mice (Fig. 1i). As expected in both brain areas, we found a reduction in Rpl3 staining that was associated with a reduction in the density of Rpl3-positive puncta (Fig. 1j, k), which was more visible on the images acquired with the high-resolution STED microscopy (Fig. 1i right). The mean intensity of Rpl3 positive puncta was different between WT and Shank3 KO mice only in striatum (Fig. 1k). As a control, we also analyzed the expression of Rps7 by immunofluorescence and, as expected, we did not detect differences in both density and mean intensity of Rps7 puncta between WT and Shank3 KO mice (Supplementary Fig. 2d–f). The expression levels of other ribosomal proteins, such as Rps9, Rpl5, Rpl7A, Rpl8, Rps7, Rps19, Rpl36a, and Rpl37a, were not altered in the cortex and striatum of Shank3 KO mice (Supplementary Fig. 2g, h), suggesting that Shank3 specifically affects Rpl3 expression.

a Hierarchical biclustering (heatmap) of all the RNAseq genes in the cortex and striatum of WT (n = 3) and Shank3 KO (n = 3) mice. The colour spectrum from green to red represents the gene expression intensity from low to high, respectively. b Venn diagram shows upregulated DEGs in statistical comparisons contrasting genotypes (WT vs KO, shaded red) and regions (the cortex, CTX and striatum, STX, shaded blue) and their interactions (shaded green). The numbers indicate the number of DEG genes in each group. c Similar Venn diagrams for downregulated DEGs. d Logfold changes of Rpl3 shows a lower expression in the cortex and striatum of Shank3 KO mice. e and f Representative blots of Rpl3 expression e and relative quantification f of Rpl3 expression in total lysate and synaptosomes fraction (syn) from cortex of WT and Shank3 KO mice. Rpl3 protein levels were normalized to the corresponding βIII-Tubulin, and ratios were compared between genotypes. Cortex total lysate n = 6 per genotype; cortex synaptosomes fraction n = 4 per genotype. g and h Representative blots of Rpl3 expression g and relative quantification h of Rpl3 expression in total lysate and synaptosomes fraction (syn) from striatum of WT and Shank3 KO mice. Rpl3 protein levels were normalized to the corresponding βIII-Tubulin, and ratios were compared between genotypes. Striatum total lysate n = 6 per genotype; Striatum synaptosomes fraction n = 4 per genotype. i Comparison of Rpl3 signal imaged by both confocal and STED microscopy, scale bar 3μm. j and k Rpl3 signal resolved with STED microscopy show a reduction in area covered by signal and number of puncta in both cortex j and striatum k of Shank3 KO mice when compared with WT mice. k Shank3 KO mice show a reduction in striatum in mean intensity of Rpl3 signal when compared with WT mice. Cortex and striatum: n = 3 per genotype. All data are shown as box and whiskers plot. All Data are presented as Min to Max; all p-values were derived using the Mann-Whitney test (h total lysate) or the Unpaired t-test (f, h synaptosomes fraction, j and k). *p < 0.05; **p < 0.01; *** p < 0.001.
To clarify if the reduction in Rpl3 expression affected ribosomal function and protein synthesis, we used the SUnSET assay, in which puromycin, a structural analogue of aminoacyl tRNAs, is incorporated into nascent polypeptides and prevents elongation, allowing us to directly monitor protein translation. Adult (P60) Shank3 KO and WT mice were stereotactically injected into the lateral ventricles with puromycin. One hour after puromycin injection, mice were sacrificed, and cortex, striatum, and hippocampus were isolated, lysed, and the puromycin signal was analyzed by WB. Our results showed a significant reduction of overall protein translation both in total lysates and synaptosomes in cortex (Fig. 2a, b) and striatum (Fig. 2c, d), but not in hippocampus (Supplementary Figure 3a), of Shank3 KO mice compared to WT littermates. Interestingly, in hippocampus of Shank3 KO mice Rpl3 expression was not reduced compared to WT mice (Supplementary Figure 3b). These data suggest that Shank3 deletion caused a brain region specific alteration in Rpl3 expression and protein synthesis, and that there is a direct link between decreased protein synthesis and reduced expression of Rpl3. Moreover, the synaptic-specific reduction of Rpl3 and protein synthesis suggests that Shank3 loss affects ribosomal function not only globally but also in synaptic compartments. To confirm our hypothesis, we rescued Rpl3 expression in striatum of Shank3 KO mice by bilaterally injecting an Adeno-Associated Virus (AAV) expressing Rpl3 (AAV9-CMV-m-RPL3) and six weeks after the injection, we analyzed the Rpl3 protein level and the protein synthesis with SUnSET methods. As shown in Fig. 2e, stereotaxic injection of Rpl3 expressing AAV was sufficient to rescue Rpl3 expression (Fig. 2e) and protein synthesis (Fig. 2g) without modifying the Rpl3 level in cortex (Fig. 2f). These results confirm that Shank3 affects protein synthesis through the modulation of Rpl3 expression.
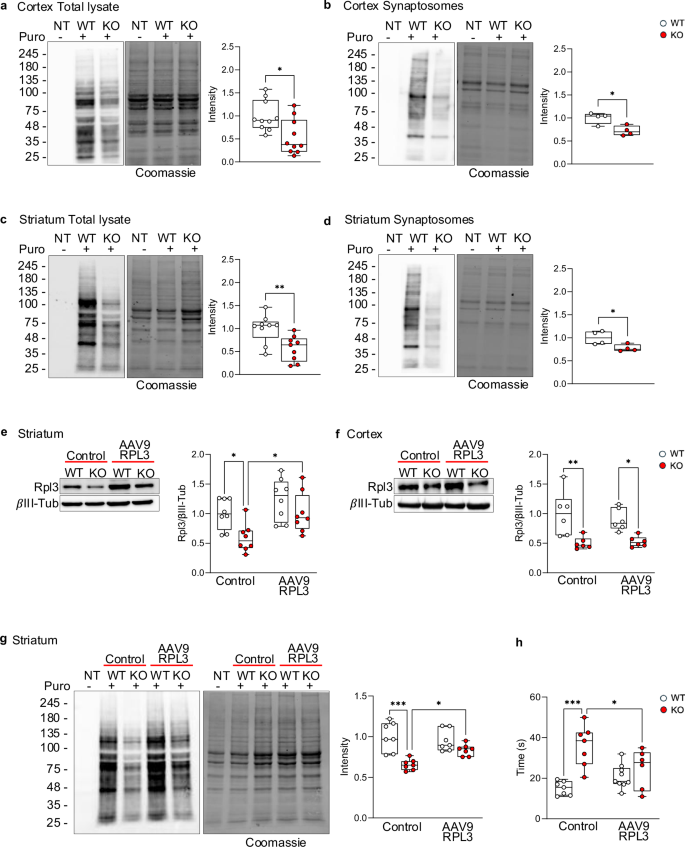
a–d Protein synthesis evaluated using the SUnSET assay in both total lysate a and c and synaptosomes fraction b and d of both cortex a and b and striatum c and d. The puromycin signals were normalized to the respective Coomassie staining signals. Cortex total lysate n = 10 per genotype; striatum total lysate n = 9 per genotype; cortex and striatum synaptosomes fraction n = 4. e and f Rpl3 protein levels after infection with AAV9-RPL3 or control in striatum was evaluated in striatum e and cortex f. Protein levels were normalized to the respective βIII-Tubulin and ratios were compared between groups. Cortex and striatum n = 6 per group. g Effect on protein synthesis in Shank3 KO mice after overexpression of AAV9-RPL3. The puromycin signals were normalized to the respective Coomassie staining signals. N = 7 per group. h Self-grooming time in WT and Shank3 KO mice after overexpression of AAV9-RPL3 or control in striatum. WT n = 7 per control, n = 9 per AAV9-RPL3; Shank3 KO n = 7 per control, n = 6 per AAV9-RPL3. All data are shown as box and whiskers plot. All data are presented as Min to Max; all p-values were derived using the Unpaired t-test a–d or the Two-Way ANOVA followed by Holm-Šídák’s multiple comparisons test e–h. *p < 0.05; **p < 0.01; *** p < 0.001.
Restoring Rpl3 expression ameliorates repetitive behavior of Shank3 KO mice
Given that (i) each brain area is differentially involved in the control of certain behaviors and (ii) that we found molecular alterations specifically in cortex and striatum of Shank3 KO mice, we wondered if restoring Rpl3 expression in striatum allowed us to rescue behavioral defects associated with striatal function, such as repetitive behavior. To ensure that Shank3 deletion in striatum was indeed associated with increased repetitive behavior, we selectively downregulated Shank3 in striatum or prefrontal cortex (PFC), as control. To this end, we bilaterally injected an adeno-associated virus, AAV9-hsyn-Hi-eGFP-cre. WPRE. SV40, in striatum or prefrontal cortex of Shank3 KO floxed mice on postnatal days (P) 30-34 [36]. Four weeks after the injections, we analyzed the mice’s behavior.
By assessing the efficacy of our approach of region-specific deletion, we confirmed that animals expressing Cre-recombinase in striatum showed a significantly lower density of Shank3 puncta in the striatum in comparison to the PFC (Supplementary Fig. 4a), Knockdown of Shank3 in striatum was sufficient to increase repetitive behavior, as shown by the elevated grooming time (Supplementary Fig. 4b), while Shank3 deletion in PFC was not sufficient to alter repetitive behavior (Supplementary Fig. 4c). Because it has been demonstrated that the PFC is implicated in social cognition, which is crucial for social hierarchy behavior [37] and for social dominance, we tested mice in which we knocked down Shank3 in PFC (Supplementary Fig. 4d) in the tube test. Here, the aggressiveness of each mouse was determined by the number of wins it gained when competing against other mice. Our results showed that specific deletion of Shank3 in PFC increased the aggressive behavior of mice (Supplementary Fig. 4e), while Shank3 deletion in striatum did not cause any alteration in mouse aggression (Supplementary Fig. 4f). Thus, these data confirm that deletion of Shank3 in the striatum specifically alters repetitive behavior. We then tested if restoring Rpl3 expression in the striatum was sufficient to ameliorate repetitive behavior caused by Shank3 deletion. To that end P30-34, WT and Shank3 KO mice were bilaterally injected in the striatum with the AAV9-CMV-m-RPL3 expressing Rpl3 and behaviorally tested 6 weeks later. Remarkably, restoring Rpl3 expression in striatum was sufficient to mitigate excessive grooming caused by Shank3 deletion (Fig. 2h). Taken together these data point to a causal link between Shank3 deletion, downregulation of Rpl3, reduced protein synthesis and behavioral deficits.
Chronic depression of mGlu5 receptor activity is sufficient to impairs global protein synthesis trough Rpl3 downregulation
It has been widely shown that the activation of group I metabotropic glutamate receptors (mGlu1 and mGlu5) regulates protein synthesis in neurons [38,39,40] and we have previously demonstrated that Shank3 deletion impaired mGlu5 intracellular signaling [9, 31]. Thus, we hypothesized that mGlu5 hypofunction might be the cause of altered Rpl3 protein expression and impaired protein synthesis that we found in cortex and striatum. To test our hypothesis, we treated WT cortical neurons in vitro at DIV18 with MTEP, a potent and selective antagonist of the mGlu5, to depress its activity. Our data indicate that acute suppression of mGlu5 function does not affect Rpl3 expression or protein synthesis. However, chronic depression (DIV14-18) significantly reduces Rpl3 expression, thereby impairing protein synthesis (Fig. 3a–c). Furthermore, we verified in vivo that chronically reducing mGlu5 activity by administering MTEP to wild-type mice from P7 to P14 (Fig. 3d) resulted in a significant decrease in Rpl3 protein expression in both the cortex (Fig. 3e) and striatum (Fig. 3f). This set of data demonstrates that mGlu5 modulates total protein synthesis by regulating Rpl3 protein expression in mice. To further establish the relevance of our findings in mice to human neurons, we differentiated human induced pluripotent stem cells (hiPSCs) from a healthy donor into neurons. We generated neural-rosette intermediate neural progenitors that we subsequently differentiated into cortical neurons by lentiviral transduction of the tetracycline-inducible expression of Neurogenin-2 [41]. We confirmed that, similar to our findings in mice, chronic suppression of mGlu5 in human neurons (Fig. 3g) significantly decreased Rpl3 expression (Fig. 3h). Next, we compared control neurons with neurons derived from a patient with Phelan McDermid syndrome (PMS) exhibiting SHANK3 haploinsufficiency. Consistent with observations in Shank3 KO mice, SHANK3 deletion in human neurons resulted in downregulation of Rpl3 expression (Fig. 3i) and a significant reduction in protein synthesis (Fig. 3k). This reduction was associated with lower levels of mGlu5 and Homer1b/c (Fig. 3i). We did not observe altered expression of other ribosomal proteins in PMS-derived neurons (Supplementary Fig. 5), as in Shank3 KO mice. Interestingly, prolonged activation of the mGlu5 receptor through 5 days of treatment with VU0409551 (40 µM), a new and highly selective mGlu5 positive allosteric modulator (PAM), rescued both Rpl3 protein expression (Fig. 3j) and protein synthesis (Fig. 3k).
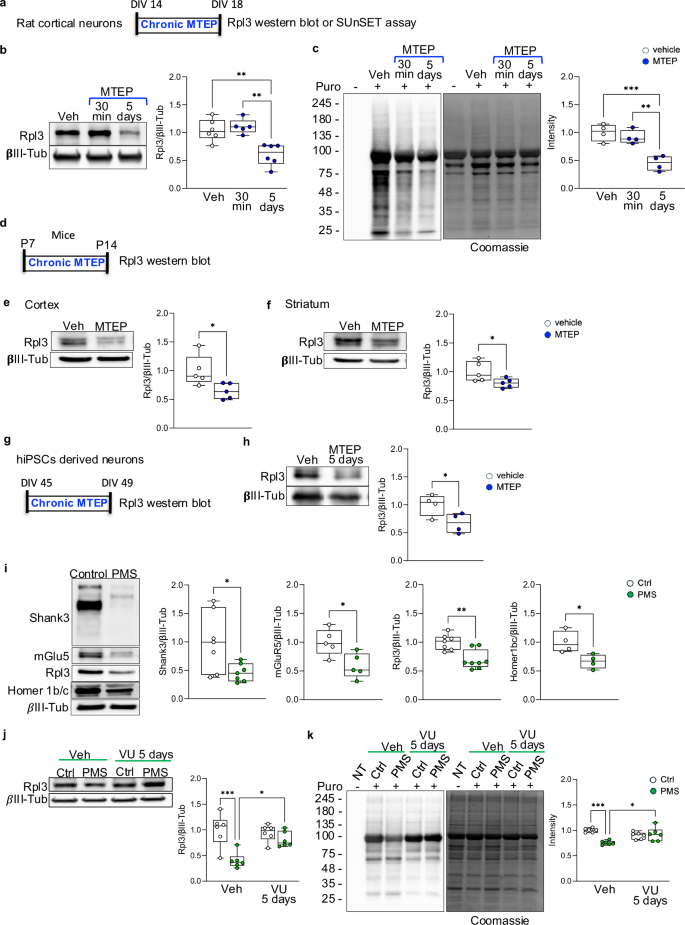
a Schematic representation of MTEP chronic administration in rat cortical neurons. b Rpl3 protein levels were analyzed by western blot in total lysate from rat cortical neurons at DIV18 after vehicle, 30 min acute treatment or 5 days chronic treatment with MTEP (30 nM). Protein levels were normalized to the respective βIII-Tubulin and ratios were compared between groups. Vehicle and 5 days treatment n = 6, 30 min treatment n = 5. c Protein synthesis levels in rat cortical neurons treat with vehicle, 30 min or 5 days treatment with MTEP (30 nM). The puromycin signals were normalized to the respective Coomassie staining signals. N = 4 per group. d Schematic representation of MTEP (3 mg/kg) administration in WT mice from 7 post-natal day to 14 post-natal days. e and f Protein levels of Rpl3 were analysed by western blot in total lysate obtained from cortex e and striatum f of WT mice treat with MTEP (3 mg/Kg) or vehicle from P7 to P14. Protein levels were normalized to the respective βIII-Tubulin and ratios were compared between groups. Cortex and striatum n = 5 per group. g Schematic representation of MTEP chronic administration in hiPSCs derived neurons. h Cortical neurons derived from iPSCs were treated with either a vehicle or MTEP (30 nM) for 5 days and Rpl3 protein levels was analyzed. The Rpl3 level was normalized to the respective βIII-Tubulin and ratios were compared between groups. N = 4 per group. i Protein levels of Shank3, mGluR5, Rpl3 and Homer1b/c in cortical neuron differentiated from iPSCs derived from a PMS patient and controls. Protein levels were normalized to the respective βIII-Tubulin and ratios were compared between groups. Shank3: n = 7 per group; mGluR5: n = 5 per group; Rpl3: n = 4 per group; Homer1b/c: n = 4 per group. i and j Cortical neurons derived from iPSCs from control and PMS patient were treated with either a vehicle or VU0409551 (40 mM) for 5 days. Rpl3 levels and protein synthesis were analyzed. j The Rpl3 level was normalized to the respective βIII-Tubulin and ratios were compared between groups. Control and PMS n = 5 per group. k The puromycin signals were normalized to the respective Coomassie staining signals. Control and PMS n = 6 per group. All data are shown as box and whiskers plot. All data are presented as Min to Max; all p-values were derived using the One-way ANOVA followed by Tukey’s multiple comparisons test b and c, the Mann-Whitney test (j Rpl3), the Unpaired T-test f–i or the Two-way ANOVA followed by Holm-Šídák’s multiple comparisons test j and K; *p < 0.05; **p < 0.01; *** p < 0.001.
Chronic treatment with VU0409551 rescues protein synthesis and Rpl3 protein expression in Shank3 KO mice
Next, we assessed whether chronic administration of VU0409551 could restore Rpl3 protein expression and correct defective protein synthesis in Shank3 KO mice. Wild-type (WT) and Shank3 KO mice were injected with VU0409551 (5 mg/kg) once daily from P60 to P75 (Fig. 4a). Twenty-four hours after the last drug administration, we analyzed Rpl3 expression. We confirmed that chronic treatment with VU0409551 successfully rescued Rpl3 expression in total lysates and in synaptosomes both the cortex (Fig. 4b, c) and striatum (Fig. 4d, e), and restored protein synthesis to WT levels (Fig. 4f–i and Supplementary Fig. 6a–d). However, since SHANK3 deletion causes a neurodevelopmental disorder, we also analyzed Rpl3 protein expression and protein synthesis during brain development (at P15). We confirmed a significant reduction in Rpl3 expression in cortex and striatum of P15 Shank3 KO mice (Fig. 5a, b) that was associated with down-regulated protein synthesis compared with WT mice (Fig. 5c, d and Supplementary Fig. 7a, b). Again, we did not detect any alteration in protein synthesis in hippocampus of P15 Shank3 KO mice (Supplementary Fig. 7c). To address the possibility of early life intervention, we wonder if chronic VU0409551 could rescue protein synthesis in juvenile mice as well. Pups were injected intraperitoneally with VU0409551 or vehicle for 15 days from P15 to P30 (Fig. 5e). Even during this developmental window, chronic treatment with VU0409551 was able to rescue Rpl3 and protein synthesis in both cortex (Fig. 5f and h and supplementary Fig. 7d) and striatum (Fig. 5g and i and supplementary Fig. 7e) of Shank3 KO mice to the level of WT mice without affecting the levels of other ribosomal proteins (Supplementary Fig. 7f, g).
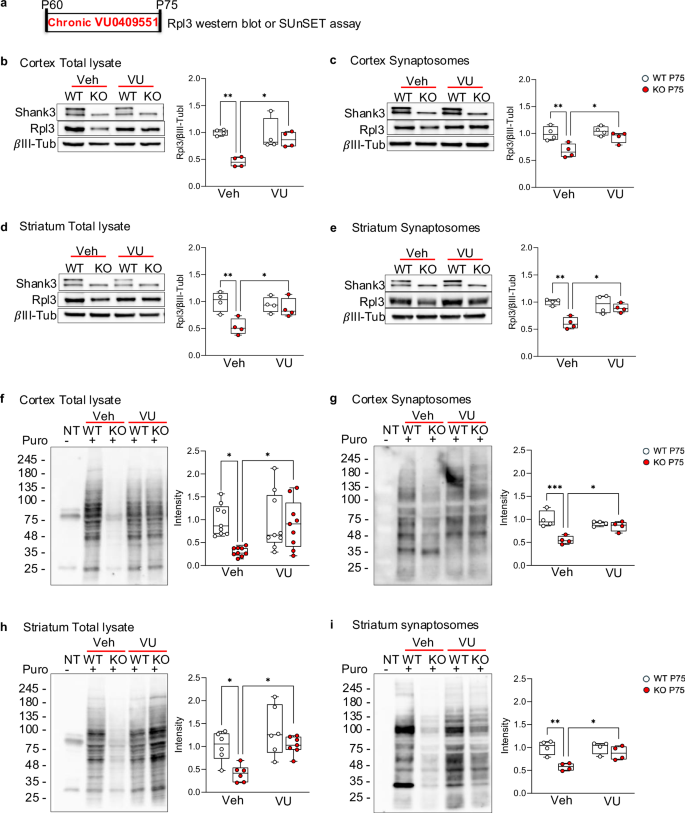
a Schematic representation of VU0409551 chronic administration in adult mice. b–e Protein levels of Rpl3 were analyzed by western blot in total lysate b and d and synaptosomes fraction c and e obtained from cortex b and c and striatum d and e of WT and Shank3 KO adult mice (post-natal-day 75) after chronic treatment with VU0409551 (5 mg/kg) or vehicle. Protein levels were normalized to the respective βIII-Tubulin and ratios were compared between groups. Cortex total lysate and synaptosomes fraction n = 4 per group; striatum total lysate and synaptosomes fraction n = 4 per group. f and i Protein synthesis level in adult (post-natal day 75) WT and Shank3 KO mice after chronic administration of VU0409551 (5 mg/kg) or vehicle in cortex total lysate (f and Supplementary Fig. 6a), cortex synaptosomes fraction (g and Supplementary Fig. 6b), striatum total lysate (h and Supplementary Fig 6c) and striatum synaptosomes fraction (i and Supplemenatry Fig. 6d). The puromycin signals were normalized to the respective Coomassie staining signals (Supplementary Fig. 6a–d). Cortex total lysate n = 9 per group; cortex synaptosomes fraction n = 4 per group; striatum total lysate n = 6 per group; striatum synaptosomes n = 4 per group. All data are shown as box and whiskers plot. All data are presented as Min to Max; all p-values were derived and calculated using the Two-way ANOVA followed by Holm-Šídák’s multiple comparisons test; *p < 0.05; **p < 0.01; ***p < 0.001.
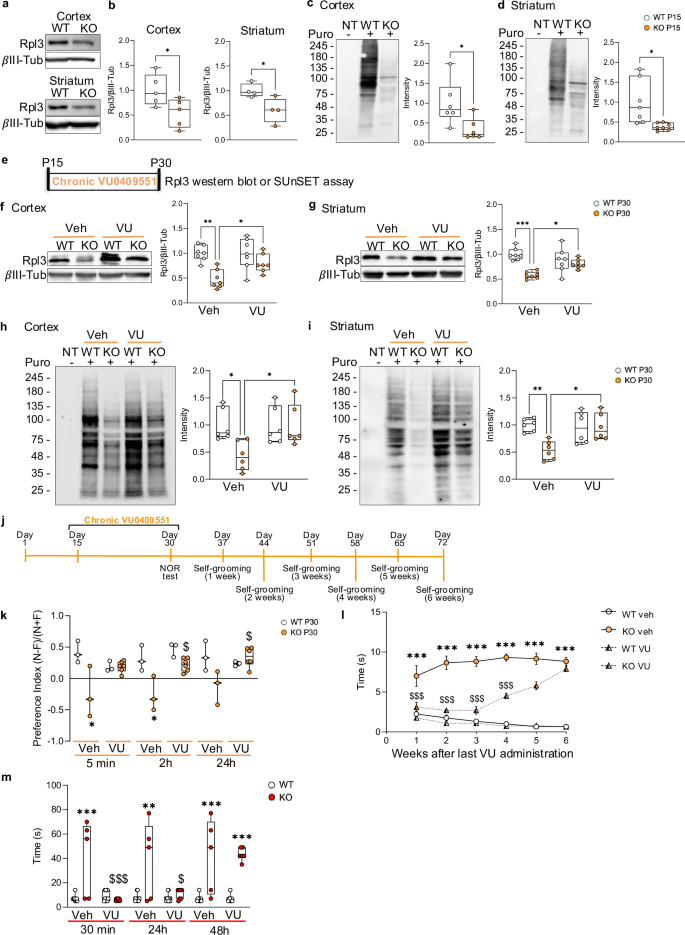
a and b Protein levels of Rpl3 were analyzed by western blot in total lysate obtained from cortex and striatum of WT and Shank3 KO young mice (post-natal-day 15). Protein levels were normalized to the respective βIII-Tubulin and ratios were compared between genotypes. Cortex n = 5 per genotype and striatum n = 4 per genotype. c and d Protein synthesis was evaluated in WT and Shank3 KO young mice (post-natal day 15) by the SUnSET assay. Representative images show the level of puromycin incorporated into cortex (c and Supplementary Fig. 7a) and striatum (d and Supplementary Fig. 7b). The puromycin signals were normalized to the respective Coomassie staining signals (Supplementary Fig. 7a and Supplementary Fig. 7b). Cortex n = 6 per genotype and striatum n = 8 per genotype. e Schematic representation of VU0409551’s chronic administration in young mice (P15-P30). f and g Protein levels of Rpl3 were analysed by western blot in total lysate obtained from cortex f and striatum g of WT and Shank3 KO young mice (post-natal day 30) after chronic treatment with VU0409551 (5 mg/kg) or vehicle. Protein levels were normalized to the respective βIII-Tubulin and ratios were compared between genotypes. Cortex and striatum n = 7 per group. h and i Protein synthesis level in young (post-natal day 30) WT and Shank3 KO mice after chronic administration of VU0409551 (5 mg/kg) or vehicle in cortex (h and Supplementary Fig. 7d) and striatum (i and Supplementary Fig. 7e) using SUnSET assay. The puromycin signals were normalized to the respective Coomassie staining signals (Supplementary Fig. 7d and Supplementary Fig. 7e). Cortex and striatum n = 6 per group. j Schematic representation of chronic VU0409551 (5 mg/kg) or vehicle administration in young mice (P15-P30), as well as a timetable for behavioral experiments. k Discrimination index derived from the novel object recognition test. WT n = 3 per group; Shank3 KO n = 3 per vehicle, n = 6 per VU0409551. l Self-grooming behavior was evaluated as time spent grooming at different time point. WT vehicle n = 12, KO vehicle n = 6, WT VU0409551 n = 11, Shank3 KO VU0409551 n = 10. m Self-grooming behaviour was evaluated as time spent grooming in animals treated with vehicle or VU0409551 (5 mg/Kg) in WT and Shank3 KO mice. WT n = 7 per group; Shank3 KO n = 3 per vehicle and n = 7 per VU040955. All data are shown as box and whiskers plot b–k and m or Mean and Error l. All data are presented as Min to Max b–k and m or as the mean ± SEM l; all p-values were derived using the Unpaired T-test b and d, the Mann-Whitney test c or the Two-way ANOVA followed by Holm-Šídák’s multiple comparisons test f–i; *p < 0.05; **p < 0.01; *** p < 0.001. (k-m) all p-values were calculated using the Two-way ANOVA with the Bonferroni post hoc test. *<p 0.05; **p < 0.01; ***p < 0.001 compared to the WT vehicle; $p < 0.05; $$$p < 0.001 when compared to WT VU0409551.
Prolonged improvement in ASD-like behavior after chronic treatment with mGlu5 PAM
Furthermore, we analyzed the effects of chronic treatment with VU0409551 on the behavior of Shank3 KO mice. Mice were injected intraperitoneally with VU0409551 or vehicle for 15 days from P15 to P30, and 24 h after the last injection, we tested the mice’s memory using the novel object recognition test (Fig. 5j). The performance of WT mice was unaltered by chronic administration of VU0409551, while the same treatment normalized the memory impairment of Shank3 KO mice after 5, 120 min, and 24 h (Fig. 5k). Finally, to explore whether rescuing protein synthesis by chronic treatment with VU0409551 had a long-lasting effect on the behavior of Shank3 KO mice, we treated mice from P15 to P30 and tested the grooming activity up to 6 weeks after the treatment (Fig. 5l). We found a reduction in grooming behavior of Shank3 KO mice treated with VU0409551 compared with Shank3 KO mice treated with vehicle up to 4 weeks after the end of drug administration (Fig. 5l). Importantly, chronic treatment during this sensitive developmental window did not cause any side effects like seizures in either WT or Shank3 KO mice. To ensure that the stable rescue of grooming behavior was indeed due to chronic treatment, we analyzed the effect of a single drug administration on reducing grooming in Shank3 KO mice. Our results clearly showed that 48 h after a single drug administration, treated Shank3 KO mice performed identically to untreated Shank3 KO mice (Fig. 5m). These data suggest that chronic potentiation of mGlu5 intracellular signaling has a long-lasting effect on the behavior of Shank3 KO mice by rescuing Rpl3 protein expression and consequently protein synthesis.
Acute administration of VU0409551 transiently rescues Shank3-related behavioral abnormalities through c-fos
Conversely, our findings suggest that acute administration of VU0409551 temporarily alleviated repetitive behavior in Shank3 KO mice (Fig. 5m). To better characterize the effect of acute treatment on the behavior of Shank3 KO mice we treated mice with VU0409551 or vehicle (veh) and we analyzed its activity on sociability and social novelty using a three-chamber test. We found a significant improvement in sociability (Fig. 6a) and social novelty test (Fig. 6b) in Shank3 KO animals injected with VU0409551 compared to Shank3 KO animals injected with vehicle. In terms of episodic memory, administration of VU0409551 was able to rescue memory at all analyzed time points (Fig. 6c). To analyze aggressive/dominant behavior, we used the tube test. Shank3 KO mice treated with vehicles won 80% of the matches against WT mice treated with vehicles and won 83.3% of the matches against KO animals treated with VU0409551. However, when we administered VU0409551 to WT and KO mice, we found that the WT animals won 60% of the matches, suggesting that the treatment with the drug was able to reduce the aggressiveness of mutant mice (Fig. 6d). Finally, we could show that acute treatment with VU0409551 rescued cognitive inflexibility, as demonstrated by the results of the T-Maze test, where Shank3 KO mice treated with vehicle or VU0409551 performed identically compared to WT mice in the acquisition phase of the test (Fig. 6e, g). During the reversal phase of the test, however, only Shank3 KO mice treated with VU0409551 were able to learn the new location of the pellet as well as WT mice (Fig. 6f, h). Interestingly, acute treatment with VU0409551 rescued altered behavior even when Shank3 was downregulated specifically only in striatum (Supplementary Fig. 8a) or in PFC (Supplementary Fig. 8b).
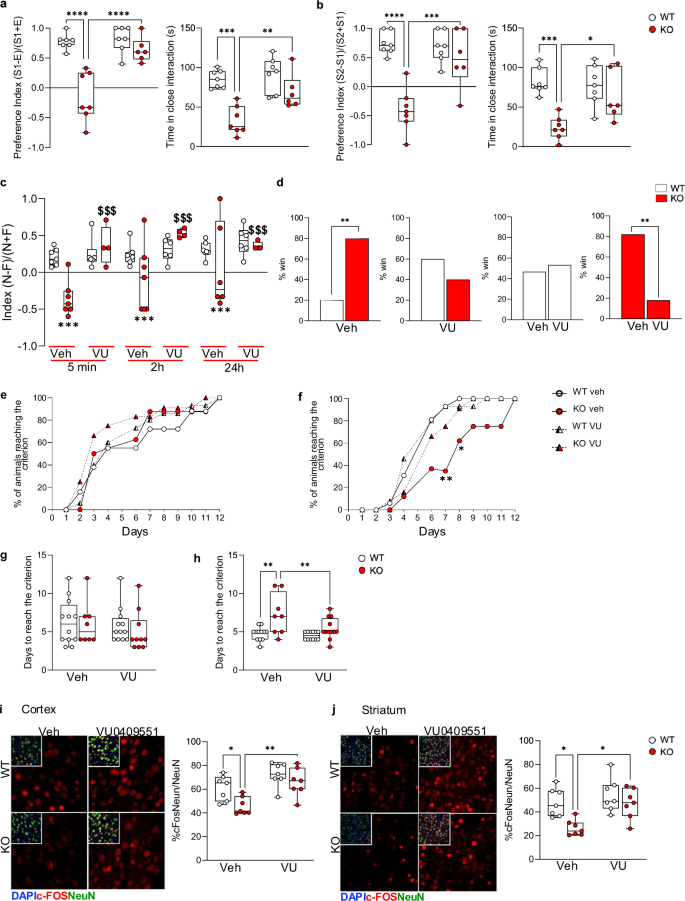
a and b Social behaviors are scored in sociability a and social novelty b tests. WT n = 7 per group; Shank3 KO n = 7 per vehicle n = 6 per VU040955. c Discrimination index evaluated in the novel object recognition test after acute treatment with vehicle or VU0409551 (5 mg/Kg) in WT and Shank3 KO mice. WT n = 7 per group; Shank3 KO n = 7 per vehicle n = 6 per VU0409551. d Social dominance expressed as a percentage of won matches in a tube test after acute treatment with vehicle or VU0409551 (5 mg/Kg) in WT and Shank3 KO mice. WT n = 10 per vehicle n = 15 per VU0409551; Shank3 KO n = 10 per vehicle n = 15 per VU0409551. e and g Acquisition and f and h reversal tasks in the T-Maze task were performed after daily treatments; % of animals reaching the criterion e and f and the number of animals reaching the criteria g and h were analyzed. WT n = 12; Shank3 KO n = 8 per vehicle n = 10 per VU0409551. i and j c-Fos levels were evaluated by immunostaining in cortex i and striatum j of WT and Shank3 KO mice treat with VU0409551 or vehicle. Corte and striatum n = 7 per group. All data are shown as box and whiskers plot a–c and g–j, bar diagram d or XY table points and connecting line e and f. All data are presented as Min to Max a–c and g–j); all p-values were derived using the Two-way ANOVA followed by Holm-Šídák’s multiple comparisons test a and b and g–j, the Fisher’s exact test d; *p < 0.05;**p < 0.01;***p < 0.001; ****p < 0.0001 or using the Two-way ANOVA Bonferroni post hoc test c and e, f; *p < 0.05; **p < 0.01; *** p < 0.001 versus the WT vehicle; $$$p < 0.001 when compared to corresponding WT VU0409551.
When we analyzed the effect of acute treatment with VU0409551 at the molecular level we found that a single administration of VU0409551 did not rescue the expression of Rpl3 and protein synthesis neither in cortex (Supplementary Fig. 9a, c) nor in striatum (Supplementary Fig. 9b and d) of Shank3 KO mice. As expected, we found no difference in the expression of other ribosomal proteins in cortex and striatum between WT and Shank3 KO mice (Supplementary Fig. 9e, f).
In order to investigate whether the effect of mGlu5 acute activation could result from neuronal activation we quantified the expression of the immediate early gene c-Fos. Baseline c-Fos expression was reduced in striatum of Shank3 KO mice compared to WT mice and was rescued by acute treatment with VU0409551 (Fig. 6i, j). These suggest that acute activation of mGlu5 might act on increasing altered neuronal recruiting in Shank3 KO mice leading to a transient recue of the behavioral deficits.
Discussion
In this study we identified a brain region-specific reduction in protein synthesis in Shank3 KO mice, resulting from Rpl3 downregulation that contribute to autism related behavioral deficits. Furthermore, we demonstrated that Rpl3 reduced expression and consequent impaired protein synthesis was caused by chronic depression of mGlu5 activity. Consistently, treatment with VU0409551, a potent mGlu5 PAM, restored Rpl3 protein expression and reduced protein synthesis in cortex and striatum of Shank3 KO mice, leading to long-lasting improvements in ASD-like behaviors. Using PMS patient-derived cells, we demonstrated that, in human neurons, SHANK3 deficiency impaired mGlu5 expression and function, leading to decreased Rpl3 expression and reduced protein synthesis, which was rescued by VU0409551 administration.
By using next-generation RNA sequencing analysis, we found that the most down-regulated gene in Shank3 KO mice was the ribosome-related gene Rpl3. Rpl3 is one of the eukaryotic ribosomal proteins and is essential for ribosomal biogenesis and function [16,17,18,19]; moreover, it plays an important role in intra-ribosomal communication by allosterically transmitting the ribosome’s tRNA occupancy status to the elongation factor binding region [20]. Alterations in the expression of genes associated with ribosomes were found in other Shank3 KO mice. RNA-Seq analysis of transcripts from mouse Shank3 KO mice lacking exons 14–16 showed that genes associated with ribosomes change in opposite directions consistently across different brain regions [39]. Another study found that the expression of ribosomal and ribosome-related genes was upregulated in striatum and mPFC of juvenile Shank3+/ΔC mice, while in adult Shank3 overexpressing mice it was downregulated in the same brain regions [40] and upregulated in the hypothalamus [41]. Rpl3 mRNA level was increased in the hypothalamus of Shank3 overexpressing mice, while it was unchanged in the striatum and mPFC of the same mice. None of these studies investigated whether these brain transcriptional changes were associated with changes in the proteome. At the protein level, using a proteomic approach, it has been found that six ribosomal proteins were upregulated in Shank3-overexpressing transgenic (TG) mice [42]. In our Shank3 KO mice, the expression of Rpl3 protein was significantly downregulated in cortex and striatum, but not in the hippocampus. In cortex of Shank3 KO mice, we also found a reduction in the expression of the Rps9 gene, which codes for another ribosomal protein. However, at the protein level, we did not find any difference in the expression of Rps9 or other ribosomal proteins between Shank3 KO and WT mice. Interestingly, by high resolution microscopy we found in cortex and striatum of Shank3 KO mice a reduction in the number of Rpl3-positive puncta, suggesting a possible reduction in the number of ribosomes that express Rpl3 in absence of Shank3. Although there are discrepancies among all these studies that might depend on the age and the different Shank3 exons that were deleted in the analyzed mice, all these results suggest that Shank3 might affect ribosomal gene expression. The ribosome is a complex molecular machine that translates messenger RNA (mRNA) into proteins. The human ribosome is composed of a small 40S subunit consisting of the 18S rRNA chain and 33 RPS proteins and a large 60S subunit encompassing the 28S, 5S, and 5.8S rRNA chains, and 47 RPL proteins. The correct ribosomal assembly is crucial for ribosomal functions, and a defect in even one of the components of this cellular apparatus can impair cellular function and defects in ribosomal biogenesis result in a group of diseases called ribosomopathies [43]. In particular, mutations in the ribosomal gene RPL10 have been found in patients with ASD [22,23,24,25] and it has been hypothesized that the human mutant Rpl10 proteins may alter the activity of ribosome and protein translation [24]. Two distinct missense mutations of another ribosomal gene, RPS23, were found in two patients with microcephaly, hearing loss, growth deficits, and dysmorphic features, and one patient presented with ASD [26]. Moreover, several studies linked neurodevelopmental disorders with changes in mRNA processing and translation [27, 28] suggesting aberrant protein synthesis as a central deficit in ASD. For example, in fragile X syndrome, a monogenic form of ASD, excessive protein synthesis is considered a key contributor to the pathology causing alteration in synaptic structure, function, and plasticity [44,45,46].
Our study showed that Shank3 knockdown leads to a strong reduction of Rpl3 protein expression and global mRNA translation in cortex and striatum that persists from juvenile to adult stages. Moreover, our data revealing a significant reduction in both Rpl3 expression and protein synthesis in synaptic-enriched fractions highlights that Shank3 influences ribosomal function not only at a global level but also within synaptic compartments, where precise regulation of protein synthesis is essential for the precise regulation of protein synthesis is essential for proper neuronal function. Importantly, rescue of Rpl3 in striatum of Shank3 KO mice was sufficient to restore protein synthesis defining a causal link between Rpl3 downregulation and reduced protein synthesis. Furthermore, at the behavioral level, Rpl3 overexpression in striatum of Shank3 KO, rescued exaggerated grooming, supporting the hypothesis that some behavioral impairments associated with Shank3 deletion are due to reduced levels of protein synthesis. However, further studies are needed to clarify if reduced expression of Rpl3 affects protein synthesis by altering ribosomal assembly and/or by affecting the speed and accuracy of translation. Although we did not find a change in protein synthesis in the hippocampus, other studies have shown molecular and functional changes in the hippocampus and other brain areas of Shank3 KO mice [47,48,49], emphasizing the importance of better characterizing brain region-specific mechanisms affected by Shank3 deletion.
It has been extensively demonstrated that Shank3 controls mGluR trafficking and intracellular signaling [9, 13, 31, 50]. In neurons, protein synthesis is controlled by different mechanisms and activation of group I metabotropic glutamate receptors (mGlu1 and mGlu5) has been implicated in modulating gene expression and mRNA translation. Our results suggest that chronic depression of mGlu5 activity is sufficient to impair Rpl3 expression and protein synthesis. Considering the discrepancies among ribosomal gene and protein expression found in different Shank3 KO mice and the fact that, while animal models allow us to study some of the basic mechanisms that cause ASD behavioral changes, they are far from humans, we confirmed that also in human neurons derived from a PMS patient SHANK3 deficiency impairs Rpl3 expression and protein synthesis.
Consistently potentiation of mGlu5 activity with VU0409551, a potent mGlu5 PAM, rescued Rpl3 expression and protein synthesis in Shank3 KO mice and in PMS derived neurons. However, how chronic modulation of mGlu5 activity modulates Rpl3 levels remains unclear and further studies are needed to identify the molecular mechanisms contributing to this deficit.
Finally, we showed that acute treatment with VU0409551 has a beneficial effect allowing a temporary improvement in the behavior of Shank3 KO mice without correcting impaired protein synthesis. We can speculate that acute and chronic activation of mGlu5 control different intracellular pathways. It has been demonstrated that acute potentiation of mGlu5 in Shank3 deficient neurons rescued decreased ERK1/2 phosphorylation and led to a transient increase in intracellular calcium release [9, 31], and that in a mouse model of Rett syndrome, AKT signaling was positively upregulated [51]. Our data suggest that mGlu5 acute activation might act on increasing altered neuronal recruiting in Shank3 KO mice.
Increasing studies underlies the importance of find molecular alteration that happen at early stages in neurodevelopmental disorders to open the possibility to correct them in these critical early postnatal periods and obtain long-lasting effects [52, 53]. Our data showed that rescuing Rpl3 protein expression and protein synthesis in juvenile mice has long-lasting effects on the behavior of Shank3 KO mice without inducing any side effect.
Several studies identified new targets to develop therapy for Shank3 related ASD [54,55,56]. However, there is still no approved treatment, and novel strategies are urgently needed. Our findings demonstrated that SHANK3 deficiency affects Rpl3 protein expression, ribosomal function and protein synthesis by downregulating mGlu5 receptor activity. In addition, they suggest that reduced protein synthesis is a key contributor to the SHANK3- related autistic behaviors, and that early, chronic postnatal potentiation of mGlu5 receptor function may be a strategy to correct Shank3 related behavioral phenotypes achieving long-lasting effects. Finally, our data provide new insights into the mechanism of action of mGlu5 PAMs and confirm that they might be promising as possible compounds for the treatment of individuals affected by SHANK3 deletion or mutations.

Responses