Signature of pre-pregnancy microbiome in infertile women undergoing frozen embryo transfer with gestational diabetes mellitus
Introduction
Gestational diabetes mellitus (GDM) refers to abnormal glucose metabolism that occurs during pregnancy1. The pathogenesis and exact etiology of GDM are currently unclear, but existing studies have shown that the main etiologies of GDM include insulin resistance (IR), genetic factors, and inflammatory factors. With changes in dietary patterns and increasing sedentary lifestyles, the prevalence of GDM has been increasing year by year2,3. GDM can lead to various adverse pregnancy outcomes, including preeclampsia, macrosomia, preterm delivery, postpartum hemorrhage, and neonatal respiratory distress syndrome. Furthermore, the probability of offspring developing diseases such as IR, impaired glucose tolerance, adult type 2 diabetes mellitus (T2DM), cardiovascular disease, and obesity is significantly increased.
Currently, the diagnosis of GDM mainly involves testing for fasting blood glucose and glucose tolerance during the 24–28th week of pregnancy4. However, diagnosing GDM at this stage does not provide ideal control of blood glucose during pregnancy. Early screening and diagnosis of GDM have received widespread clinical attention. However, there are also many pregnant women with normal blood glucose and body mass index (BMI) before pregnancy who are diagnosed with GDM in the second trimester. As such, it is an emergency to expand early-assessment measures to improve the early diagnostic accuracy of GDM.
The human microbiome, consisting of tens of thousands of related microorganisms and their genes colonized in the human body, is an important component of human life. Intestinal microorganisms participate in energy metabolism and the production of short-chain fatty acids, biosynthesis of vitamins, release of gastrointestinal hormones, maintenance of intestinal barrier function, and activation of the immune system by digesting and decomposing food in the intestine5. Studies have found that gut microbiome in pregnancy has been shown to differ from the non-pregnant microbiome6,7,8. Koren et al. 9 collected stool samples from 91 pregnant women (including 15 with GDM) for analysis. The results showed that in the late stages of pregnancy, compared to the normal group, the alpha diversity of intestinal microbiota decreased in GDM pregnant women. The abundance of Proteobacteria and Actinobacteria increased significantly, while the abundance of Faecalibacterium decreased. Through analyzing stool samples collected from pregnant women before oral glucose tolerance test (OGTT) blood collection, Su et al. 10 screened out five key bacterial taxa (Corynebacteriales, Nocardiaceae, Desulfovibrionaceae, Rhodococcus, and Bacteroidetes) and used the random forest algorithm to predict GDM. The area under the curve (AUC) was 0.99, with a sensitivity of 95.2% and a specificity of 96.9%, demonstrating the high potential of intestinal characteristic microbiota as diagnostic markers for GDM. With further research, there have been reports indicating that changes in the characteristics of intestinal microbiota in GDM pregnant women may start at an earlier stage, providing new insights for early prediction of GDM. Ma et al. 11 found that there were differences in the characteristics of intestinal microbiota between GDM pregnant women and healthy pregnant women at 10–15 weeks of gestation. Pinto et al. 12 discovered that in the early stage of pregnancy (10–15 weeks), the abundance of Prevotella in the GDM group was significantly reduced, while their fasting blood glucose levels and interleukin-6 (IL-6) levels increased. When the gut microbiota of pregnant women with GDM and elevated IL-6 levels was transplanted into the intestines of mice, the mice developed IR and elevated IL-6 levels 7 days after transplantation. This suggests that abnormal gut microbiome-induced inflammatory-like lesions and IR may be key driving factors for the development of GDM12, which further supports the idea that microbiome is a potential marker for early prediction of GDM.
If the risk of GDM can be predicted before pregnancy, it will be of great significance for the prevention and treatment of GDM. In this study, we aim to identify the marker species and explore the changes of gut microbiome in infertile GDM patients throughout the pregnancy by whole-genome sequencing (WGS) of fecal samples from healthy individuals and patients in three periods, pre-pregnancy (Pre), first trimester (T1) and second trimester (T2). We collected fecal samples and measured physiological and biochemical indicators from patients before embryo transfer as pre-pregnancy data. The reason for choosing this group of people is due to the uncontrollability of pregnancy timing in healthy populations, which makes it impossible to normalize pre-pregnancy microbiota data. By combining serological indicators, an effective prediction model in pre-pregnancy period is established and its accuracy is verified in the cohort, providing a promising strategy for early diagnosis of GDM.
Results
Study design and baseline data collection
Firstly, we recruited 69 pre-pregnancy women as the discovery cohort, 31 of which went on to develop GDM, as diagnosed by OGTT at 28 weeks’ gestation. The other 38 women served as the healthy controls (HCs). Serological data at pre-pregnancy and gut microbiome data at pre-pregnancy, T1 and T2 were collected to build predictive models. Then, other 124 women were recruited as the validation cohort, 39 of which went on to develop GDM, and data about 16S rRNA sequencing and metabolites were collected prior to conception (Fig. 1B).
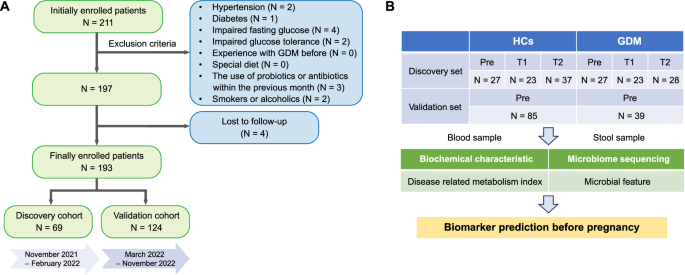
A Flow chart of patient inclusion. B Diagram of the study design. The discovery cohort was recruited during the pre-pregnancy (Pre), first trimester (T1) and second trimester (T2). The validation cohort was recruited during the pre-pregnancy (Pre).
For the discovery cohort, there was no significant difference in age, pre-pregnancy body mass index (BMI) and most of serum biochemical index, between control and GDM groups. While GDM group exhibited higher levels of fasted venous glucose and UA, but lower levels of Cys_C and HDL_C (Table 1). For the validation cohort, women diagnosed with GDM showed pregnancy at an older gestational age and serological indexes such as glucose, UA, CHOL, LDL_C, sd_LDL, and FBG were also higher than the control group (Table 2). Besides, in the two cohorts, there was no significant difference in the recorded health variables of newborns between the HCs group and the GDM.
The above results showed that although there is a certain correlation between diabetes risk and age, obesity, insulin level, etc., these basic data alone cannot effectively predict the occurrence of GDM. Therefore, we further focused on the changes in the bacterial structure of the cohort.
Changes in gut microbiota during the three periods of pregnancy
We first analyzed the WGS sequencing results of all samples from the three periods. At the genus level, four genera including Bacteroides, Prevotella, Bifidobacterium, and Faecalibacterium accounting for most of the total microbiome, and the abundance of Prevotella in the control group was significantly higher than that in the GDM group (Fig. 2A). Results were similar at the species level, showing that the abundance of Prevotella_copri was highest in most control populations (Fig. 2B). Neither alpha diversity nor beta diversity of the microbiota showed significant changes during the different stages of pregnancy, whether in the control group or the GDM group (Fig. 2C, D). In the control group, there was little difference in the dominant bacterial genera and species between Pre and T1, while obvious alteration occurred at T2, with Prevotella becoming the most significantly enriched genus. However, compared with T1, enriched bacteria of women with GDM changed at T2 (Fig. 2E). Compared to the control group, the changes occurred earlier in the GDM group, indicating that the gut microbiota structure in GDM is relatively unstable and disturbed as early as the second trimester of pregnancy. At the species level, the differentially abundant bacteria between the two groups were Eubacterium_sp_CAG_274, Rumiinococcus_bicirculans, Collinsella_aerofaciens and Alistipe_putredinis at Pre, Parasutterella_excrementihominis, Parabacteriodies_merdae, Bacteroids_dorei and Bifidobacterium_longum at T1, and Bacteroids_dorei and Anaerostipes_hadrus at T2 (Fig. 3). It is worth noting that with the increase in gestational weeks, the abundance of Bacteroids_dorei was significantly enriched in the GDM group, indicating that this bacterium may have a strong correlation with the occurrence and development of GDM. Considering the association between age and BMI with diabetes risk, we also analyzed these two indicators. There was no significant difference in age between the GDM and control groups (Supplementary Fig. 1A), and no significant difference in BMI between the two groups at Pre, T1 and T2 (Supplementary Fig. 1B). Additionally, no difference in beta diversity of the gut microbiota was investigated between the GDM and control groups across the three time periods (Supplementary Fig. 1C).
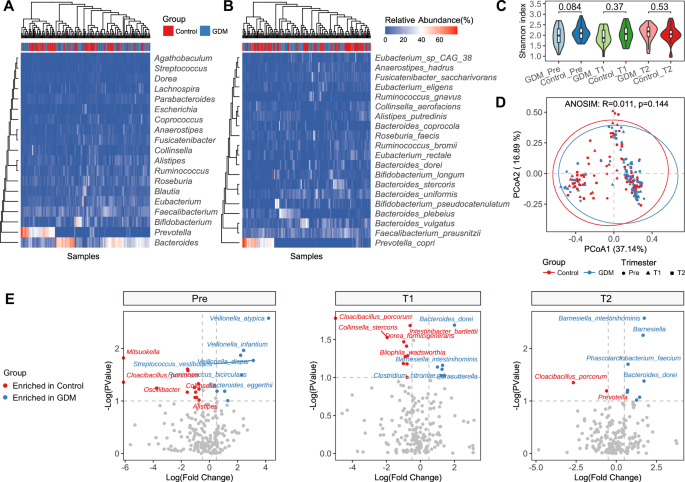
A The bacterial community structure at the genus level in the GDM group and the Control group across three time periods. B The bacterial community structure at the species level in the GDM group and the Control group across three time periods. C Shannon indexes between the different groups. D Principal coordinate analysis. PCoA based on Bray-Curtis distance is conducted, followed by an ANOSIM test to assess the significance of the differences between groups. E The bacterial genera and species enriched in the GDM group and the Control group during each of the three time periods. Pre, before pregnancy (transplantation); T1, 12 weeks after pregnancy; T2, 28 weeks after pregnancy.
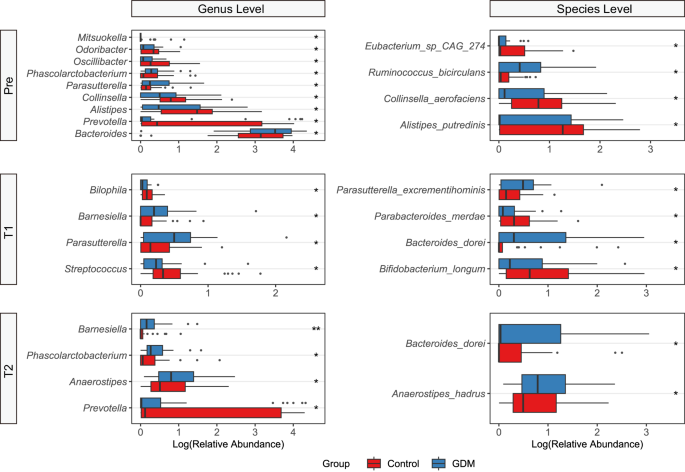
Wilcoxon rank-sum test was used to assess the significance of the differences between groups. *p < 0.1, **p < 0.01. Pre, before pregnancy (transplantation); T1, 12 weeks after pregnancy; T2, 28 weeks after pregnancy.
Taxonomic changes in microbial composition in patients diagnosed with GDM
During pregnancy progression, the abundances of P. copri and B. vulgatus increased, while the abundance of Faecalibacterium_prausnitzli decreased in the control group. In the GDM group, the abundances of F. prausnitzli and P. copri first increased and then decreased, while the abundance of B. vulgatus first decreased and then increased (Fig. 4A). Compared to when the pregnant women were enrolled in the study, there were no significant differences in the alpha diversity values of the microbiota in both groups at the end of the study, as indicated by the small fluctuation range in the Shannon index (Fig. 4B, C). However, there was a slight increase in the Shannon index in the GDM group at time point T2 (p = 0.08). The results of beta diversity analysis were like those of alpha diversity (Fig. 4D, E).
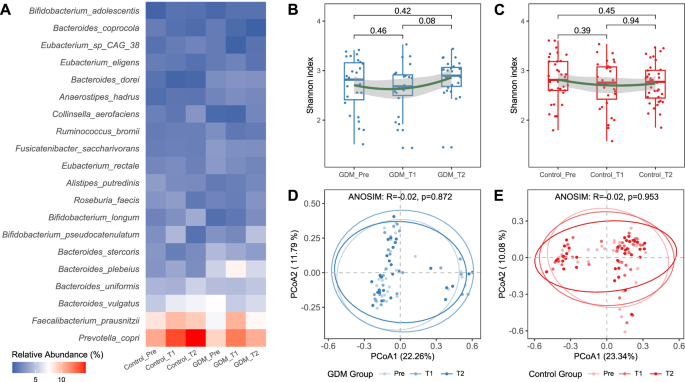
A Comparison of bacterial species abundance between the GDM group and the Control group across three time periods. B Changes in alpha diversity in the GDM group, Wilcoxon rank-sum test. C Changes in alpha diversity in the Control group, Wilcoxon rank-sum test. D PCoA analysis in the GDM group of three periods. PCoA in the GDM group of three periods based on Bray-Curtis distance. E PCoA analysis in the Control group of three periods. Pre, before pregnancy (transplantation); T1, 12 weeks after pregnancy; T2, 28 weeks after pregnancy. PCoA in the Control group of three periods based on Bray-Curtis distance.
Distinctive and shared microbial markers in GDM
Then, we shifted our focus back to the microbiota data before pregnancy in the cohort, aiming to identify characteristic bacteria that could be used for prediction. The genera with VIP scores greater than 1 found through Partial Least Squares Discriminant Analysis (PLS-DA) on pre-pregnancy WGS data include 18 genera such as Oscillibacter, Mitsuokella, Parasutterella, Barnesiella and so on (Fig. 5A). Meanwhile, the species with VIP scores greater than 1.5 include 16 species such as Ruminococcus_bircirculans, Oscillibacter_sp_57_20, Veillonella_atypica, etc (Fig. 5B). Bacterial markers identified by the random forest model differ slightly from those obtained through the PLS-DA algorithm, with Phascolarctobacterium, Parasutterella, Oscillibacter and Ruminococcus_bircirculans, Blautia_obeum, Oscillibacter_sp_57_20 exhibiting the most significant differences among the genera and species, respectively (Fig. 5C, D). Based on the combined analysis results of the two algorithms, we believe that Ruminococcus_bircirculans and Oscillibacter_sp_57_20 play an important role in the development of GDM. Besides, when we examined the beta diversity differences between the two groups using only the marker genera or species identified by the random forest model, we found that there was no significant difference at the genus level between the control group and the GDM group, but there was a significant difference at the species level (Fig. 5E, F). Similarly, when we examined the beta diversity differences between the two groups using only the marker genera or species identified by PLS-DA, we obtained consistent results with the above findings (Supplementary Fig. 2). The above results indicate that sequencing fecal samples to the species level can effectively distinguish healthy individuals from those with GDM before pregnancy, making it more clinically diagnostically meaningful.
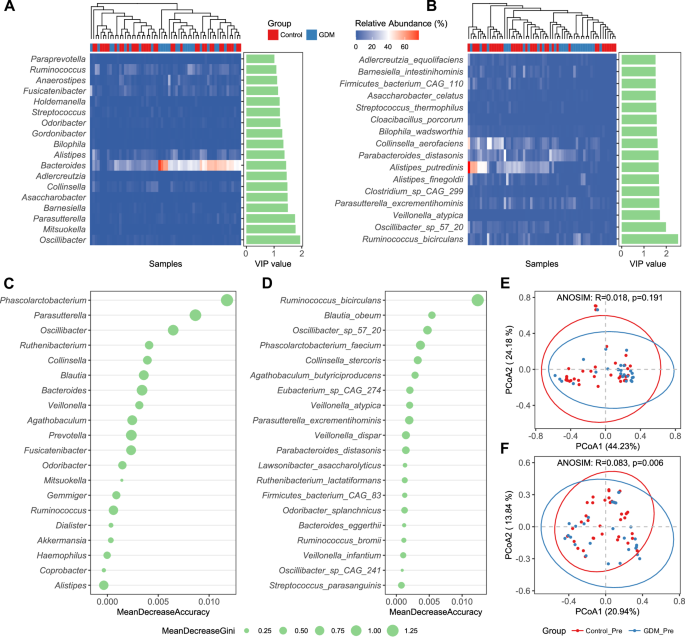
A The bacterial genera with VIP scores greater than 1 found by PLS-DA (Partial Least Squares Discriminant Analysis) on pre-pregnancy WGS data. B Species with VIP scores greater than 1.5. C The marker bacterial genera identified by the random forest model based on pre-pregnancy WGS data. D The marker bacterial species identified by the random forest model based on pre-pregnancy WGS data. E The beta diversity differences between the two groups by the random forest model based on the marker bacterial genera. F The beta diversity differences between the two groups by the random forest model based on the marker bacterial species. PCoA based on Bray-Curtis distance is conducted, followed by an ANOSIM test to assess the significance of the differences between groups.
Prediction performance for GDM before pregnancy
First, we trained a random forest (RF) model using only the marker bacteria or metabolic indicators to predict the validation cohort, and ranked the important bacterial markers and metabolites accordingly (Supplementary Figs. 3A, B). Next, using the marker bacteria identified from the discovery cohort, combined with the metabolite markers discovered by the RF, we trained a RF model based on 16S data to identify the top 20 important predictive indicators (Fig. 6A). We assessed the prediction performance using ROC curves in the pre-pregnancy validation cohort. The AUC of bacteria or metabolites alone for GDM was only 0.560 and 0.666, while the combination produced an AUC of 0.712 which greatly improved the accuracy of prediction (Fig. 6B). Faecalibacterium, Bacteroides, Prevotella and Ruminococcus account for more than a half of the whole bacteria abundance, and average abundances of Faecalibacterium and Ruminococcus in healthy pregnant women were much higher than the group of GDM (Fig. 6C). However, the level of P. copri in the GDM group was higher than that in the control group, which is contrary to the results of the previous discovery cohort (Fig. 6D). For the validation cohort, there is no significant difference in alpha and beta diversities between control and GDM groups, which is consistent with the results of the discovery cohort (Fig. 6E, F). It is worth noting that the top-ranked marker bacteria identified in the discovery cohort are not fully reflected in the validation cohort, indicating that the abundance of these bacteria is very low, but may have important predictive value for the occurrence of the disease.
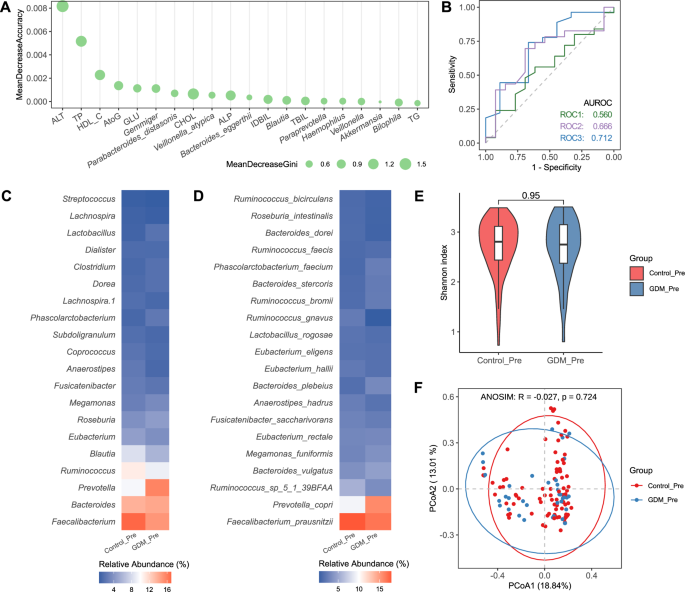
A The top 20 important predictive indicators by a random forest model training based on 16S rRNA sequence and metabolites data. B Validation of random forest classifiers composed of bacteria and metabolites in discriminating patients with GDM from HCs. C Relative abundances at the genus level. D Relative abundances at the species level. E Shannon index. F Principal coordinate analysis based on 16S rRNA gene sequence profiling of the microbiome. PCoA based on 16S rRNA gene sequence profiling of the microbiome, followed by an ANOSIM test to assess the significance of the differences between groups.
In addition, we examined how pregnancy outcomes vary in GDM patients with different gut microbiota profiles. When variations in microbial community composition are grouped into clusters, they can be referred to as enterotypes, serving as a highly effective classification for distinguishing human gut microbial communities13,14. Based on PAM clustering method, the CH index was used to cluster all fecal samples into different numbers of community types, and the optimal CH index was shown to be the best for two clusters (enterotypes) (Supplementary Fig. 4A). The principal component analysis (PCoA) showed that Faecalibacterium was the most abundant genus in type 1, while Prevotella was the most abundant genus in type 2 (Supplementary Fig. 4B, C). Enterotypes are not only related to dietary structure, but also closely associated with disease susceptibility, drug sensitivity, and the effectiveness of dietary interventions for weight loss15,16. However, neither in the control group nor in the GDM group did significant changes occur in the pregnancy outcomes including gestational age, neonatal height and neonatal weight of two enterotypes at the Pre period (Supplementary Fig. 4D, E), suggesting that enterotype is not a determining factor for adverse pregnancy outcomes in GDM patients.
Discussion
Based on the analysis of pre-pregnancy samples from the discovery cohort and the validation cohort, we conclude that gut microbiota plays a causal role in the development of some phenotypes of GDM, and their effects may be universal, as evidenced by the conservatism observed across the cohorts.
GDM is a high-risk pregnancy that not only tends to induce other pregnancy complications, but also affects the health of the fetus to a certain extent. Effective control of blood sugar during pregnancy can significantly reduce the incidence of complications for both mother and child. Notably, most of patients have no history of diabetes and only experience abnormal blood sugar levels during pregnancy, while a clinical diagnosis can only be made during the second trimester. Medical Nutrition Therapy (MNT) is the fundamental treatment for GDM, aiming to control blood sugar levels by regulating the dietary structure and food intake of pregnant women17. However, the effectiveness of this approach is limited by various factors, particularly in late pregnancy when blood sugar levels may exceed the normal range. In such cases, dietary control alone is insufficient, and pharmacological interventions may be required. Therefore, if a high risk of GDM during pregnancy can be predicted before conception, and a nutritional treatment plan is developed when the pregnant woman’s blood sugar is still within the normal range, better prevention, control, and treatment outcomes can be achieved. Pinto et al., have concluded that GDM onset can be diagnosed during the first trimester of pregnancy based on microbial and inflammatory markers12. Building on these findings, we hope to advance the timing of diagnosis and predict the occurrence of GDM before pregnancy, which is the primary objective of this study.
It is worth noting that this study selected infertility patients requiring in vitro fertilization (IVF) as the research subjects. We collected stool and serum samples from volunteers 7 days before embryo transfer to ensure consistency in the sampling time of pre-pregnancy microbiota data. This is because for those who conceive naturally, it is difficult to predict their pregnancy timing, making it hard to collect pre-pregnancy data. Although this group has certain limitations, it is of great significance for further exploring the association between gut microbiota and GDM. As previous studies have shown, compared with the spontaneous conception group, a significantly increased incidence of GDM was observed in the FET group18. The reasons might include that infertility factors in women, the hormone replacement treatment in FET procedures, and multiple pregnancies contributing to embryo transfer. For example, women with polycystic ovarian syndrome (PCOS) receiving IVF to conceive own a high chance of GDM. Because they may exhibit several endocrine disorders, such as obesity and IR19. Also, data have shown that progesterone use for corpus luteum support in IVF was seen as an important risk factor for GDM20. And estrogen used for endometrial preparation in FET results in an increased risk for GDM than natural cycle-FET21.
Several studies have found that the composition of intestinal microbiota in women with GDM has changed, most of which are based on samples collected after diagnosis. Our research results indicate that when controlling confounding variables, the microbial differences between the GDM group and the control group exist in pre-pregnancy and are driven by specific taxa rather than changes in the overall microbial community, resulting in subtle differences in composition. For example, we observed pre-pregnancy differences in the abundance of P. copri between GDM and HC individuals. P. copri is the most common species of Prevotella colonized in the human gut. It can degrade plant polysaccharides and mucin derived from the host, but cannot digest animal polysaccharides from dietary sources22. P. copri is an important biomarker of diet, and vegetarians tend to have higher levels of Prevotella and a higher Prevotella/Bacteroidetes ratio compared to non-vegetarians. Studies have shown that the genetic and functional characteristics of different strains of P. copri are related to dietary habits, and a diet rich in fiber can enhance its potential for carbohydrate catabolism. P. copri associated with omnivorous diets exhibit enhanced levels of leuB gene, which is involved in the biosynthesis of branched-chain amino acids and is a risk factor for glucose intolerance and T2DM23. F. prausnitzii is one of the most significant bacteria in the human gut microbiota, accounting for 5–15% of the total bacteria detected in fecal samples from healthy individuals24. It is an important producer of butyric acid, which has anti-inflammatory effects, maintains the activity of bacterial enzymes, and protects the digestive system from intestinal pathogens. It has been confirmed that the number of this microorganism is reduced in individuals with chronic constipation, celiac disease, irritable bowel syndrome, and inflammatory bowel diseases, including Crohn’s disease and ulcerative colitis. Additionally, lower levels of F. prausnitzii have been observed in patients with T2DM, colorectal cancer, and psoriasis25. In this study cohort, it was found that the abundance of F. prausnitzii in the GDM group was significantly lower than that in the control group before pregnancy, consistent with previous research reports. Besides, we also detected that P. distasonis is an important indicator ranked high in the prediction model. As a saccharolytic bacterium, P. distasonis can metabolize carbohydrates such as mannose and raffinose to produce energy, and can grow on culture media containing 20% bile26. Recent studies have found that P. distasonis has properties such as immune regulation, inflammation relief, carbohydrate metabolism, secretion of short chain fatty acids (SCFAs), and antibiotic resistance27. It has protective effects on host diseases such as non-alcoholic fatty liver disease, multiple sclerosis, obesity, T2DM, cancer, and inflammatory bowel disease, and can be used as a potential probiotic to promote human digestive health28,29.
Some studies have shown that the consumption of “meat and its derivatives” and “fatty and processed meat” before pregnancy is associated with a high risk of GDM. Sticking to the Mediterranean diet before pregnancy, especially eating less meat, may have a protective effect on the occurrence of GDM30. The species mentioned above are mainly carbohydrate-utilizing, indicating that dietary structure can lead to changes in the proportion of gut microbiota in the body. Increasing the proportion of carbohydrates in the diet can better promote the growth of beneficial bacteria, thereby reducing the risk of GDM occurrence. The results of this study also expound the correlation and potential mechanisms between MNT and GDM prevention and control from the perspective of gut microbiota.
It’s worth noting that there are differences in the regulatory effects of dietary factors on diabetes due to varying microbial community structures, indicating gut microbes is vital for diabetes improvement by dietary intervention. Different bacteria in the gut have different food preferences. For the predicted high-risk group of GDM, we can choose appropriate intervention methods based on the pre-pregnancy microbiota abundance, such as supplementing specific probiotics or dietary fiber, to target reducing or increasing certain types of bacteria. This allows the changes in the microbial community structure of pregnant women throughout pregnancy to develop towards a beneficial state, effectively controlling the progression of GDM. The predictive model obtained from this study has important reference value for clinical diagnosis and intervention. Of course, more clinical data need to be collected to analyze the correlation between the pre-pregnancy microbiota characteristics of naturally conceiving populations and GDM, in order to broaden its clinical application prospects.
In summary, our study indicates that there is a certain correlation between the composition of the pre-pregnancy microbiome and the risk of GDM in infertile women during pregnancy. Changes in the interaction between the host, microorganisms, and metabolites during pregnancy may be involved in the pathogenesis of the disease. The gut microbiota combined with biochemical parameters can be used as a biomarker to predict, diagnose, and evaluate the effectiveness of clinical interventions for GDM. Furthermore, our study provides insights into the changing characteristics of the intestinal microbiota and metabolites during pregnancy, which may serve as useful tools for discriminating GDM patients earlier, as well as offer references for the formulation of intervention and treatment strategies. Nevertheless, to comprehensively elucidate the underlying mechanisms and explore differential and personalized precision control strategies for improving pregnancy outcomes and promoting maternal and child health, the association analysis between GDM and the gut microbiota must be conducted based on the heterogeneity of its clinical metabolic phenotypes, with stratified and categorical discussions.
Methods
Study population and ethics
In this cohort study, a total of 211 infertile women who underwent frozen embryo transfer (FET) between November 2021 and November 2022 were consecutively enrolled. The inclusion criteria comprised females aged 20–45 years, with hormone replacement treatment for endometrial preparation and with a balanced diet of meat and vegetables. Conversely, the exclusion criteria consisted of individuals who had experienced diseases that affect pregnancy outcomes, including hypertension, diabetes, impaired fasting glucose, impaired glucose tolerance, experience with GDM before, and had a special diet (e.g., vegetarian diet), the use of probiotics or antibiotics within the previous month, or were smokers or alcoholics. A total of 193 participants were recruited for the study, as indicated in Fig. 1A. According to the sequence of patient enrollment, we finally consecutively recruited 69 volunteers as the discovery cohort (November 2021 to February 2022) and 124 volunteers as the validation cohort (March 2022 to November 2022). This study involves human participants and was approved by the Ethics Committee of Shengjing Hospital of China Medical University (2021PS016F). Written informed consent was obtained from all patients.
Biochemistry tests
Before embryo transfer, a panel of biochemical markers including aspartate aminotransferase (AST), alanine transaminase (ALT), γ-glutamyl transpeptidase (GGT), alkaline phosphatase (ALP), total bile acid (TBA), uric acid (UA), cystatin C (Cys_C), total cholesterol (CHOL), triacylglycerol (TG), high-density lipoprotein cholesterol (HDL_C), low-density lipoprotein cholesterol (LDL_C), small dense low-density lipoprotein (sd_LDL), homocysteine (HCY), fasting blood glucose (GLU), and fasting insulin (FINS) were assessed. The collected blood samples were promptly analyzed thereafter. GDM was diagnosed at 28 weeks’ gestation by 75 g OGTT using the International Association of Diabetes and Pregnancy Study Group (IADPSG) criteria31.
Pregnancy outcomes measures
The main pregnant outcomes included gestational age at delivery, preterm birth, birth weight, birth length and neonatal mortality. Preterm birth (PTB) was defined as birth before 37 completed weeks of gestation or fewer than 259 days from the first date of the woman’s last menstrual period (LMP) by the World Health Organization (WHO). Fetal macrosomia was defined as a birth weight ≥4000 g32.
The collection of stool samples
As for the discovery cohort, the stool samples were collected by patients themselves at home at 3 points: on the day of the endometrial transformation (about 7 days before embryo transfer, Pre), at 12 weeks’ gestation (T1) and at 28 weeks’ gestation (T2). As for the validation cohort, the stool samples were collected only at the Pre period. The stool sample was stored at −80 °C until fecal DNA isolation.
Extraction of microbiota DNA
Bacterial DNA was extracted from the stool samples using the DNA extraction reagent (Heas Biotech [Beijing] Co., Ltd, Beijing, China), following the manufacturer’s protocol. The concentration of DNA was measured using a Qubit 2.0 fluorometer (Life Technologies, Carlsbad, CA, USA).
16S rRNA full-length assembly sequencing (16S-FAST) and whole-genome sequencing (WGS)
In this study, WGS was used for analysis of the discovery cohort and 16S-FAST was used for analysis of the validation cohort.
16S-FAST was performed via the methods described in Dong’s study33. The bacterial DNA in the sample was extracted, followed by amplification of full-length 16S rRNA using polymerase chain reaction (PCR) and addition of specific molecular tags to each amplified 16S rRNA molecule. The resulting amplification products were fragmented using the Tn5 enzyme, and sequencing libraries were constructed as the read-tag and link-tag libraries. Illumina sequencing technology was utilized to sequence the spliced and link-tag libraries, and the resulting data was analyzed using bioinformatics tools.
For WGS, DNA libraries were prepared using the UltraClean Universal Plus DNA Library Prep Kit for Illumina V3 kit (Vazyme, UND637). Following library construction, the Agilent 2100 bioanalyzer was utilized to assess the length of the inserted fragments within the library, and the library’s effective concentration was accurately quantified using the Q-PCR method to ensure quality. Subsequently, libraries that passed inspection were combined based on their effective concentration and the desired data volume for the target machine. And then the sequencing was performed by Illumina PE150.
Sequencing data processing
For 16S rRNA sequencing data, QIIME2 (version 2021.11)34 pipeline was used for quality control and taxonomic assignments. After importing raw sequence data into QIIME2, DADA235 was used for quality control including quality filtering, paired-end read merging, denoising and chimera removal to construct exact amplicon sequence variants (ASVs). A table of 16S rRNA ASVs was generated and then annotated using the feature classifiers that were trained using full-length hypervariable regions of 16S rRNA genes against the SILVA (version 138)36 reference database clustered at 99% identity. The taxonomic tables at different levels (genus and species) were obtained from QIIME2 online tool (https://view.qiime2.org/). Relative abundances were calculated for each sample at the corresponding taxonomic level with total abundances of 100%.
For metagenomic sequencing data, FastQC (version 0.11.9, https://www.bioinformatics.babraham.ac.uk/projects/fastqc/) was used for quality control. The bioBakery337 pipeline was used to quality control and assign taxonomy. Kneaddata (version 0.12.0, https://huttenhower.sph.harvard.edu/kneaddata/) was applied to remove low-quality bases and host sequences to obtain clean reads. MetaPhlAn 3 (version 3.0) was subsequently performed with default parameters for taxonomic assignments. The relative abundances were calculated at the genus or species levels with a total abundance of 100%, respectively.
Bioinformatics analysis
All bioinformatics analysis were conducted in R (https://cran.r-project.org/, version 4.1.0) within Rstudio (https://www.rstudio.com/, version 1.4.1717) and visualized using the R package ggplot2 (version 3.4.1)38. Alpha diversities were calculated via the Shannon index with R package vegan (https://cran.r-project.org/web/packages/vegan/, version 2.6–2). Between-sample differences in community composition were quantified as Bray–Curtis dissimilarity. Differences in community structure were quantified using the anosim function in the R package vegan. Partial least squares discriminant analysis (PLS-DA) was performed using the R package ropls (version 1.26.4)39 to identify taxonomic differences and changes in response to GDM40. The VIP (Variable Important in Projection) values were used to rank the ability of different taxa to discriminate between different groups. Differences between groups were evaluated using Student’s t-test or two-sided Wilcoxon rank-sum tests for continuous variables.
Model construction and prediction
Random Forest (RF) binary classifiers were trained using the R package randomForest (version 4.7–1.1)41 for distinguishing healthy and GDM subjects on both the discovery and validation cohorts. All the samples from the discovery cohort were used to train the RF model for identifying differential taxa. By combining these key taxa, the differential taxa in PLS-DA analysis from the discovery cohort, and the biochemical markers of the validation cohort, we trained the final RF model on the validation cohort to predict GDM subjects. 70% of the samples in the validation cohort were randomly selected as the training set in predictive RF models, and the rest of the samples were used as the test set. The highly ranked microbial features were considered predictive signatures for further interpretation. Mean Decrease Accuracy was used to evaluate the impact of variables on the accuracy of a RF model. Mean Decrease Gini measures the contribution of variables to decreasing the Gini index. Both indicators reflected important differential taxa between the two groups. The AUC values were calculated accordingly for the visualization of the results. The ROC curves were plotted using the function ggroc in the R package pROC (version 1.18.0)42.
Enterotype analysis
To determine whether the pregnancy outcome is related with enterotypes in the healthy and GDM subjects, we conducted the enterotype analysis on the validation cohort at the genus level. Samples were clustered using partitioning around medoids (PAM) clustering algorithm based on Jensen-Shannon distance (JSD), and the optimal number of clusters was estimated using the Calinski-Harabasz (CH) index13. In our study, the enterotype can be optimally divided into two types (Faecalibacterium-dominant and Prevotella-dominant enterotypes), while the CH index is the largest.
Statistical analysis
Statistical analysis of clinical and biochemical variables was conducted using SPSS statistics 23.0 (IBM, Armonk, NY, USA). The normality of the data was assessed using the D’Agostino & Pearson normality test. Normally distributed data are presented as mean ± Standard Deviation (SD), while non-normally distributed variables are reported as median with 25–75th interquartile range (IQR). Categorical variables are presented as numbers (percentages). Comparisons between two groups were made using the Student’s unpaired t-test for parametric data or Mann-Whitney U test for non-parametric data. Comparisons between categorical variables were performed using the Pearson’s chi-squared test. Statistical significance was determined at a p < 0.05.


Responses