Simulation of clinical trials of oral treprostinil in pulmonary arterial hypertension using a virtual population

Introduction
Pulmonary arterial hypertension (PAH) is a disease of the pulmonary vasculature in which remodeling and stiffening of arteries drive elevated pulmonary arterial pressure and dysfunction of the right ventricle. Multiple factors contribute to risk of developing PAH, but all converge to similar pathological processes involving hypertrophy/hyperplasia of endothelial cells, smooth muscle cells (SMC), and fibroblasts, along with excessive production of extracellular matrix and smooth muscle contractility1. Oral treprostinil is approved for PAH to improve exercise capacity and delay disease progression2,3 and has also been shown to improve hemodynamics through reduced pulmonary vascular resistance (PVR) and increased pulmonary arterial compliance (PAC)4. Treprostinil is a prostacyclin (PGI2) analogue which induces vasorelaxation via binding to the prostanoid receptors, particularly IP, EP2, and DP. Other approved PAH therapies also induce vasorelaxation by targeting the endothelin receptor and nitric oxide (NO)/cyclic GMP (cGMP)/phosphodiesterase 5 (PDE5) pathways5,6. Double and triple combination therapy regimens are common and have been shown to extend time to clinical worsening7 and are recommended as a first line treatment for patients8.
With multiple routes of pathogenesis and therapeutic classes, mathematical modeling can be valuable in exploring variability in responses among PAH patients. Pharmacokinetic / pharmacodynamic (PK/PD) modeling has been used to characterize hemodynamic and exercise capacity responses to the PGI2 mimetic selexipag and the endothelin receptor antagonist (ERA) macitentan across varying drug exposures9,10. However, empirical approaches such as PK/PD models provide a limited ability to extrapolate to populations with different characteristics. Quantitative systems pharmacology (QSP) models include disease and drug mechanisms from a variety of experimental data sources and can therefore facilitate in silico analysis of novel targets, combinations, and other scenarios lacking clinical data11. This mechanistic focus makes QSP a promising method to apply in designing clinical trials for PAH, where combination therapy has become common.
Clinical studies of oral treprostinil have tested different dosing regimens, with the current, most utilized regimen of three times daily dosing providing improvements in the PK profile relative to twice daily dosing. Recent clinical studies have focused on induction with parenteral treprostinil to initiate oral treprostinil at a higher dose12,13 and characterizing the effects of treprostinil on risk status14. In preclinical studies, the receptor binding characteristics of treprostinil and other PGI2 mimetics have been characterized, with differential effects on smooth muscle cell proliferation depending on drug-specific receptor binding profiles15. The ability of QSP modeling to integrate diverse data sources such as these makes it a valuable tool for designing clinical trials as new classes of drugs are added to the PAH treatment landscape. In this study, we evaluate a QSP model of PAH (Fig. 1) in the context of a virtual population to explore its ability to forecast the results of clinical trials (Fig. 2). We hypothesize that by training our virtual population model on pre-existing trial data, we can accurately predict how changes in trial design will affect the response for a trial to which the model was blinded. We anticipate that this can serve as both a validation of our model and a demonstration of how QSP can be useful in guiding clinical trial design.

The model consists of endothelial and smooth muscle cell compartments. Communication between cells occurs through endothelial cell production of PGI2, NO, and ET-1. Within smooth muscle cells, these mediators modulate actin-myosin coupling and the cell proliferation rate. These two factors control PVR. ITGβ1 integrin β1, MSCC mechanosensitive calcium channels, PKC protein kinase C, eNOS endothelial nitric oxide synthase, NO nitric oxide, TRE treprostinil, PGI2 prostacyclin, ET-1 endothelin-1, ERA endothelin receptor antagonist, PDE5 phosphodiesterase-5, PDE5i phosphodiesterase-5 inhibitor, sGC soluble guanylate cyclase, IP3 inositol trisphosphate, ROCC receptor operated calcium current, VDCC voltage-dependent calcium current, RyR ryanodine receptor, IP3R IP3 receptor, MLCK myosin light chain kinase, MLCP myosin light chain phosphatase, M myosin, Mp phosphorylated myosin, A actin, SMC smooth muscle cell, F force, PVR pulmonary vascular resistance.
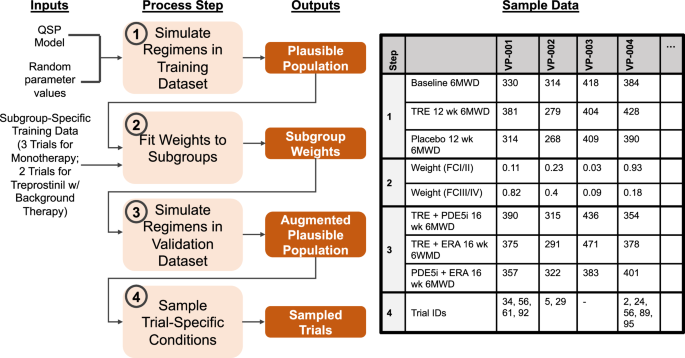
The 4 steps of workflow are listed in light orange boxes, with the outputs from each step in dark orange boxes. Sample data is given to illustrate each step’s output for 4 virtual patients (VPs). Trial IDs indicate the trials (if any) in which each VP is a member.
Results
Optimization of contraction and proliferation scaling parameters
The values of two scaling factors, αforce and αprolif, which control the influence of SMC contractile force and cell number, respectively, were optimized to match short term PVR data for PAH patients treated with vasodilators. The results of this optimization are shown in Table 1.
Plausible population characteristics
To simulate clinical trials, we generated a plausible population and exposed this population to treatment regimens matching the FREEDOM-M3, PHIRST5, ARIES6, FREEDOM-C16, and FREEDOM-C217 trials. We assessed the impact of each of the seven population variables by calculating the correlation of the variables with the change in PVR (ΔPVR) over 12 or 16 weeks after exposure to the three classes of PAH therapies (Fig. 3a). The ET-1 production rate was negatively correlated with ΔPVR for each therapy (Fig. 3c), whereas it was positively correlated with the placebo (untreated) ΔPVR (Fig. 3b). PGI2 production and IP receptor expression had the opposite trend, with positive treatment correlations and negative placebo correlations. These results confirm that a sufficient number of parameters are varied between virtual patients to allow for a variety of outcomes among treatment and placebo arms. This differential response is necessary for the virtual population to simultaneously match the results of multiple trials.
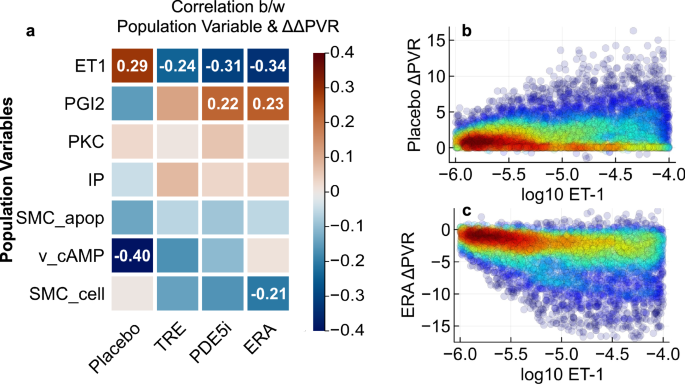
a Pearson correlation coefficients between population variables and change in PVR across the 4909 patients in the virtual population are shown, with red indicating positive correlation and blue indicating negative correlation. Correlation values are shown for those whose absolute values exceed 0.2. Scatter plots show the correlation of ET-1 production rate with placebo- (b) and ERA-induced (c) effects on PVR. Colors indicate local densities of points.
Out of 5000 virtual patients, 4909 had physiological values of six-minute walk distance (6MWD) between 100 and 600 m. Overall, the range of 6MWD variability in the plausible population fell within expected ranges at baseline and several time points after initiation of treatment for placebo and PAH therapy-treated simulations (Fig. 4). This indicates that the plausible population is sufficiently diverse to be able to match actual clinical trials.
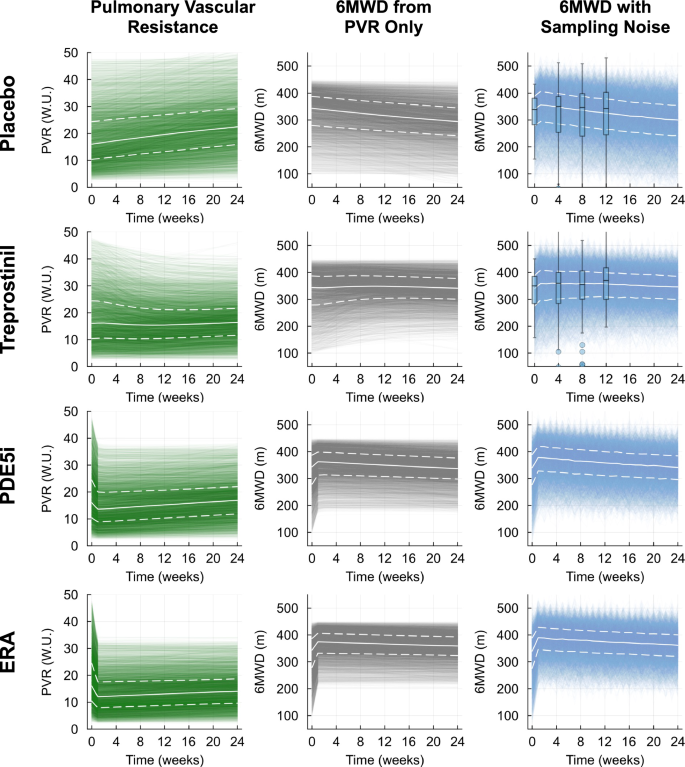
Pulmonary vascular resistance (PVR; left column, green), six-minute walk distance (6MWD) calculated from PVR only (middle column, gray), and 6MWD calculated from PVR and corrected for sampling noise (right column, blue). White solid lines indicate virtual population median values, while white upper and lower dashed lines indicate virtual population 75th and 25th percentiles, respectively. Box plots for placebo- and treprostinil-treated adjusted 6MWD indicate the median, 75th, and 25th percentiles from clinical data gathered in the FREEDOM-M study at weeks 0, 4, 8, and 12.
Model calibration
After calibration of prevalence weights for FCI/II and III/IV patients in the five fitted trials, we assessed the fit by using the prevalence weights to sample 100 virtual trials for each clinical trial of interest. We first verified the ability of our calibration procedure to capture differences between functional class I/II and III/IV populations. In the treprostinil monotherapy (FREEDOM-M) virtual trial samples, 60 out of 100 trials had at least one population variable that significantly differed between the FC I/II and FC III/IV populations. Most of these 60 trials had only one variable that differed, while a handful had two and, more rarely, three variables with significant differences. The most common differing variables were ET-1 production and initial number of SMCs (Fig. 5a). The FCIII/IV virtual patients had lower endogenous ET-1 production and higher initial numbers of SMCs. This prediction of the virtual trial aligned with the expected trends but could not be verified clinically due to the difficulty of measuring these variables.
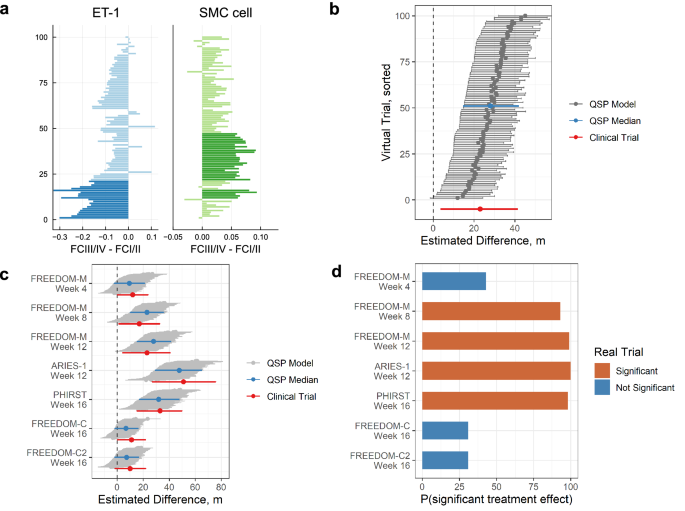
a Differences of ET-1 production rate, and number of SMCs between WHO functional class categories for 100 sampled FREEDOM-M virtual trials. Positive differences indicate larger values in FC III/IV than I/II. Bolded colors represent significant differences (Wilcoxon rank-sum test p < 0.05). Values for ET-1 production rate are shown as log10 differences. b Hodges–Lehmann median difference in 6MWD between treatment and placebo arms for 100 sampled FREEDOM-M trials at week 12 (median difference shown with gray dots, horizontal bars correspond to 95% confidence intervals). Trials are sorted by the lower bound of the 95% CI, and the median sampled trial is highlighted in blue. Results from the FREEDOM-M trial are shown in red. c Hodges–Lehmann median difference in 6MWD between treatment and placebo arms for all fitted trials. Gray regions correspond to 95%CI across 100 trials, with the median trial in blue. Trial data is shown in red. d Probability of a significant 6MWD treatment effect in our sampled virtual trials for each fitted arm. Significance of the real trial is indicated by orange (significant) or blue (not significant).
Across the training trials, the range of simulated 6MWD treatment effects matched the clinical trial data well (Fig. 5b, c). The 12-week median treatment effects for 100 sampled FREEDOM-M virtual trials ranged from +6 m to +39 m, with a median across trials of +25 m (Fig. 5b). This was in close agreement with the actual 12-week treatment effect of +23 m (95% CI, 4–41 m)3. While the treatment effects matched well, the 95% confidence intervals covered slightly smaller ranges in the simulated trials than in the actual trial. We observed similar agreement in median treatment effects across other time points and trials: the treatment effects in sampled virtual FREEDOM-M trials increased from week 4 to 12 (Fig. 5c) as seen in the clinical trial3. The sampled virtual trial treatment effects for the ERA and PDE5 inhibitor (PDE5i) therapies matched the trends of the corresponding clinical trials, with ARIES-1 week 12 having the highest treatment effect (published ARIES-1 + 51 m, 95% CI 27–76 m6; median virtual ARIES-1 trial +44 m, 95% CI 25–61 m) followed by PHIRST week 16 (published PHIRST + 33 m, 95% CI 15–50 m5; median virtual PHIRST trial +29 m, 95% CI 14–46 m). Finally, the sampled virtual trials for the combination therapies matched the FREEDOM-C and FREEDOM-C2 results well, with the virtual trial treatment effects being approximately +6.3 m and +8.0 m, respectively, while the true clinical trials both showed an improvement of only +10 m. Overall, this showed that the simulated trials can capture appropriate trends over time, across the three monotherapy treatments, and for treprostinil added to background therapy.
An advantage of virtual clinical trials is the ability to perform repeated simulated trials and use the proportion of resulting statistically significant treatment effects to predict the actual trial success. Of the five time point / monotherapies used for calibration, all but one (FREEDOM-M week 4) resulted in significant treatment effects in clinical trials. Among our sampled trials, FREEDOM-M week 4 had a low probability of achieving a significant treatment effect (40%), whereas the remaining time point / monotherapies had probabilities greater than 79% (Fig. 5d). Conversely, the two fitted background therapy trials FREEDOM-C and FREEDOM-C2 were predicted to have low probabilities of showing significance (31% for both). In reality these trials both failed to show clinical significance in 6MWD at the week 16 time point. Overall, this demonstrated that the predicted success of virtual trials aligned well with the actual clinical trial results.
Virtual clinical trials of FREEDOM-EV
The FREEDOM-EV study was conducted after the fitted clinical trials described above; therefore, we used this trial as a test case for our virtual trial workflow. As shown in Table 3, FREEDOM-EV differed from FREEDOM-C and -C2 in several important ways: patients received treprostinil three times daily, only received one background therapy, were more frequently functional class I/II instead of the more severe class III/IV, and were observed for a longer follow-up duration as part of an event-driven trial.
The virtual trial results for FREEDOM-EV at six time points matched the clinical data well (Fig. 6). The virtual trial-computed probabilities of clinical significance were 6%, 43%, 66%, 99%, 99%, and close to 100% at weeks 4, 8, 12, 24, 36, and 48, respectively. The actual FREEDOM-EV trial showed clinical significance at weeks 36 and 48 but not at weeks 4, 8, 12, and 242. Therefore, our model captured the correct trend but predicted success earlier than was observed. Although the medians for the QSP model matched the data reasonably well, the virtual population had less noise at later time points than the actual trial, leading to an overestimated probability of significance. We investigated differences between the FREEDOM-EV study and previous oral treprostinil trials to assess why our simulation predicted higher success probabilities, focusing on the relative abundance of different patient subgroups. We evaluated treatment effects in subgroups based on functional class and background therapy (Supplementary Fig. 2). In the clinical trials, no functional class subgroup analyses demonstrated significant treatment effects; consistent with this, the simulated trials had low proportions of significant treatment effects (10–60%) with the exception of the functional class I/II subgroup in FREEDOM-EV. Similarly, for background therapy-based subgroups, low proportions of simulated trial significant treatment effects were compatible with the lack of observed subgroup significance, with the exception of the PDE5i background therapy subgroup in FREEDOM-EV. Taken together, these subgroup analyses suggest that the higher treatment effects in the FREEDOM-EV trial compared to previous oral treprostinil trials may be due in part to contributions from both the high proportion of functional class I/II patients and PDE5i background therapy as well as a lack of increasing variability over time. Note that in all cases, the real clinical trial result fell within the range of simulated treatment effects.
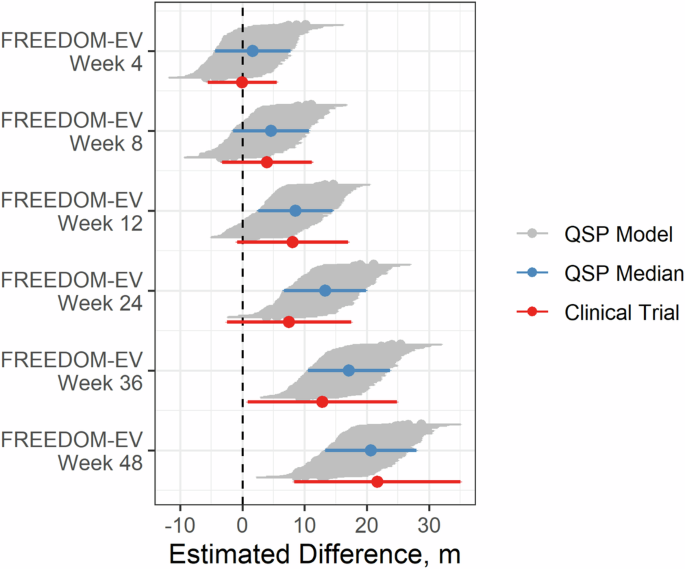
6MWD treatment effects for 100 sampled virtual trials corresponding to the combination therapy trial FREEDOM-EV. Treatment effects are estimated with mixed model for repeated measures (MMRM). Gray regions correspond to 95% CI across 100 trials, with the median trial in blue. Clinical trial data is shown in red.
Characteristics of therapeutic response
In addition to subgroup analysis, QSP models can provide a source of data for identifying predictive biomarkers. As a demonstration of this process for our model, we assessed the role of the seven population variables in the combination therapy trials in predicting the treatment-induced change in PVR normalized by the placebo change in PVR (ΔΔPVR). In all cases, the ET-1 production rate was negatively correlated with ΔΔPVR when adding treprostinil to background therapy, indicating that patients with higher ET-1 production rates had a larger decrease in PVR during treprostinil treatment (Fig. 7a). PGI2 production was positively correlated with the treprostinil ΔΔPVR response, indicating that virtual patients with high PGI2 production did not have large declines in PVR as a result of adding treprostinil. Therefore, the patients deriving the greatest benefit from treprostinil regardless of background therapy are patients with higher ET-1 production rate and lower PGI2 production.
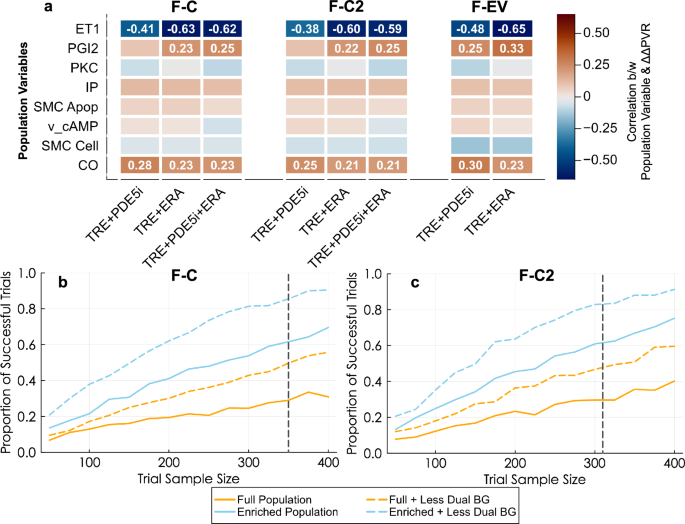
a Pearson correlation coefficients between population variables and change in PVR relative to placebo across the 4909 patients in the FREEDOM-C, -C2, and -EV plausible populations are shown, with orange indicating positive correlation and blue indicating negative correlation. Correlation values are shown for those whose absolute values exceed 0.2. Population enrichment strategies in which virtual patients have been filtered according to ET-1 and PGI2 production rates (enriched population), with removal of dual (ERA and PDE5i) background therapy in resimulations of the FREEDOM-C (b) and -C2 (c) trials.
To incorporate these factors into trial design, we resampled 1000 virtual FREEDOM-C and FREEDOM-C2 trials using an enriched population comprising only virtual patients with higher-than-median ET-1 production and lower-than-median PGI2 production. We compared the trial outcomes across a variety of population sizes while also including the effect of reducing the proportion of dual background therapy patients to 5% in each trial. As expected, larger trial size led to a higher proportion of successful virtual trials (defined as having a significant treatment effect) for all populations. Both the enriched population and the original full population with reduced dual background therapy had higher rates of successful trials at the same trial sample size (Fig. 7b, c). Enriching the population and reducing dual background therapy simultaneously led to the highest trial success rates. For the same trial size as the real trials (n = 350 and 310), the proportion of successful trials rises from 23% and 22% for the full population to 81% and 75% for the enriched population with less dual background therapy for FREEDOM-C and FREEDOM-C2, respectively.
Discussion
In this study, we presented virtual clinical trials based on a mathematical model of PAH disease biology and the response to treprostinil, PDE5 inhibitors, and ERAs. The QSP framework supports integration of knowledge from in vitro, in vivo, and clinical data, and thus facilitates mechanistic understanding of drug action in a virtual population. We configured the virtual trials according to four categories of inputs: number of patients, proportion of WHO functional class I/II vs. III/IV, proportion of patients on PDE5i and/or ERA background therapy, and treprostinil dosing characteristics. To calibrate and test the workflow, we used five published trials as training datasets, followed by prediction of the results of the FREEDOM-EV oral treprostinil clinical trial. The virtual population displayed a range of 6MWD variation comparable to that observed in clinical trials. The calibrated model was accurate in predicting that the changes to trial design between the FREEDOM-C/C2 clinical trials and the FREEDOM-EV clinical trial would greatly increase the probability of observing a statistically significant improvement for treprostinil given on top of background therapies and was also able to accurately estimate the average improvement in FREEDOM-EV that would be observed at each time point.
Previous uses of mechanistic models for PAH have often been limited to specific aspects of the disease such as target identification in the NO pathway18, arterial remodeling due to disease progression19, and right ventricular failure20. To our knowledge, this is the first published application of the virtual clinical trial approach to PAH. Virtual trials have previously been used in other disease applications to assist with treatment development by predicting background therapy effects in hyperlipidemia21, treatment timing effects for COVID-1922, and to improve insulin delivery timing for insulin pumps in type 1 diabetes23.
The goal of the virtual trial workflow will ultimately be to assist with design of clinical trials. Beyond validating with existing trial data to assess the workflow’s ability to extrapolate to new populations, we also presented an approach for identifying trial configurations with high likelihood of success. This can include properties discussed above such as trial size and dosing regimen, but also biomarkers. We demonstrated the ability of our QSP model to identify biomarkers which can raise the probability of trial success. These specific biomarkers are not clinically actionable since plasma ET-1 may not be an accurate predictor of the local concentration in the pulmonary vasculature, and PGI2 degrades rapidly. However, as the scope of the biology represented in the model continues to expand to include measures such as N-terminal prohormone of brain natriuretic peptide (NT-proBNP) and mutations in PAH susceptibility genes such as BMPR2, the approach described here will use these clinically relevant biomarkers for trial design.
Aside from PAH biomarkers, the virtual trial workflow will also be used to evaluate other subpopulations within PAH. While we focused on two WHO functional class-based subpopulations in the present study, our virtual trial framework will allow us to easily switch from functional class to other covariates of interest. For example, PAH comprises several disease etiologies, with connective tissue disease (CTD)-related cases generally having poorer outcomes24. Risk scores such as the REVEAL 2.0 risk stratification tool25 could also be taken into account, separating trial subpopulations according to low, intermediate, and high risks. Larger clinical datasets will allow us to train a greater number of subpopulations, potentially permitting subpopulations based on two or more covariates, e.g. six subgroups based on two etiologies and three risk statuses.
A challenge in developing virtual populations based on mathematical models is choosing the level of detail to include in the model. While complex models can make predictions based on large amounts of data gathered at multiple spatiotemporal scales, simulation of virtual populations can be computationally expensive. Nonetheless, several limitations of our current PAH disease model will be addressed, pertaining to the network of biochemical reactions, the representation of spatial variability, and oral treprostinil pharmacokinetics. Here we have focused on a biochemical reaction network of pathways directly relevant to our purpose of assessing the effects of the three main classes of PAH therapies on SMC contraction and proliferation. A wide range of pathways beyond those in our model play important roles in PAH, not just in SMCs but in endothelial cells, fibroblasts, and immune cells also. Thus we are currently expanding the model while ensuring that the model can be qualified with available data and support drug development decision-making26,27. Expanded biochemical reaction networks currently in development include transforming growth factor beta (TGF-β), bone morphogenetic protein (BMP), and a wider array of ion channels such as Kv1.5 and TASK-1.
Another limitation of the current version is the lack of spatial heterogeneity in the pulmonary arterial tree. In the present study, we treated the pulmonary circulation as a single compartment. However, PAH progresses from distal remodeling to stiffening of proximal arteries and finally to right heart dysfunction. We are currently extending the level of detail of our pulmonary artery hemodynamics model to account for a branching network of proximal and distal vessels. We will also incorporate heart pressures and volumes, which will enable simulation of strain-induced N-terminal pro-B-type natriuretic peptide (NT-proBNP) production in the heart. In addition to allowing our model to reproduce spatial patterns in perfusion28,29, the detailed hemodynamic model will allow for varying proximal-to-distal molecular characteristics, such as altered levels of IP and EP2 receptors15.
A final limitation in the model is oral treprostinil pharmacokinetics. Since a limited number of patients have available PK data, we were unable to simulate patient-specific exposures. Therefore, in our current virtual trials, high treprostinil doses always result in high plasma concentrations. In reality, varying rates of absorption and metabolism are expected to affect exposures. This limitation can potentially be overcome by incorporating other modeling approaches such as physiologically-based pharmacokinetics (PBPK) and also by collecting pharmacogenomics data on variants in genes such as CYP2C8 that affect drug metabolism30.
In addition to addressing the limitations above, next steps will include extending the virtual population to include multivariate outcomes instead of the current univariate 6MWD outcome. The addition of a model of cardiac function will enable incorporation of NT-proBNP, a marker of right heart function that is commonly collected in PAH trials, as well as echocardiographic and MRI-based measurements. The expanded model will be applied to evaluate new drug dose regimens, such as ones that combine parenteral and oral routes of administration12, as well as treatments in testing for PAH such as ralinepag and sotatercept.
In summary, we developed a quantitative systems pharmacology model of PAH pathophysiology and pharmacology and demonstrated its utility for clinical trial prediction and optimization. After calibrating the model to clinical trials for three PAH therapies given both individually and in combination, we successfully predicted the increased clinical effectiveness that was observed in the FREEDOM-EV trial for oral treprostinil as a combination therapy over what was observed in previous trials due to changes in the clinical trial design. Through examination of virtual population and simulated trial characteristics, we also identified biomarkers consistent with higher trial success. We believe that further development of our QSP model will result in even greater ability to contribute to successful clinical trial design.
Methods
Using a mathematical model of therapeutic pathways in PAH tuned to match the dynamics of human disease progression, we created virtual populations spanning a wide range of hemodynamic and exercise capacity levels. We separated available clinical trial data into training and test datasets to test the capability of our virtual population workflow to predict trial outcomes.
Model description
The model comprises key pathways regulating vasoconstriction and arterial remodeling, including the therapeutic targets PGI2, nitric oxide, and endothelin-1 (Fig. 1). PGI2, nitric oxide, and endothelin-1 are produced by endothelial cells and induce cyclic AMP (cAMP) production, cGMP production, and calcium release, respectively, in smooth muscle cells. Therapeutic agents in these vasomediator pathways are PGI2 analogs such as treprostinil, PDE5 inhibitors such as tadalafil, and ERAs such as ambrisentan.
The vasodilators and vasoconstrictors control the contractility of pulmonary arterial smooth muscle through a model of the crossbridge cycle and proliferation of pulmonary arterial smooth muscle cells through a logistic growth model. The contractility and proliferation of smooth muscle cells affect the vascular resistance due to narrowing of blood vessels. A more detailed description of the model, along with equations and parameter values, is given in the Supplementary Material.
6MWD is a less invasive measurement than PVR and is a common endpoint measure in PAH clinical trials; therefore, we linked our multiscale model of PVR to 6MWD through a linear regression model (Supplementary Fig. 1). The model was derived using baseline individual patient PVR and 6MWD values from the FREEDOM-EV clinical trial2,4. As seen in Supplementary Fig. 1, FREEDOM-EV patient 6MWD is significantly negatively correlated with PVR (Pearson’s correlation coefficient = −0.38, p = 0.0005) leading to a significant linear relationship. However, the measurement of 6MWD can be highly variable and affected by factors other than disease severity31,32. This can be seen in the large variation observed in the patient data compared to the regression line. To account for inherent variability in 6MWD, we added to the plausible population a random term sampled from a normal distribution with mean of zero and standard deviation of 30 meters based on the magnitude of intra-subject variability observed during repeated measurements of 6MWD in healthy subjects33. We assume that this variability is the same between healthy subjects and PAH patients. We also applied a placebo response term to account for improvement in 6MWD after enrolling in a clinical trial. This was an exponential equation with initial magnitude 20 meters and time constant of 17 weeks, tuned to match the average behavior of the FREEDOM-M clinical trial primary analysis population control arm3.
Translation of in vitro parameters to in vivo
Parameters governing smooth muscle contraction and cell proliferation were adapted from values estimated with in vitro data by adjusting the values to match clinical data. The rate of change of SMC number, given by the equation below, included effects of cAMP, cGMP, and calcium (Ca2+). The baseline proliferation rate constant kp and the apoptosis rate constant kapopt were assigned different values between in vitro and in vivo.
The PVR was controlled by the force generated by SMCs, FSMC, and by the number of SMCs. The ɑforce and ɑprolif parameters controlled the relative contributions of SMC force and proliferation and were tuned using acute and long-term hemodynamics data.
To use our in vitro model of SMC contraction and proliferation in simulations of PAH patients, we optimized several parameters to match model output with preclinical and clinical data. We first tuned the proliferation rate constant kp and the range of values for the apoptosis rate constant kapopt in the virtual population. The value for kp was set to (4.58times {10}^{-9},/sec); this provides a doubling of the SMC number in approximately 1 year. We then selected a range of kapopt values such that the SMC number across the population increases 10-fold over a time period spanning 1 to 10 years. This range was based on typical transplant-free survival times in PAH34, assuming that transplant or death occurs when arterial remodeling reaches an extreme level.
We also tuned the values of two scaling factors, αforce and αprolif, which control the influence of SMC contractile force and cell number, respectively, on the radius of the artery. This was based on short-term PVR data from PAH patients treated with vasodilators with the assumption that changes in PVR over the experimental time scales will be due entirely to changes in SMC contraction rather than remodeling (Table 1).
Virtual population generation
Plausible population simulation
We generated 5000 parameter sets by sampling random values for the following parameters: PGI2 production rate, endothelin 1 (ET-1) production rate, endothelial protein kinase C (PKC) activity, prostaglandin I2 receptor (IP) expression, SMC apoptosis rate, maximum inhibitory effect of cAMP on SMC proliferation rate, initial SMC cell number, and time since diagnosis. These parameters were chosen due to their suspected clinical importance: PGI2, ET1, PKC, IP receptors, and cAMP are key species in the three major therapeutic pathways for PAH; SMC proliferation/apoptosis are believed to be important processes in PAH progression; and time since diagnosis can correspond to disease severity. The distributions for these patient-specific parameters are listed in Table 2. We simulated seven conditions for each of these 5000 parameter sets: placebo, 12 weeks of oral treprostinil (FREEDOM-M), 16 weeks of an oral PDE5i (PHIRST), 12 weeks of an oral ERA (ARIES-1), 16 weeks of oral treprostinil in combination with a PDE5i (FREEDOM-C/C2), 16 weeks of oral treprostinil in combination with an ERA (FREEDOM-C/C2), and 16 weeks of oral treprostinil in combination with both a PDE5i and an ERA (FREEDOM-C/C2). We removed any parameter set that gave unrealistic 6MWD values outside of 100–600 m. We refer to the resulting set of parameters as the plausible population (step 1 in Fig. 2).
Prevalence weighting
Although all patients within the plausible population are considered biologically possible, not all are equally likely to become a virtual patient. We used prevalence weighting to determine the likelihood of each plausible patient appearing in a clinical trial.
Prevalence weights were calculated using a genetic algorithm to minimize the difference between predicted and actual clinical trial outcomes, as represented by the sum of squared differences between the virtual population 6MWD distributions and those of the actual clinical trials (step 2 in Fig. 2). The trials used for this optimization were the FREEDOM-M3, PHIRST5, ARIES6, FREEDOM-C16, and FREEDOM-C217. A single set of prevalence weights was optimized to match the 6MWD results from all of these trials simultaneously. The resulting prevalence weight for each virtual patient represents the frequency with which that type of patient exists in the PAH population. These weights are then subsequently used to sample for virtual trials.
Importantly, the prevalence weighting for the functional class (FC) I/II and FC III/IV populations are optimized independently. The overall response for the trial is then calculated using the fraction of patients which are FC I/II and FC III/IV. This allows for differences in the patient disease severity between trials to be partially accounted for by matching the frequency of these subpopulations to those of the clinical trials.
Virtual trials
To predict clinical trials using the plausible population, virtual patients are sampled randomly from the set of 5000 plausible patients with their probability of inclusion in the virtual trial equal to their prevalence weight. For each trial, the number of virtual patients sampled is equal to the number of patients enrolled in the trial. As in an actual clinical trial, the patients chosen for inclusion in the virtual trial can affect the outcome. To facilitate the comparison between the virtual trial predictions and published clinical results, the sampling is repeated 100 times for each trial. In this approach, model predictions are considered consistent with the clinical results if the published clinical trial result lies within the range predicted by these repeated virtual trials.
Virtual trials are configured with six inputs: number of patients in the trial, trial duration, fraction of patients with functional class I/II vs. III/IV, fraction of patients on PDE5i, ERA, or PDE5i+ERA background therapy, time since diagnosis, and dose titration curves (Table 3). These inputs can be divided into 3 categories: fixed trial-level, sampled trial-level, and sampled patient-level.
Fixed trial-level inputs
The number of patients, trial duration, and fraction of patients on various background therapies are selected prior to initiating a virtual trial. The fraction of background therapies (PDE5i, ERA, or PDE5i + ERA) controls the proportions used to randomly assign each sampled virtual patient to the various background therapies.
Sampled trial-level inputs
For inputs generated during the calibration of weights (here, functional class), the sampling for a new trial is performed by subdividing the total number of patients into cohorts with sizes proportional to the input fractions. These smaller cohorts are then sampled with the appropriate weight vector, e.g. in a 100-patient 25% FC I/II trial, 25 patients will be sampled using the FC I/II weights and 75 will be sampled with the FC III/IV weights.
Sampled patient-level inputs
Time since diagnosis and dose titration curves were both selected randomly upon initiation of a trial. Profiles were randomly assigned to patients, but at the trial level several parameters controlling the distributions were specified.
For time since diagnosis, we sampled diagnosis-to-trial initiation time periods from a gamma distribution fitted to each trial (Table 2).
For dose titration curves, we fitted a nonlinear mixed effects model using the nlmixr2 package in R35. We used a saturating exponential curve:
where ({{dose}}_{0}) is treated as a covariate and (Delta {dose}) and ({t}_{d}) are parameters with fixed and random effects. After fitting the model, random dose titration curves were assigned to each virtual patient by sampling from a binomial distribution for dose0 and normal distributions for the (Delta {dose}) and ({t}_{d}) random effects, ({eta }_{Delta {dose},i}) and ({eta }_{{t}_{d},i}) (variances of these two random effects are given in Table 4). Patient-specific values of (Delta {dose}) and ({t}_{d}) were calculated assuming a log-normal distribution, e.g. (triangle {dos}{e}_{i}={theta }_{triangle {dose}}exp ({eta }_{triangle {dose},i})).The patient-specific value for dose0 is sampled from a binomial distribution with scaling constant ({theta }_{{dose}0}) and probability ({p}_{{dose}0}).
Statistical analysis
Virtual trial 6MWD treatment effects were evaluated using the statistical tests used in the original clinical trial publications. For FREEDOM-M, -C, and -C2, the Hodges–Lehmann estimate was used. For the FREEDOM-EV trial, a mixed model for repeated measures (MMRM) was used, with change from baseline 6MWD as the dependent variable, treatment, week, treatment-by-week interaction, and background therapy as the fixed effects, and baseline 6MWD as the covariate.
Responses