Simultaneous tACS-fMRI reveals state- and frequency-specific modulation of hippocampal-cortical functional connectivity
Introduction
There is a strong scientific interest to experimentally modulate hippocampal activity to investigate the contribution of hippocampus to cognition and mental health1,2,3. The location of the hippocampus deep within the brain makes direct neural stimulation only possible through invasive procedures in animal research or human brain surgery patients. However, non-invasive brain stimulation may be able to indirectly modulate hippocampal activity by spreading induced activity changes via hippocampal-cortical network connectivity3,4,5. Transcranial electrical stimulation (tES) is a popular tool for human non-invasive brain stimulation research and clinical intervention, owed to its ease of use, non-invasive character and safety for human application6,7,8.
Particularly appealing is the application of oscillatory stimulation using transcranial alternating current stimulation (tACS) to modulate specific frequencies of neural activity7,8. Oscillatory activity in the theta range (3–8 Hz) is a prominent feature of hippocampal function in human cognition9,10,11,12 and resting states13. Theta oscillations have been proposed to temporally organize multiple items within a context in an ordered manner12,14,15. Ample research in rodents and humans has shown increased hippocampal theta power during spatial navigation16, associative encoding and memory formation9,17, but have also been observed in other cognitive domains, such as temporal cognition18,19 and speech planning20, suggesting that theta oscillations support a general associative function to create cognitive maps of experiences21,22. Further, theta oscillations facilitate the synchronization of neural activity across different brain areas to support neural communication and information processing. For example, studies have found increased theta oscillatory synchronization between hippocampus and cortical areas, including prefrontal and parietal cortex, during decision-making23, working memory tasks24,25, and memory encoding and retrieval26,27. Thus, hippocampal theta oscillations play a central role in many different cognitive behaviours.
Previous simultaneous tACS-functional magnetic resonance imaging (fMRI) studies showed stimulation-related modulations of neural activity in widespread cortical and subcortical areas28,29,30, which supports the potential of tACS to modulate distal brain areas through network-based connectivity. Further, a recent study in nonhuman primates showed that scalp tACS administered at various frequencies, including theta, affected hippocampal spike timing during resting states31. However, simultaneous tACS-fMRI studies in humans have failed to show hippocampal-cortical connectivity modulation for any of the utilized stimulation frequencies. In addition, skepticism has been raised about the efficacy of tES to innervate neural tissue with commonly used stimulation parameters32,33, casting further doubt on the potential of tACS to modulate human hippocampal function.
Here, we analysed the frequency-, state- and topologically-specific features of tACS while simultaneously measuring brain activity of healthy human participants with fMRI. The data were originally collected in the context of a visual attention research line, but the experimental design allowed rigorous testing of tACS-based hippocampal modulation. TACS was administered in blocks of different stimulation frequencies of 5 (theta), 10 (alpha), 20 (beta) and 40 Hz (gamma), or a no stimulation control, while participants either completed a visual attentional orienting task or were in a resting state. Stimulation was delivered over scalp location P4, as defined by the EEG 10–20 positioning system. This area is strongly connected to the hippocampus34,35 and has been found to modulate hippocampal-cortical activity when stimulated with repetitive transcranial magnetic stimulation4,36. To achieve focal electric stimulation, a concentric ring setup with a central electrode positioned within a larger circular electrode was used37,38,39. Computational simulation of the electric field distribution confirmed stimulation focality (see also refs. 37,39). We hypothesized increased hippocampal-cortical connectivity during 5 Hz stimulation compared to no stimulation and to other frequencies. Further, we hypothesized this effect during resting-states, which have been reliably characterized by strong hippocampal-cortical connectivity35,40, but not during the attention task, for which no hippocampal-cortical connectivity has been previously reported. Finally, we hypothesized that this effect would be lateralized to the hemisphere of stimulation, in support of a topologically-specific tACS effect.
Methods
Participants
Eighteen healthy participants were recruited from a student sample of Maastricht University. Self-reported demographics included sex (12/6 female/male participants) and age (mean (SD) = 23.33 (3.85), age range = 18–31). All participants were screened twice, once during the admission procedure and once at the day of participation, to assess eligibility for non-invasive brain stimulation (NIBS) and magnetic resonance imaging. All participants gave their written consent before participating. The Ethical Review Committee of Psychology and Neuroscience (ERCPN) of the Faculty of Psychology and Neuroscience of Maastricht University approved the study. Participation was compensated with course credit or gift vouchers. This study was not preregistered.
Procedures
During MR scanning, participants completed blocks of trials of an endogenous spatial orienting attention task41,42,43,44 and resting states in alternating fashion. The attention task was designed in Presentation (www.neurobs.com). Participants were instructed to shift their covert attention while keeping their eyes fixated on a central fixation spot, which was presented throughout the whole run on a grey background (RGB: 110,110,110; Fig. 1). During a task block, a trial started with the presentation at the centre of the screen of a double arrowheads cue stimulus that pointed either to the left (“<< • <<”) or right (“>> • >>”) of the screen for a duration of 100 ms. The one-sided arrows predicted that the grating would appear on the left or right side of the screen with an 80% validity. After a delay of 1000 ms, a target stimulus that consisted of an oriented grating appeared on the left or right side of the fixation point for 100 ms and participants had to indicate if the grating tilted clockwise (at an angle of 40 or 50 degrees) or counter-clockwise (130 or 140 degrees). Participants were instructed to give their response as quickly as possible by pressing one of two buttons, indicating either a clockwise or counter-clockwise tilt of the target. Target stimuli were Gabor patches (spatial frequency = 1.5 cycle per degree, envelope standard deviation = 0.75°, Michelson contrast = 50%) presented at appr. 7-degree eccentricity. Trials were presented in short blocks of 30 s and each lasted 3 s (total of 10 trials per block). The task blocks were interspersed with 30 s resting state blocks in which participants only saw the fixation spot and were instructed to keep their eyes open and fixated on the spot. Task and rest blocks were alternated with a total of four blocks per stimulation condition. For each functional run, participants started either with the task or the rest block to counterbalance the order of task and run. Each participant completed two runs with task-rest order and two runs with the reversed rest-task order, with order across runs counterbalanced (6 unique combinations of task-rest (A) and rest-task orders (B) across four runs: ABAB, ABBA, etc.; each combination was repeated three times across participants).

A During a functional MR run, tACS stimulation was delivered in 140 s blocks, which included two task and two resting-state blocks plus 10 s ramp on and 10 seconds ramp off. B During a task block, participants completed an endogenous spatial orienting task.
Transcranial alternating current stimulation (tACS)
Transcranial electric stimulation was delivered using a NeuroConn DC-STIMULATOR TES device that was placed outside the MR magnet room. A concentric rubber electrode setup was used to administer tACS37,44,45, consisting of a smaller circular electrode (3 cm diameter) placed in the centre of a larger ring-shaped electrode (11 cm outer diameter, 9 cm inner diameter). Electrodes were attached to the scalp using an adhesive conductance paste (Ten20, Weaver and Company, Aurora, CO, USA) to achieve an impedance below 10 kΩ. The scalp location for electrode attachment was determined using the 10–20 EEG electrode positioning system, with the central electrode positioned over P4, a standardized scalp location right above the posterior parietal lobe. Electric field (EF) simulation for the concentric electrode placement on a realistic head model46 showed a focal EF distribution around the central electrode (see Fig. 2). An EEG cap was used to identify location P4, which was subsequently marked using a cosmetic pencil. The adhesive quality of the Ten20 paste eliminated the need for headgear to fixate the electrodes to the scalp. The larger ring electrode was then placed around the centre electrode such that the conductive paste of both electrodes did not contact each other.
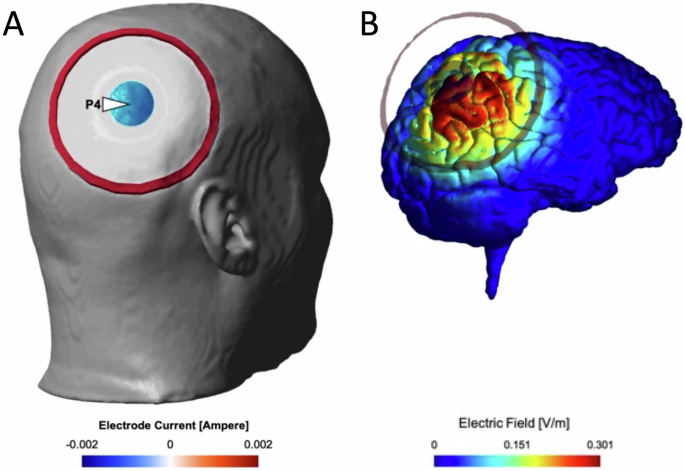
Inner and outer electrodes are shown superimposed on a head reconstruction from a participant’s T1 MR image (A) and on a simulated electric field shown on a cortical rendering (B).
TACS was applied within five pseudorandomized stimulation blocks, each delivering stimulation at a different frequency (no stimulation, 5 (theta), 10 (alpha), 20 (beta) and 40 Hz (gamma)) for a duration of 120 s (Fig. 1). A rest period of 10 s preceded the first block of each fMRI functional measurement. The stimulation within every frequency band was delivered at the same current strength of 2 mA (peak-to-peak from negative to positive polarity). Two participants expressed discomfort during the stimulation, which resulted in a reduction of the current strength to 1.2 mA in both cases.
Except for the no stimulation condition, all stimulation conditions began with a linear 10 s ramp-up phase until full current strength was reached. After 120 s of stimulation at full current strength a 10 s ramp-down phase terminated the stimulation, followed by a 10 s resting break without any stimulation until the start of the next stimulation condition. The no stimulation condition did not include any electric stimulation during ramp-up or down phases.
Concurrent tACS-fMRI
To minimize artefacts of the functional imaging caused by concurrent tACS, an MR compatible system (NeuroConn GmbH, Ilmenau, Germany) was used to connect the electrodes inside the scanner room with the NeuroConn stimulator device in the console room. This system consisted of two radiofrequency (RF) filter boxes and an MR compatible cable. The purpose of this system was to allow the connection between electrodes (attached to the participant’s scalp inside the scanner bore) and stimulator (placed outside of the MR shielded room) while simultaneously filtering out RF noise from outside the scanner room. One of the RF filter boxes was placed next to the MR head coil and was connected to the two electrodes. The wire connecting the RF filter box and the electrodes included two resistors that prevented the induction of voltages by the RF pulses emitted by the scanner. The second RF filter box was placed outside the scanner room and received inputs from the DC stimulator device. Finally, the two RF filter boxes were connected via the MR compatible cable through the scanner bore, closing the loop between the stimulation device and the rubber electrodes.
To synchronize the stimulation protocol with functional scanning, we used the Data Streamer software47. This freely available software reads stimulation protocols with millisecond resolution timing specification and transmits the signals to the relevant output device using a digital-to-analogue converter (National Instruments, Austin, Texas, United States). To ensure that the tACS conditions were delivered to the participants in pseudorandomized order and at the desired time, stimulation protocols were generated using MATLAB prior to the experiment. Each protocol included a time series that described the exact timing of on/off ramping, duration and stimulation frequency for each stimulation condition and their respective orders for each of the four functional runs.
Participants underwent two 30 s task blocks and two 30 s rest blocks during each 120 s stimulation period. Within every functional run, a pseudorandomized order of all five tACS conditions was applied to the participants, resulting in four repetitions of every condition per participant by the end of the session.
MRI acquisition
Functional and anatomical measurements were acquired on a 3T Magnetom Prisma Fit scanner (Siemens, Erlangen, Germany). During four runs, each lasting 12.6 min, functional data was collected using an echo-planar imaging (EPI) sequence (TR/TE = 1000/29 msec, voxel size = 3 × 3 × 3.45 mm, FOV = 175 × 135 mm, number of volumes = 761, number of slices = 36). After two initial functional runs, an anatomical reference image was acquired using a T1-weighted MP-RAGE sequence (TR/TE = 2250/2.21 msec, voxel size = 1 mm3 isometric, FOV = 256 × 256 mm, number of slices = 192). The anatomical scan lasted approximately 5 minutes and was followed by the last two functional runs.
MR image pre-processing
Prior to the analysis, functional and anatomical data was pre-processed using a standard pre-processing pipeline of the CONN toolbox v.21.a48,49, which borrows image preprocessing and normalization routines from SPM12. The pipeline included the realignment of all functional images to the first volume of the first functional run based on rigid body transformation, followed by the estimation of subject motion and the correction for inter-slice acquisition differences. Functional outliers were identified as part of the pre-processing steps during the original experiment and were automatically excluded from further analysis (image scrubbing). Subsequently, functional and structural data were segmented into grey matter, white matter, and cerebrospinal fluid (CSF) maps and were normalized to MNI space. The functional data were then spatially smoothed using a Gaussian kernel of 6 mm FWHM. Following spatial preprocessing, temporal preprocessing was performed in accordance with previous suggestions for functional connectivity analyses48,50,51. Subject motion, physiological noise such as cardiac signal and respiration, and BOLD effects in white matter and CSF can impose spurious correlations on the functional data, which may lead to increased number false positive results. To reduce the effect of these temporal confounders, these factors were regressed from the BOLD time series. No temporal smoothing was applied.
Functional connectivity analyses
The effect of tACS on functional connectivity was initially tested using seed-based correlation (SBC) analyses. This procedure computes the timepoint-by-timepoint Pearson correlation between the average (preprocessed) BOLD time course of a predetermined region of interest (ROI), also called the seed, and the time course of all remaining voxels of the volume (seed-to-voxel SBC).
For most analyses, we used the right hippocampus (selected from the Harvard-Oxford brain atlas) as the regional seed, unless otherwise stated (see below). The choice for the right hippocampus was based on previous studies using transcranial magnetic stimulation in combination with the network-based approach, which found functional connectivity modulations lateralized to the hemisphere of stimulation4,52.
Before entering the analysis, functional runs were normalized and concatenated. In all statistical tests, data distribution was assumed to be normal but this was not formally tested. The statistical analysis comprised two levels. At the first level, correlation maps for each seed and participant were computed separately for the five tACS conditions and both task conditions using Pearson’s r correlation analyses. Correlation coefficients were subsequently normalized using Fisher’s r-to-z transformation, resulting in ten correlation coefficient maps per participant pertaining to five tACS conditions during rest and five tACS conditions during task blocks. At the second level, conditional contrasts were specified and tested at the subject-level. Statistical seed-based connectivity maps or paired comparison maps were thresholded for visualization using an uncorrected p-value of 0.001 and a subsequent cluster-level correction (FDR q = 0.05), unless otherwise stated.
Assessment of baseline resting-state dynamics
First, we assessed if the resting-state functional dynamics for the resting blocks during the no stimulation condition were comparable to previously well-described resting-state networks. Specifically, our 30 s resting-state blocks were shorter than the more commonly used continuous resting-state measurements of five minutes or more, which could have altered resting-state dynamics in our study. We conducted a spatial and a temporal/spectral analysis to assess similarity of our resting blocks to more conventional testing-state results. For the spatial analysis, we calculated seed-based functional connectivity for three well-described resting-state networks, including the default mode network (DMN), the salience network (SN) and the fronto-parietal network (FPN), using a typical seed region for each network (respectively the posterior cingulate cortex, anterior cingulate cortex and the left posterior parietal cortex) obtained from the Harvard-Oxford atlas.
For the temporal/spectral analysis, we investigated the reliability of low frequency fluctuations (<0.1 Hz), which are commonly found in resting-state studies53,54,55,56. We calculated the fractional amplitude of low frequency fluctuations (fALFF57) < 0.1 Hz for each voxel timeseries of each resting block during no stimulation, and then compared fALFF values between the odd- and even-numbered resting blocks. The statistical comparison map was thresholded at an uncorrected p-value of 0.001 and subsequently corrected at the cluster-level (FDR q = 0.05).
Hippocampal-cortical connectivity at resting baseline
To visualize resting baseline hippocampal-cortical connectivity, we conducted a right hippocampus seed-based analysis using only the no stimulation condition during resting state. This analysis was done to verify that the spatial distribution of hippocampal-cortical connectivity during the resting-states blocks was comparable to those of previous resting-state studies34,35,58.
Hippocampal connectivity as a function of tACS
For this analysis, we conducted “planned comparisons” in the sense of a priori defined comparisons to address theta-related hippocampal connectivity as a function of tACS, but we note that these comparisons were not part of the original goal of the experiment. We analysed tACS effects separately for resting and task blocks, rather than conducting a full factorial interaction effect crossing stimulation conditions and rest/task blocks. A full factorial design could lead to a significant interaction term driven by differences between rest and task blocks for non-theta stimulation conditions, which was not the focus of the current study. Further, examining interaction terms driven by one or more non-theta conditions would necessitate additional posthoc comparisons, placing a further statistical cost of (more explorative) multiple comparisons.
First, we conducted a right hippocampus seed-based analysis to test all stimulation conditions against no stimulation during rest (i.e., resting state [5 Hz > no stim, 10 Hz > no stim, 20 Hz > no stim, 40 Hz > no stim]). A second-level omnibus F-test statistical map of “any effect of tACS during rest” was initially thresholded (uncorrected p-value of 0.001 and cluster-level FDR-correction, q = 0.05) prior to visualization on a 3D surface rendering of the MNI template.
Posthoc comparisons of correlation values across tACS conditions were subsequently conducted in significant voxel clusters. Correlation values were averaged across voxels that were contained in the cluster. We then tested for each stimulation condition if correlation values were significantly different from the no stimulation condition. We subsequently tested if the correlation values of the theta stimulation condition were significantly different from that of the three other stimulation frequencies. Posthoc comparisons were corrected for multiple comparisons using the Bonferroni–Holm procedure.
A similar seed-based analysis was conducted separately for the tACS conditions during task performance. We also conducted a seed-based analysis with the left hippocampus as seed.
Localizing theta tACS connectivity changes in hippocampus
To assess the spatial distribution of the tACS-induced connectivity changes in right hippocampus, we conducted an additional seed-to-voxel connectivity analysis with the parietal lobe cluster that was obtained from the previous SBC analysis during rest. We note that the circularity of this analysis is mitigated by the aim to find those voxels in right hippocampus whose parietal connectivity changed most strongly (in a statistical sense) during theta tACS, compared to the no stimulation condition. As this analysis only targeted the right hippocampus, we visualized significant voxels by thresholding at an uncorrected p-value of 0.01.
Psychophysiological interaction analysis
To investigate if right hippocampal-seeded connectivity was differentially modulated by theta tACS (5 Hz vs. no stimulation) and cognitive state (resting state vs. task state), a generalized psycho-physiological interaction (gPPI) was conducted59. The analysis used the right hippocampal timeseries as “physiological variable”, the tACS (theta, no stimulation) and task conditions (task, rest) were used as a two-factorial “psychological variable”, and the timepoint-by-timepoint product of the hippocampal timeseries and orthogonalized conditions variable as the psychophysiological interaction term. Compared to the seed-based correlation analysis, the gPPI removes the “main effects” of hippocampal timeseries and tACS and task conditions before fitting the interaction term to the residuals, which provides a direct estimate of degree of hippocampal-cortical connectivity modulation by the interaction of tACS and task. The statistical map of the gPPI interaction term was statistically thresholded and corrected at the cluster-level before superimposing on an MNI anatomical template.
Connectivity between right hippocampus and resting-state networks
To investigate if tACS modulated hippocampal connectivity with well-defined resting-state networks, we calculated a region-to-region connectivity analysis between right hippocampus and the main nodes of the Default Mode Network, the Salience Network, the Fronto-parietal Network and the Visual Network. For this analysis, regional voxel timeseries for each tACS condition during rest blocks were averaged across voxels within the right hippocampus or each of the network regions (as obtained from the Harvard-Oxford atlas). Averaged timeseries were then correlated and correlation values were normalized using Fisher’s Z-scoring. For each resting-state network, we conducted three analyses. First, we assessed the connectivity strength between right hippocampus and each region within a network during no stimulation resting blocks. Second, for each significant connection (Bonferroni-Holm corrected for multiple comparisons), we calculated the statistical effect of the difference between the no stimulation and 5 Hz tACS conditions. Third, in an explorative analysis, we statistically tested the difference between the no stimulation and 5 Hz conditions for connections within and between resting-state networks (excluding right hippocampus). Explorative results were Bonferroni-Holm corrected for multiple comparisons.
Use of Bayes Factors for evidence quantification
For some comparisons we hypothesized no difference between conditions. To quantify evidence in favour of the null hypothesis of no difference, we calculated Bayes Factor (BF10)60,61 and followed the recommended62 categorizing of BF values as moderate evidence (<0.33) or anecdotal evidence in favour of no difference (0.33–1), or anecdotal evidence (1–3) or moderate evidence in favour of a difference (>3). For Bayesian t-tests, we used a Cauchy prior with a scale of 0.70761 (using the Bayes Factor toolbox for Matlab). For Bayesian repeated measures analysis, we used the default settings in JASP60 of Cauchy priors with a scale of 0.5 for main effects and 0.25 for interaction effects61.
Reporting summary
Further information on research design is available in the Nature Portfolio Reporting Summary linked to this article.
Results
Behavioural data
The behavioural data was assumed to be normally distributed but this was not formally tested. A repeated measures ANOVA revealed a significant main effect of cue validity (F(1,16) = 34.80, p < 0.001, ({eta }_{p}^{2}) = 0.69, 95% CI = [0.45 0.86]), with faster response times for validly cued targets compared to invalidly cued targets (Fig. 3), thereby replicating the well-known attentional effect of cue validity on response times42,43. Participants also showed faster responses for targets presented in the right visual field, compared to the left visual field (F(1,16) = 5.97, p = 0.027, ({eta }_{p}^{2}) = 0.27, 95% CI = [0.02 0.62]). However, the effect of tACS frequency on response times was not significant (F(4,64) = 0.68, p = 0.61, ({eta }_{p}^{2}) = 0.04, 95% CI = [0.01 0.23]). The Bayes Factor (BF10) for this null finding of tACS was BF10 = 0.07, indicating strong evidence in favour of the null hypothesis of no effect. There were also no significant interaction terms with tACS frequency (tACS x Validity: F(4,64) = 1.97, p = 0.11, ({eta }_{p}^{2}) = 0.11, 95% CI = [0.04 0.31], BF10 = 0.49; tACS × Visual Field: F(4,64) = 0.64, p = 0.64, ({eta }_{p}^{2}) = 0.04, 95% CI = [0.01 0.22], BF10 = 0.09; tACS × Validity × Visual Field: F(4,64) = 0.32, p = 0.87, ({eta }_{p}^{2}) = 0.02, 95% CI = [0.01 0.19], BF10 = 0.10), with anecdotal to moderate evidence in favour of the hull hypothesis of no difference.

Distributions of response times (RT, in msec) for validly (dark grey) and invalidly (light grey) cued targets presented in the left (A) or right visual field (B). Sample size Ns = 18.
Hippocampal-cortical connectivity at resting baseline
Figure 4A shows the spatial distribution of brain areas significantly connected to the right hippocampus during the no stimulation resting-state blocks. Right hippocampal connectivity included bilateral medial temporal lobe areas, anterior and posterior cingulate cortices, precuneus, lateral inferior parietal areas, including angular gyrus and supramarginal gyrus, and lateral temporal cortex. These areas have been often reported to be part of the default mode network, of which the hippocampus is often reported as a network node34,35,63,64.

A The hippocampal seed region is shown as blue area in the left-upper inset, with the triangle marking the P4 area of stimulation. Positive (negative) seed-based correlations are shown in red-yellow (blue-pink) colour scale. B Three resting-state networks (Default-mode network, Salience Network and Fronto-parietal Network) as obtained from seed-based analysis in the no stimulation resting blocks. Seed region for each network is indicated in italics. AG angular gyrus, IPL inferior parietal lobule, PCC posterior cingulate cortex, vmPFC ventromedial prefrontal cortex. Sample sizes for all analyses Ns = 18.
Resting-state functional dynamics at no stimulation baseline
Next, we calculated functional connectivity for the no stimulation resting condition for three resting-state networks to assess how well connectivity from the resting blocks in our study reflected previously well-described resting-state networks. Figure 4B shows the thresholded statistical maps for the default-mode network, the salience network and the fronto-parietal network. The topological distribution of voxel clusters of each of the three networks appeared very similar to previous descriptions of these networks in studies that utilized a more conventional resting-state design, indicating that the functional resting-state dynamics of the relatively short resting blocks matched those of longer, continuous resting-state measurements.
We also tested fALFF <0.1 Hz between even- and odd-numbered resting blocks during the no stimulation condition. The statistical map of the even/odd block comparisons revealed no significant differences. Figure 5 shows the similar spectral distributions for the even- (black line) and odd-numbered resting blocks (grey line) for the posterior cingulate cortex, the right hippocampus and an 8 mm sphere at the P4 location of the central stimulation electrode (MNI coordinates x = 36, y = −74, z = 49; Fig. 5D). To numerically test the spectral similarity, we averaged spectral power in the low frequency range <0.1 Hz for the even- and for the odd-numbered blocks and calculated the Bayes factor for each region. All three Bayes factors were indicative of moderate evidence in favour of no difference (BF10 PCC = 0.24; right hippocampus = 0.23; P4 = 0.23).

Plots show averaged spectral power for even- (black line) and odd-numbered (grey line) resting blocks for three relevant regions (A–C; Ns = 18). Insets show scatter plots for spectral power of even- and odd-numbered blocks (grey line depicts the regression line between the two block types). D Location of the P4 spherical region-of-interest.
In summary, these results suggest that the short resting blocks reliably captured relevant spatial and temporal resting-state dynamics similar to previously well-described resting-state network dynamics.
Hippocampal connectivity as a function of tACS
Next, we analysed hippocampal-cortical connectivity changes as a function of tACS condition during resting-states. Specifically, we calculated an F-test of any difference between stimulation conditions and the no stimulation condition. Note that this analysis was not restricted to 5 Hz stimulation, such that significant voxels could result from connectivity changes after any of the stimulation conditions. We found one significant voxel cluster in the right inferior parietal lobule (IPL; FDR-corrected, cluster size = 65 mm3, MNI coordinates x,y,z = 48, −44,38; Fig. 6A, B), which included the posterior supramarginal gyrus (pSMG) and the angular gyrus (AG). Notably, the cluster was positioned in-between the central and surround concentric electrodes. More generally, this area has been consistently reported to be connected to hippocampus during resting state measurements34,35 (see also Fig. 4A), as well as during memory and mental simulation65. Figure 6C shows the average seed-based correlations for each stimulation condition during resting in the IPL cluster. Posthoc comparisons showed that hippocampal-cortical connectivity was significantly altered during each of the stimulation conditions, compared to the no stimulation condition (5 Hz: t(17) = 5.39, 95% CI = [−0.21 −0.09], p < 0.001; 10 Hz: t(17) = 2.70, 95% CI = [−0.12 −0.02], p = 0.015; 20 Hz: t(17) = 2.18, 95% CI = [−0.11 −0.00], p = 0.044; 40 Hz: t(17) = 2.77, 95% CI = [−0.15 −0.02], p = 0.013; Bonferroni–Holm corrected). Bayes factors confirmed the strongest evidence for tACS-induced connectivity change for 5 Hz (BF10 = 530.37), compared to the other stimulation conditions (BF10 10 Hz = 3.77; 20 Hz = 1.60; 40 Hz = 4.20). Further, 5 Hz stimulation resulted in a sign-reversal of the hippocampal-cortical connectivity strength from the no-stimulation condition (binomial sign test p = 0.048), while this was not observed for the other stimulation conditions (10 Hz: p = 0.88, 20 Hz: p = 0.99, 40 Hz: p = 0.88). Finally, the effect of 5 Hz stimulation was significantly stronger compared to the other three stimulation conditions (5 Hz > 10 Hz: t(17) = 3.25, 95% CI = [0.03 0.14], p < 0.005, BF10 = 9.90; 5 Hz > 20 Hz: t(17) = 3.51, 95% CI = [0.04 0.15], p < 0.005, BF10 = 16.0; 5 Hz > 40 Hz: t(17) = 2.46, 95% CI = [0.01 0.12], p = 0.025, BF10 = 2.51; Bonferroni–Holm corrected). These findings provided evidence for a frequency-specific tACS modulation of hippocampal-cortical connectivity during rest blocks.

A Right hippocampal connectivity modulation by tACS projected on a cortical surface together with electrode placement at P4. B tACS modulation of hippocampal-cortical connectivity is most strongly localized at hippocampal body and head. Hippocampal-cortical connectivity modulations by tACS during resting (C) and task state (D). E Psychophysiological interaction (PPI) results. Error bars represent standard error of the mean (SEM). AG angular gyrus, rHPC right hippocampus, NS no stimulation; *p < 0.05; **p < 0.01; ***p < 0.005. Sample size Ns = 18.
To explore the spatial distribution of the tACS effect within the right hippocampus, we used the IPL cluster as seed for a functional connectivity analysis to all right hippocampal voxels as targets. We note that this is a circular explorative analysis that we used to localize the strongest connectivity changes in the hippocampus. We found a significant voxel cluster towards the centre of the anterior-posterior axis, overlapping with the transition between the hippocampal head and body (Fig. 6B). A similar hippocampal area of modulated connectivity was also found after parietal rTMS4, which suggests that parietal tACS affected a regionally specific hippocampal-cortical connection zone within the hippocampus.
An analogous right hippocampal seed analysis for the tACS conditions during task performance revealed no significant voxel clusters. Figure 6D shows the average seed-based correlations for each tACS condition during task performance in the IPL cluster that was obtained from the resting state analysis. We found no significant differences between the no-stimulation and any of the stimulation conditions (5 Hz: t(17) = −0.00, 95% CI = [−0.06 0.06], p = 1.0; 10 Hz: t(17) = −0.09, 95% CI = [−0.06 0.06], p = 0.93; 20 Hz: t(17) = 0.89, 95% CI = [−0.07 0.03], p = 0.39; 40 Hz: t(17) = −0.17, 95% CI = [−0.06 0.05], p = 0.87). Bayes factors indicated moderate evidence in favour of no effect of tACS on connectivity during task performance (BF10 5 Hz = 0.24, 10 Hz = 0.24, 20 Hz = 0.34, 40 Hz = 0.25). Further, the strength of hippocampal-cortical connectivity during 5 Hz tACS did not significantly differ from those of the other stimulation conditions (5 Hz > 10 Hz: t(17) = −0.09, 95% CI = [−0.06 0.05], p = 0.93; 5 Hz > 20 Hz: t(17) = −0.96, 95% CI = [−0.07 0.03], p = 0.35; 5 Hz > 40 Hz: t(17) = −0.13, 95% CI = [−0.07 0.06], p = 0.90); Bayes factors indicated anecdotal to moderate evidence in favour of no effect of 5 Hz over other stimulation frequencies (BF10 5 Hz > 10 Hz = 0.24, 5 Hz > 20 Hz = 0.37, 5 Hz > 40 Hz = 0.25). Thus, the effect of parietal tACS on hippocampal-cortical connectivity depended on brain state, with tACS modulating hippocampal-cortical connectivity during rest but not during attentional task performance. To statistically test the frequency-specificity of 5 Hz tACS on right hippocampal-cortical connectivity during rest but not task blocks, we conducted a repeated measures ANOVA using a tACS contrast of 5 Hz vs. the pooled non-theta stimulation conditions (i.e., 5 Hz > (10 Hz + 20 Hz + 40 Hz)) during rest and task. We found a significant effect of tACS (F(1,17) = 7.08, p = 0.0166, ({eta }_{p}^{2}) = 0.29, 95% CI = [0.03 0.63]) and a significant tACS x State interaction term (F(1,17) = 5.72, p = 0.029, ({eta }_{p}^{2}) = 0.25, 95% CI = [0.01 0.60]), which statistically corroborated a frequency- and state-specific effect of tACS on right hippocampal-cortical connectivity.
Psychophysiological interaction analysis
We then tested the interaction between 5 Hz tACS and brain state more directly by conducting a psychophysiological interaction59, using the right hippocampus as “physiological factor” and the tACS and task- and resting-states as “psychological factor” in the analysis. Compared to the seed-based analysis, the psychophysiological interaction analysis specifies the interaction term between the physiological factor and the psychological factors, providing a measure of tACS-based connectivity modulation between the two mental states above the “main effects” of tACS and brain states. Calculated at the voxel-level, we again found a significant cluster in the right IPL (46 mm3, x,y,z = 48, −44,38; Fig. 6E), which overlapped with the cluster from the seed-based analysis, as well as a significant cluster in the left inferior frontal cortex (42 mm3, x,y,z = −56,8, −14; Fig. 6E). In both clusters, 5 Hz tACS modulated hippocampal-cortical connectivity compared to the no stimulation condition during rest, but not during task performance. However, 5 Hz tACS increased hippocampal-cortical connectivity in parietal cortex, but decreased connectivity in frontal cortex, suggesting an opposing effect of brain stimulation.
Frequency-specific hippocampal network effects
The previous analyses focused on a differential effect of 5 Hz stimulation over the no stimulation condition. To assess a frequency-specific 5 Hz network effect over other tACS frequencies (independent of the no stimulation condition) in brain connectivity, we first compared theta vs. pooled non-theta conditions (i.e., 5 Hz > (10 Hz + 20 Hz + 40 Hz)) between task and rest in a voxel-by-voxel analysis. After statistical thresholding prior to visualization, we found no significant voxel clusters. We then increased statistical power by applying the theta vs. non-theta contrast only to the rest blocks. After statistical thresholding for visualization, we found three voxel clusters in right AG, right middle temporal gyrus and right fusiform gyrus (Fig. 7) in which theta tACS increased functional connectivity significantly more than the other (pooled) stimulation conditions. We found no negative voxel clusters. Conducting the same contrast in these voxel clusters for the task blocks revealed no significant effects (AG: t(17) = −0.15, 95% CI = [−0.04 0.03], p = 0.88; MFG: t(17) = 0.64, 95% CI = [−0.03 0.05], p = 0.53; FFG: t(17) = 1.20, 95% CI = [−0.02 0.07], p = 0.25), with Bayes Factors indicating anecdotal (BF10 FFG = 0.45) to moderate evidence (AG = 0.25, MFG = 0.29) of no difference. The interaction between theta vs. non-theta and Rest vs. Task was significant in AG (F(1,17) = 17.92, p < 0.001, ({eta }_{p}^{2}) = 0.51, 95% CI = [0.22 0.76]) and MFG (F(1,17) = 10.53, p = 0.005, ({eta }_{p}^{2}) = 0.38, 95% CI = [0.08 0.69]), and marginally significant in FFG (F(1,17) = 4.39, p < 0.051, ({eta }_{p}^{2}) = 0.21, 95% CI = [0.00 0.56]). Thus, 5 Hz tACS altered hippocampal connectivity within and outside of parietal cortex.

Hippocampal-seeded theta-specific connectivity change in three ROIs during rest (A, C, E) and task blocks (B, D, F). See main text for details. *p < 0.05; **p < 0.01; ***p < 0.001; NS not significant, AG/SMG angular/supramarginal gyrus, MFG middle frontal gyrus, FFG fusiform gyrus. Ns = 18.
Hippocampal connectivity with resting-state networks
To assess if tACS modulated hippocampal connectivity with resting-state networks, we calculated region-to-region connectivity between right hippocampus and the nodes of four different resting-state networks, which included the default-mode network, the salience network, the fronto-parietal network and the visual network. Figure 8 shows a circular plot with hippocampal connections to each of the four networks depicted by red (positive correlations) or blue lines (negative correlations). Right hippocampus was significantly positively connected to Default-Mode Network regions and negatively connected to Salience network regions during the no stimulation resting condition (asterisks placed within the circular plot), which fits with the hippocampus seed-based results shown in Fig. 4A. There were no significant hippocampal connections with the Fronto-Parietal and Visual resting-state networks. Further, the 5 Hz tACS modulation of hippocampal connectivity was significant for the right SMG node of the Salience Network, mimicking the previously described voxel-based results. These results thus show that, while the hippocampus is widely connected to multiple areas of several resting-state networks, tACS specifically modulated hippocampal-parietal connectivity.
Post-hoc seed-based analysis using P4 central electrode site
We found no evidence of tACS-induced hippocampal connectivity changes in parietal areas closer to the central electrode, despite the electric field simulation showing the strongest signal modulation at the central electrode (see Fig. 2). To explore brain-wide connectivity changes in relation to the P4 location of the central electrode, we created a regional sphere of 8 mm radius at the central electrode location (Fig. 5D) as seed region for a seed-based connectivity analysis and compared P4-seeded connectivity between the no stimulation and 5 Hz conditions during resting blocks. The statistical map, after thresholding for visualization, revealed no significant clusters (Fig. 9).

The plot shows the positive (red) and negative (blue) hippocampal connections with each of the regions of four resting-state networks. Asterisks on the circle indicate significant connectivity during the no stimulation resting blocks. The asterisk outside of the circle (R SMG of the SN) indicates significant connectivity change between no stimulation and 5 Hz in resting blocks. Hipp hippocampus, PFC prefrontal cortex, ACC anterior congulate cortex, SMG supramarginal gyrus, PPC posterior parietal cortex, IPC inferior parietal cortex. Ns = 18.
Post-hoc seed-based analysis using the left hippocampus
To test if the right parietal tACS effect was hemisphere-specific, we repeated the seed-based analysis of the tACS conditions during rest using the left hippocampus as seed. The statistical map, after thresholding for visualization, revealed no significant clusters.
Post-hoc comparisons of signal quality across tACS conditions
Here, we investigated if our finding of 5 Hz tACS modulation of hippocampal-parietal connectivity could be confounded by a local change in signal quality due to electric stimulation. The induced electrical current over right parietal cortex could have decreased signal amplitude or variability but not affect more distal brain areas. In this case, a local signal change could masquerade as a distributed change in network connectivity, with the affected node being functionally decoupled from the remainder of the network. This would contradict our interpretation of an anatomically specific modulation of hippocampal-cortical connectivity. To verify that our results were not due to such a scenario, we conducted the following post-hoc analyses.
First, we tested if 5 Hz tACS affected connectivity across an AG-seeded network of functionally connected areas. During no stimulation rest blocks, the AG cluster showed significant positive and negative connectivity (after statistical thresholding, Fig. 9A) across a widely distributed network of frontal, parietal and temporal cortical areas and subcortical structures including hippocampus. Against this baseline connectivity, 5 Hz tACS significantly altered connectivity only with the hippocampus and showed a statistical trend of weaker connectivity with the posterior cingulate cortex (moderate evidence in favour of a difference, BF10 = 3.5; Fig. 9B). In many other areas, there was moderate evidence for no effect of 5 Hz stimulation (see values listed in Fig. 9B). These findings are not in line with a “local node” tACS effect, but rather support an anatomically specific hippocampal-cortical connectivity modulation.

Connectivity in an AG-seeded network during no stimulation rest blocks (A) did not change with theta-tACS (B). Green (purple) bars indicate no stimulation (theta tACS) condition. Numbers in (B) show BF10 values for no stimulation vs. theta comparison. + moderate evidence for difference BF10 > 3; − moderate evidence for no difference BF10 < 0.33; *p < 0.05 (Bonferroni–Holm corrected). Ns = 18.
Second, we compared fALFF values between the no stimulation vs. theta conditions in right hippocampus, the P4 sphere and the angular gyrus region that showed the tACS modulation effect (Fig. 10). We found no significant differences in either of the three regions-of-interest (AG: t(17) = 0.08, 95% CI = [−0.03 0.03], p = 1.75; P4: t(17) = −1.11, 95% CI = [−0.03 0.01], p = 0.85; right hippocampus: t(17) = −0.35, 95% CI = [−0.02 0.01], p = 2.77; Bonferroni–Holm corrected), with anecdotal (BF10 P4 = 0.42) to moderate evidence for no difference between conditions (right hippocampus = 0.26, AG = 0.24).
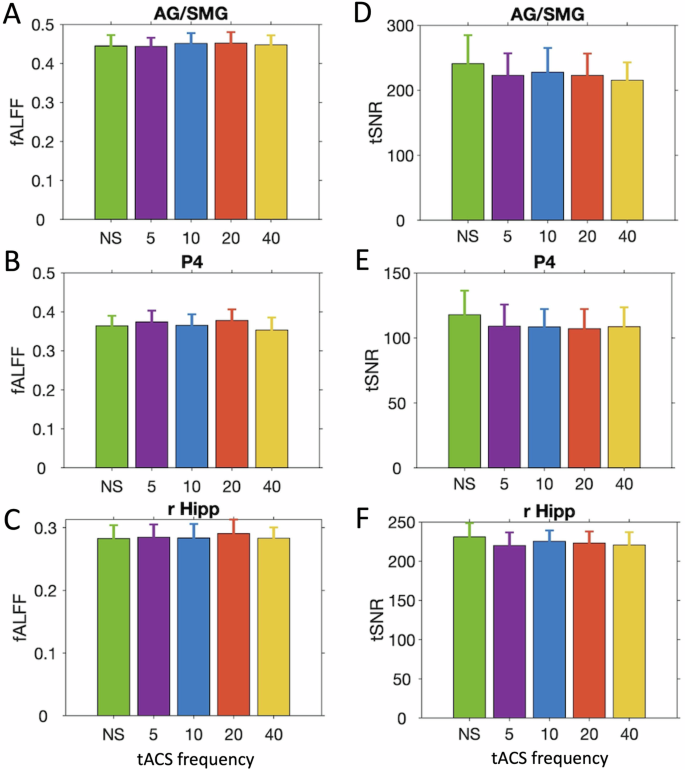
Fractional amplitude of low frequency fluctuations (fALFF; A–C) and temporal signal-to-noise ratio (tSNR; D–F) for the five tACS conditions during rest blocks in AG/SMG (A, D), electrode site P4 (B, E) and right hippocampus (C, F). Error bars depict 95% confidence intervals (Ns = 18).
Third, we calculated temporal signal-to-noise ratio (tSNR; temporal mean/temporal SD) for each voxel and tACS condition and calculated statistical maps for the comparisons between the no stimulation and each of the stimulation conditions. After statistical map thresholding, we found no significant differences for any of the comparisons (see also ref. 45). We also found no statistically significant differences in the three target regions-of-interest (Fig. 10; AG: t(17) = 1.62, 95% CI = [−5.25 40.01], p = 0.37; P4: t(17) = 2.34, 95% CI = [0.84 16.49], p = 0.13; right hippocampus: t(17) = 2.47, 95% CI = [1.76 22.66], p = 0.10; Bonferroni–Holm corrected), but the anecdotal evidence (BF10 AG = 0.7, P4 = 2.1, right hippocampus = 2.5) was inconclusive to rule out an effect of tACS on tSNR in cortex or hippocampus.
Finally, we compared functional image denoising parameters, which included realignment (head movement) and volume scrubbing vectors. Each parameter comprised one or more timeseries per tACS condition and participant. For each parameter, we averaged within and across timeseries values and calculated paired samples T-tests between the no stimulation condition and each of the stimulation conditions. We found no significant differences for the comparisons between no stimulation and 5 Hz stimulation (realignment: t(17) = −0.72, 95% CI = [−0.03 0.02], p = 0.48, BF10 = 0.31; scrubbing: t(17) = −0.39, 95% CI = [−0.69 0.48], p = 0.70, BF10 = 0.27). In sum, these results indicate that the observed hippocampal-cortical connectivity modulation by tACS unlikely to result from local artifactual changes in signal quality induced by tACS.
Discussion
We found that parietal tACS significantly modulated hippocampal-cortical connectivity in a frequency-, state- and topologically-specific manner, consistent with the notion that hippocampal-parietal connectivity is characterized by theta oscillatory activity during resting-states, but not during attentional orienting. Moreover, tACS reversed the negative hippocampal-parietal connectivity to a positive connectivity, albeit at weaker magnitude compared to no stimulation baseline, while also increasing hippocampal connectivity with other cortical areas. Our findings add to the previous literature by showing that tACS can be used to modulate hippocampal-cortical connectivity in humans non-invasively.
The increased connectivity between right hippocampus and areas outside of the parietal site of stimulation provides compelling evidence for a tACS network effect. This notion is further supported by a lack of widespread AG-seeded connectivity change, which argues against a local suppression of AG activity that could have masqueraded as a hippocampal-cortical connectivity effect. We thus argue that our findings suggest that theta tACS enhanced hippocampal-cortical connectivity. TES is more likely to affect spike timing if frequency and phase of the endogenous activity of the stimulated neural tissue is already close to that of the stimulation signal, and distal areas synchronized to the stimulated area will become more strongly functionally coupled during stimulation8,66,67. This aligns well with observations of increased neural activity and metabolism in hippocampal-cortical networks during resting states68,69, but not when attention is directed externally70,71,72, and would explain the state-specific tACS enhancement of hippocampal-cortical connectivity in our study. Recent electrophysiological recordings in nonhuman primates during tACS showed a redistribution of neural spikes to the phase of the stimulation frequency in visual cortical and subcortical areas31,66,73. Moreover, both cortical73 and subcortical neurons31 showed increased phase coupling to 90° of the sinusoidal stimulation signal but not during sham stimulation. This apparent phase correlation could enhance neural synchrony and thereby functional coupling between hippocampus and cortex during stimulation, in line with our findings. However, we did not observe a clear change in local hippocampal signal dynamics or at the cortical site of stimulation. It is possible that the MR signal metrics that we analysed are not sensitive to the spike redistribution induced by electric stimulation31. Alternatively, theta tACS could have modulated connectivity without modulating hippocampal activity, e.g. by inducing more theta oscillatory activity in cortical areas that would correlate with ongoing hippocampal oscillatory activity. Future studies of simultaneous tACS and magneto- or electroencephalography could address this issue by measuring oscillatory activity during stimulation at cortical and source-reconstructed subcortical areas.
We also found that tACS affected baseline parietal negative connectivity, but not positive connectivity. Previous studies have shown that negatively connected or “anti-correlated” areas support dynamic responding to changing cognitive demands74,75. This could make these connections more susceptible to the effects of tACS than positively connected areas. We note that this differs from the effect of repetitive TMS of enhancing positive baseline hippocampal-cortical connectivity4, which may be related to the different modes of operation that tACS and TMS have on modulating brain connectivity.
The anatomically specific impact of modulating hippocampal-cortical connectivity at the AG may stem from the interplay between TES spatial distribution and relevant functional-anatomical architecture. The most pronounced effect was observed between the central and outer concentric electrodes, aligning with the spatial distribution of the electric field generated by those electrodes38,45. Additionally, the angular gyrus exhibits anatomical connectivity with the medial temporal lobe through the longitudinal fasciculi’s white matter fibres 76, and it is frequently co-activated with or functionally connected to the hippocampus across various cognitive and resting states40,77,78,79. It is thus conceivable that placing concentric electrodes over the inferior parietal cortex optimally modulates hippocampal-angular gyrus connectivity, although this hypothesis remains to be tested.
Limitations and considerations
One methodological consideration is our electrode placement using the EEG localization system and the standardized P4 location chosen for all participants. It is possible that individual localization, based on anatomically or functionally defined targets could lead to stronger hippocampal modulation. For example, several indirect hippocampal stimulation studies using transcranial magnetic stimulation positioned the TMS coil using functionally defined resting-state connectivity in parietal areas in individual participants4,52, while coil positioning using an EEG cap can be off be several millimeters80. However, the larger signal spread of TES, even for focal setups as ours, may limit the advantage of individualized positioning as observed for TMS. Empirical and EF simulation studies are required to further elucidate this issue.
A further consideration is that our choice of TES over the right hemisphere, based on the initial goal of modulating attentional performance, differs from other studies that administered TES over left parietal cortex37,81,82. These studies reported changes in working memory or associative memory after left parietal TES, but it is not clear if TES affected hippocampal function in these studies. Indirect modulation of hippocampal connectivity and function using TMS has been shown using left4 as well as right hemisphere stimulation36. Our findings extend previous TMS results by showing that right-sided electrical brain stimulation can also be used to modulate hippocampal-cortical connectivity.
Finally, we cannot rule out that post-stimulation entrainment affected neural activity in subsequent stimulation blocks. Post-stimulation neural entrainment is currently being debated, with some studies reporting ongoing oscillatory neural activity after cessation of electric stimulation83,84, while other studies did not85,86. Further, post-stimulation entrainment likely depends on cognitive context, stimulation frequency and duration, amongst other parameters83. We therefore argue that the changing context between task and rest blocks and stimulation frequencies in our experiment would have hampered post-stimulation entrainment.
Conclusion
In conclusion, this study shows the feasibility of context-specific modulation within hippocampal-cortical networks using oscillatory electrical stimulation, extending the non-invasive brain stimulation toolkit to modulate oscillatory cortico-subcortical network connectivity in healthy participants. It remains to be investigated if our induced connectivity modulation enhances or impairs cognitive functions associated to this neural coupling.

Responses