Single-cell profiling of the human endometrium in polycystic ovary syndrome

Main
Polycystic ovary syndrome (PCOS) affects 11–13% of reproductive-aged women and caused an economic burden of US$8 billion in 2020 (refs. 1,2). PCOS is a leading cause of anovulatory infertility and is linked to comorbidities such as insulin resistance, type 2 diabetes (T2D) and endometrial cancer3. Key reproductive features include hyperandrogenism, anovulation and menstrual irregularities, which are exacerbated by obesity3. Women with PCOS experience implantation failure, early and mid-pregnancy miscarriages and higher risks of gestational diabetes, hypertension, pre-eclampsia and intrauterine growth restriction compared with women without PCOS4—conditions associated with endometrial dysfunction.
The PCOS-endometrium exhibits unopposed estrogen stimulation and progesterone resistance5,6, impairing decidualization and potentially altering immune cell function7,8,9. These changes, alongside altered gene expression, are associated with reduced endometrial receptivity, early miscarriages, poor pregnancy outcomes and increased risk of endometrial cancer. An altered immune environment, compared with women without PCOS, is also expected10. Although these findings suggest intrinsic endometrial dysfunction and a distinct PCOS phenotype, little is known about how specific cell types—such as epithelial, stromal, endothelial, glandular, smooth muscle and immune cells—contribute to this dysfunction or whether specific cell types play a dominant role.
Current PCOS treatments target symptoms without addressing underlying mechanisms. Lifestyle management, the first-line treatment for overweight or obese women with PCOS1,3, improves insulin signaling and modulates androgen, estrogen-α and progesterone receptor expression6,9,11. Metformin, used when lifestyle changes are insufficient1,3, alleviates insulin resistance and hyperandrogenism, reversing androgen effects on insulin receptor-I and glucose-transporter type 4 (GLUT4) while improving immune alterations4,12. However, its impact on cell-type-specific endometrial dysfunction in PCOS remains unclear.
In the present study, we applied single-nuclei RNA sequencing (snRNA-seq) and spatial transcriptomics to create a cellular and transcriptional atlas of the proliferative-phase endometrium in overweight and obese, insulin-resistant women with and without PCOS. This approach identified cell-type-specific molecular disease signatures, variations in cellular composition and the spatial localization of PCOS-specific cells. Remarkably, some PCOS-specific endometrial signatures were partially restored after 16 weeks of metformin and lifestyle management.
Results
Clinical characteristics
Superficial endometrial biopsies from the functionalis layer were collected during the proliferative phase (days 6–8) from 12 women with PCOS (all but one meeting the Rotterdam criteria) and 5 controls of a similar age, weight and body mass index (BMI) (Fig. 1a and Supplementary Table 1a,b). After baseline assessment, ten participants with PCOS underwent a 16-week randomized trial (metformin: n = 7; lifestyle: n = 3) (Fig. 1a). Participants were medication free for ≥3 months, except five PCOS cases using Provera for bleeding induction (Supplementary Table 1b). PCOS participants exhibited hyperandrogenism (elevated Ferrima–Gallwey scores, dehydroepiandrosterone (DHEA) and androstenedione) and insulin resistance (higher homeostatic model assessment for insulin resistance (HOMA-IR)). Endometrial thickness and progesterone levels confirmed proliferative-phase sampling (Supplementary Table 1a,b). Metformin reduced antral follicle count, androstenedione, testosterone and a free androgen index, whereas lifestyle intervention showed no significant hormonal changes. Menstrual frequency improved in one of three lifestyle and three of seven metformin participants (Supplementary Table 1b), with shifts to regular cycles or shorter intervals.

a, Schematic illustration of the included participants, endometrial biopsies collected in proliferative phase days 6–8, snRNA-seq with 10x Genomics and spatial transcriptomics with Stereo-seq and bioinformatic analysis pipeline. GSEA, gene set enrichment analyses; QC, quality control. b, Color code and number of captured nuclei for snRNA-seq of control and PCOS-endometrium at baseline and after 16 weeks of treatment with metformin or lifestyle intervention. c, UMAP projections of the integrated snRNA-seq data from 27 participants (n = 247,791 nuclei) showing 7 cell-type-specific clusters. d, Dotplots showing the log(transformed) gene expression of cell-type markers characterizing each main cluster. e, Bar plot and table showing the proportion of major cell clusters from endometrial biopsies of the proliferative phase at baseline (control, n = 5; PCOS, n = 12; and after 16 weeks of intervention: PCOS-metformin, n = 7; PCOS-lifestyle, n = 3; *BH-adjusted P < 0.05 following a two-sided Mann–Whitney U-test). f, Boxplot showing the differences in the nuclei proportion (percentage of cell nuclei) of epithelial, stromal and lymphoid cells between women with and women without PCOS at baseline (BH-adjusted exact P value after two-sided Mann–Whitney U-test) and the changes from baseline to after 16 weeks of metformin or lifestyle, respectively, in women with PCOS (BH-adjusted P exact value after two-sided Wilcoxon’s signed-rank test). NS, not significant. The line inside the box indicates the median value and the box delimits the 25th and 75th percentiles. The smallest and largest values are indicated by the lines outside the box. g, Spatial transcriptomic with Stereo-seq of integrated labeling and the main markers for epithelial and stromal main clusters from two control individuals, two with PCOS, one with PCOS after 16 weeks of metformin and one with PCOS after lifestyle management. Schematic in a created using BioRender.com.
A single-nucleus atlas of the human PCOS-endometrium
We generated a single-nuclei map of human endometrial biopsies from all participants, identifying cell-type-specific disease signatures, compositional variations and transcriptomic changes after 16 weeks of metformin or lifestyle intervention. Single nuclei extracted from 27 biopsies were processed for snRNA-seq using the 10x Genomics protocol (Fig. 1a). Spatial transcriptomics on six samples (two controls, two PCOS-baseline, one PCOS-metformin, one PCOS-lifestyle) validated localization and transcriptomic changes after treatment (Fig. 1a).
After quality control, 247,791 nuclei were analyzed: 44,336 from controls, 99,482 from PCOS-baseline, 78,664 from PCOS-metformin and 25,309 from PCOS-lifestyle (Fig. 1b,c and Supplementary Table 1c–e). Seven main cell clusters were identified based on known markers13,14,15: stromal cells (n = 124,055), smooth muscle cells (SMCs; n = 2,737), epithelial cells (n = 105,095), lymphoid and myeloid immune cells (n = 13,596), endothelial cells (n = 2,308) and lymphatic cells (n = 2,308) (Fig. 1c,d and Extended Data Fig. 1a–d). Importantly, no differences in reads per nucleus, nuclei count or nuclei proportions were observed between induced and noninduced bleeding samples (Supplementary Table 1 and Extended Data Fig. 1f,g). Although endometrial biopsies were taken at the same phase of the menstrual cycle in all participants, PCOS biopsies had more epithelial cells and fewer stromal and lymphoid cells compared with controls, with no significant changes post-intervention (Fig. 1e,f). The cell-type proportions were compared with proliferative endometrium from control and endometriosis biopsies in the Human Endometrial Cell Atlas16, revealing similar patterns (Supplementary Table 1g).
Spatial transcriptomics confirmed cell-type locations, validated marker genes used for cluster annotation and revealed spatial location of cellular subpopulations (Supplementary Table 1h), highlighting distinct clusters of epithelial (EPCAM) and stromal cells (IGF1) in samples from two controls, two PCOS and one PCOS-metformin and one PCOS-lifestyle (Fig. 1g and Extended Data Fig. 2a,b). Immune and endothelial cells were detected but were less prominent as a result of their lower abundance. These findings provide a detailed transcriptional and spatial map of endometrial alterations in PCOS.
Spatiotemporal alterations in the proliferative epithelium
Subcluster analysis of epithelium identified six subpopulations: (1) luminal positive, (2) SOX9+LGR5+, (3) SOX9+LGR5−, (4) SOX9+ cycling, (5) ciliated cells and (6) AR+ cells (Fig. 2a–c and Extended Data Fig. 3a–d), with no difference between samples obtained from women who had induced or noninduced bleeding (Extended Data Fig. 4a,b). Despite a higher proportion of epithelial nuclei in the PCOS-endometrium (Fig. 1e,f), there was no difference in the proportions among the epithelial subpopulations compared with control endometrium (Fig. 2d). Estrogen-α (ESR1), progesterone (PGR) and androgen (AR) receptors are critical for endometrial proliferation and differentiation, with expression varying during the menstrual cycle9,17. ESR1 was downregulated in AR+, SOX9+LGR5+ and SOX9+ cycling epithelial subpopulations in women with PCOS versus women without the syndrome (Fig. 2e), confirmed at the protein level (Fig. 2f and Extended Data Fig. 1e) and consistent with a previous study9. This was partially reversed by metformin (Fig. 2e). Neither AR nor PGR (encoding PR) expression varied significantly, reflecting the proliferative phase. The dotplot and Stereo-seq illustrate ESR1, PGR and AR expression levels across subpopulations (Extended Data Fig. 5a,b).
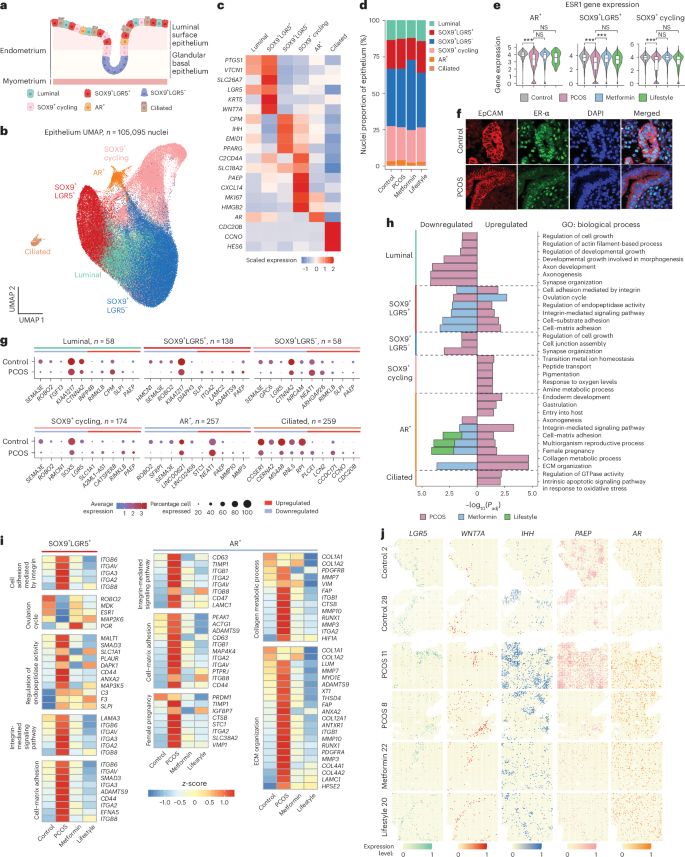
a, Schematic illustration of epithelial cells in the proliferative endometrium. b, UMAP projections of epithelial nuclei (n = 105,095) from all individuals (n = 27) revealing 6 subclusters. c, Heatmap of scaled log(transformed) gene expression characterizing the six epithelial subclusters. d, Bar plot showing the proportion of the six epithelial subclusters from the control group (n = 5), the PCOS group (n = 12), the PCOS-metformin group (n = 7) and the PCOS-lifestyle group (n = 3). e, Violin plots of log(transformed) ESR1 expression in the control, PCOS, PCOS-metformin and PCOS-lifestyle groups in AR+, SOX9+LGR5+and SOX9+ cycling epithelium cell types. The line inside the box indicates the median value and the box delimits the 25th and 75th percentiles. The smallest and largest values are indicated by the lines outside the box. ***BH-adjusted P < 0.001 in DEG analysis. f, Representative fluorescence microscopy images of fixed endometrial tissue from one PCOS and one control stained with EPCAM, a marker for glandular epithelial cells, cell adhesion and organoid membrane integrity, ESR1, DAPI and a merged image. g, Total number of DEGs in each epithelial subcluster and dotplots of the five most upregulated or downregulated DEGs (control versus PCOS) in each subcluster. h, GO enrichment analyses of DEGs divided by up- or downregulated genes within each epithelial subcluster between women with and women without PCOS at baseline and the changes from baseline to after 16 weeks of metformin or lifestyle management in women with PCOS. GOs with BH-adjusted P < 0.05 are reported and −log10(transformed) for visualization. i, Heatmap showing DEGs in GOs in epithelial subclusters between controls and PCOS and DEGs reversed by metformin or lifestyle intervention. j, Spatial transcriptomic with Stereo-seq of selected cell-type gene markers in epithelial subclusters of two control, two PCOS and one PCOS after 16 weeks of metformin and one PCOS after lifestyle management. See ‘Statistical analyses’ for a detailed description of DEG analysis and GO enrichment analysis statistics. Schematic in a created using BioRender.com.
Source data
Differentially expressed gene (DEG) analyses comparing samples from women with and women without PCOS in epithelial subpopulations identified the most DEGs in SOX9+LGR5+ (n = 138), SOX9+ cycling (n = 174), AR+ (n = 257) and ciliated (n = 259) subclusters. The five most up- and downregulated genes (Fig. 2g) and all DEGs per subcluster are listed in Supplementary Table 2a–c. Many genes are differentially expressed in multiple subclusters, suggesting a PCOS-specific composition of and effects on epithelial cells. For example, the expression of SEMA3, a semaphorin related to angiogenesis and cell proliferation, is increased in the proliferative phase compared with the secretory phase in non-PCOS and in participants with thin endometrium18. In the present study, SEMA3E is downregulated in all epithelial subclusters in women with PCOS, except ciliated cells. The ROBO2 receptor is elevated in the proliferative phase and lower in the secretory phase in the non-PCOS-endometrium19, whereas it is downregulated in AR+, SOX9+LGR5+ and luminal subclusters in the PCOS-endometrium. PAEP, the progestin-associated endometrial protein, linked to recurrent pregnancy loss20, was upregulated in PCOS luminal, SOX9+LGR5+, SOX9+LGR5− and AR+ subclusters. NEAT1, linked to endometrial cancer21, implantation failure and inflammation22, was upregulated in PCOS SOX9+LGR5− and AR+ subclusters (Fig. 2g). SLPI, an antibacterial gene23, was upregulated in PCOS luminal, SOX9+LGR5+ and SOX9+LGR5− subpopulations (Fig. 2g). ITGA2, associated with PCOS24, was specifically increased in SOX9+LGR5+ subpopulations (Fig. 2g). These findings suggest a distinct epithelial composition and transcriptomic profile in the endometrium of women with PCOS.
Gene ontology (GO) analysis of DEGs in PCOS versus controls revealed enriched pathways related to pregnancy, ovulation, endoderm development, tissue structure, integrin-mediated adhesion, signaling and extracellular matrix (ECM) organization across subpopulations (Fig. 2h, Extended Data Fig. 5c and Supplementary Table 3a–c). Metformin reversed signaling pathways and DEGs in SOX9+LGR5+ and AR+ subpopulations, whereas lifestyle management affected only AR+ subpopulations (Fig. 2i). In the ovulation cycle pathway of a PCOS-SOX9+LGR5+ subpopulation, metformin restored ROBO2, MDK (linked to endometrial cancer)25 and ESR1 and MAP2K6 (associated with recurrent implantation failure)26. For integrin-mediated signaling and ECM organization, in PCOS-endometrium both treatments restored expression of ArgGluAsp receptors (ITGB6, ITGB8 and ITGAV), collagen receptor ITGA2, laminin receptor ITGA3 and ADAMTS9 (linked to reduced oocyte maturation in PCOS)27,28. Integrins, as transmembrane receptors, mediate ECM–cytoskeleton connections, transmitting critical biochemical and mechanical signals in disease27.
To map the spatial distributions of subpopulations identified by snRNA-seq, we projected cell-type-specific marker genes on to Stereo-seq data, validating subpopulations and defining spatial coordinates (Fig. 2j). Luminal cells (LGR5), SOX9+LGR5+ (WNT7A), SOX9+LGR5− (IHH), SOX9+ cycling (PAEP) and AR+ cells (AR) were mapped. Key markers related to endometrial dysfunction, such as ROBO2, ITGA2 and ADAMTS9, were also visualized (Extended Data Fig. 6).
Overall, we characterized and localized epithelial subpopulations in the PCOS-affected endometrium, revealing increased proportions of epithelial cells with distinct DEG patterns linked to endometrial cancer, endometrial receptivity and implantation failure, supporting the link to PCOS-specific endometrial dysfunction in the proliferative phase. SOX9+LGR5+ and AR+ subpopulations exhibit enriched pathways in ECM organization, collagen metabolism, integrin signaling and pregnancy. These subpopulations are unique in their responsiveness to metformin and reverse several of the dysregulated genes. Lifestyle changes also contributed to gene regulation, although to a lesser extent.
Spatiotemporal alterations in PCOS endometrial stromal cells
Stromal cells were annotated into five subpopulations: (1) stroma 1, (2) stroma 2, (3) proliferative stroma, (4) fibroblasts and (5) SMCs (Fig. 3a,b and Extended Data Fig. 3a–d) with no difference between induced and noninduced bleeding samples (Extended Data Fig. 4c,d). Although the proportion of stromal cells was lower in PCOS-endometrium compared with non-PCOS-endometrium, subpopulation proportions remained unchanged after intervention (Fig. 3c).
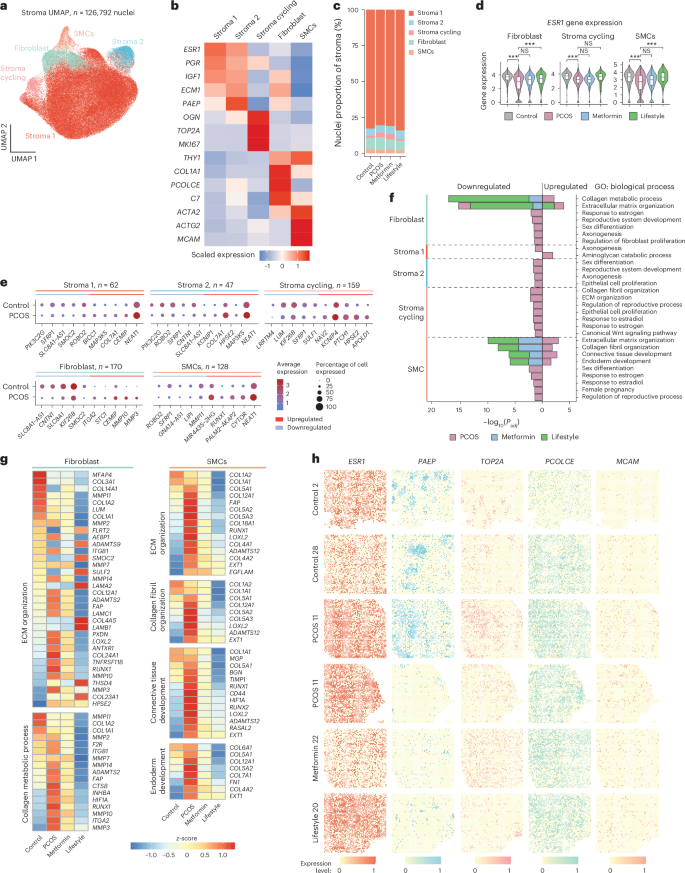
a, UMAP projections of the stromal nuclei subclusters (n = 126,792) from all individuals (n = 27). b, Heatmap of the scaled log(transformed) gene expression characterizing the five stromal subclusters. c, Bar plot showing the proportion of the five stromal subclusters from: control (n = 5), PCOS (n = 12), PCOS-metformin (n = 7) and PCOS-lifestyle (n = 3). d, Violin plots of log(normalized) ESR1 expression in the control, PCOS, PCOS-metformin and PCOS-lifestyle groups in fibroblast, stroma cycling and SMC cell types. The line inside the box indicates the median value and the box delimits the 25th and 75th percentiles. The smallest and largest values are indicated by the lines outside the box. ***BH-adjusted P < 0.001 in DEG analysis. e, Total number of DEGs in each stromal subcluster and dotplots of the top five up- and downregulated DEGs (control versus PCOS) in each subcluster. f, GO enrichment analyses for DEGs split on up- or downregulation, within each stromal subcluster at baseline between control and PCOS and between PCOS-baseline and after 16 weeks of intervention with metformin or lifestyle, respectively. GOs with BH FDR P < 0.05 are reported and −log10(transformed) for visualization. g, Heatmap showing DEGs in GOs in stromal subclusters between controls and PCOS and DEGs that are reversed by metformin or lifestyle intervention. h, Spatial transcriptomic with Stereo-seq of selected cell-type markers in stromal subclusters. See ‘Statistical analyses’ for a detailed description of DEG analysis and GO enrichment analysis statistics.
Source data
As in the epithelium, ESR1 was downregulated in the PCOS-endometrium compared with the non-PCOS-endometrium in proliferative stromal cells, fibroblasts and SMCs, and is reversed by lifestyle management in women with PCOS (Fig. 3d). Extended Data Fig. 5a,b shows the expression level of ESR1, PGR and AR in all stromal subpopulations in controls and cases of PCOS with no change after intervention. The comparison between women with and women without PCOS revealed the highest number of DEGs in proliferative stroma (n = 159), fibroblasts (n = 170) and SMCs (n = 128). Key up- and downregulated DEGs in PCOS in stroma 1 and stroma 2, which were not differentially expressed in any other subpopulation, included PIK3C2G (downregulated), a gene associated with granulosa cell tumor29, MAP3K5 (upregulated), a marker of human endometrial receptivity30, and the collagen gene COL7A1 (upregulated), a component of the basement membrane and surrounding vasculature that plays an important role in regulating tissue remodeling and homeostasis31 (Fig. 3e and Supplementary Table 2a–c). In addition, SFRP1, a Wnt signaling inhibitor with higher expression in the proliferative phase32, is downregulated in the stroma 1, stroma 2, stroma cycling and SMC subpopulation in women with PCOS compared with controls. Moreover, NEAT1 is also upregulated in stroma 1, stroma 2 and SMCs in the PCOS-endometrium.
GO for biological processes of DEGs between PCOS cases and controls revealed enriched pathways related to estrogen response, reproductive development, epithelial organization and ECM and collagen organization, particularly in fibroblasts, proliferative stroma and SMCs (Fig. 3f). In women with PCOS, metformin and lifestyle management (to a lesser extent) reversed dysregulated collagen metabolism, ECM organization and connective tissue development exclusively in fibroblasts and SMCs (Fig. 3f,g, Extended Data Fig. 5d and Supplementary Table 3a–c). In fibroblasts, lifestyle and, to lesser extent, metformin normalized elevated HIF1A (impairing stromal fibroblast decidualization critical for embryo implantation)33, RUNX1 (linked to endometrial cancer and angiogenesis)34, MMP3 and MMP10 (involved in extracellular remodeling and associated with endometriosis)35 and ITGA2, often upregulated in endometrial cancer and PCOS epithelial cells24. In SMCs, both treatments restored collagen-encoding genes and the expression of fibronectin and CD44.
Next, we projected the cell-type-specific stromal cell marker genes from snRNA-seq on to the Stereo-seq data to validate each subpopulation and define specific spatial coordinates for the specific marker genes: ESR1 (stroma 1), PAEP (stroma 2), TOP2A (cycling stroma), PCOLCE (fibroblasts) and MCAM (SMCs) (Fig. 3h). HIF1A, RUNX1, ITGA2 and CD44 were also visualized (Extended Data Fig. 6).
In summary, we defined and spatially localized the stromal subpopulations in the PCOS-endometrium and identified a reduced proportion of stromal cells, suggesting slower proliferation. We observed distinct DEG patterns associated with endometrial cancer, as well as endometrial receptivity and implantation failure. Metformin and lifestyle management restored pathways associated with collagen metabolism and ECM organization, particularly in fibroblasts and SMCs, reflecting treatment-specific improvements in PCOS-specific endometrial dysfunction.
PCOS endometrial immune and endothelial cell alterations
PCOS is linked to low-grade inflammation3 and a dysfunctional immune microenvironment, which is, in turn, associated with impaired endometrial receptivity5,10,36. In a mouse model of PCOS, hyperandrogenism increased uterine natural killer (uNK) cell frequency, an effect that was reversed by AR antagonists37. We characterized 13,596 endometrial immune cells, identifying three uNK populations (uNK1, uNK2 and uNK3), two uterine macrophage populations (uM1 and uM2), regulatory T cells, CD8+ and CD4+ T cells, B cells, dendritic cells (DC1 and DC2) and mast cells. Despite these findings, immune subpopulation proportions did not differ between women with and women without PCOS (Fig. 4a,c and Extended Data Fig. 3a–d).
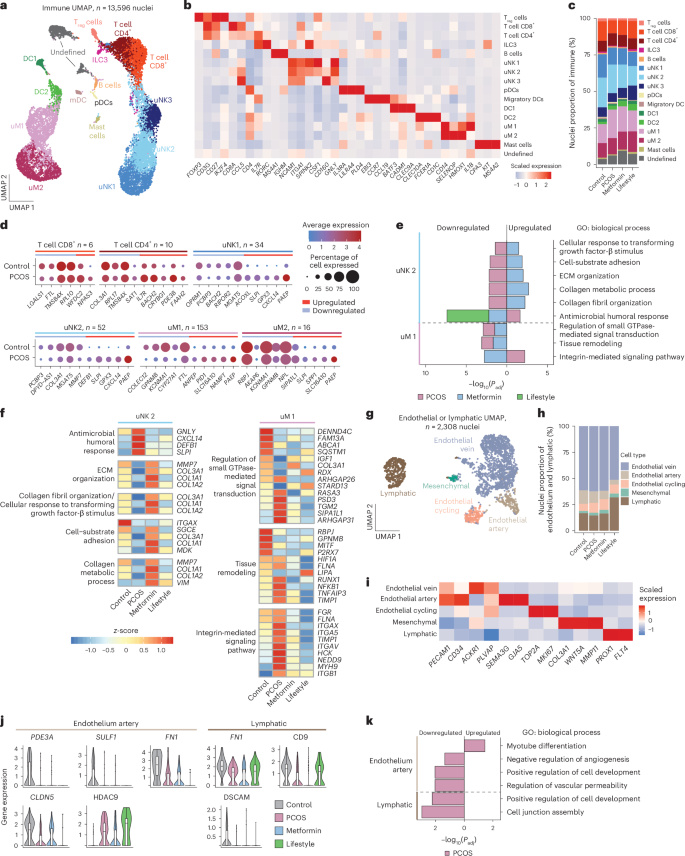
a, UMAP of subclustered immune cells (n = 13,596) from all individuals (n = 27). b, Heatmap of scaled log(transformed) gene expression characterizing 15 immune subclusters. c, Bar plot showing the proportion of the 15 immune subclusters from control (n = 5), PCOS (n = 12), PCOS-metformin (n = 7) and PCOS-lifestyle (n = 3) groups. d, Total number of DEGs in the six immune subclusters and dotplots of the top five up- and downregulated DEGs (control versus PCOS) in these immune subclusters. e, GO enrichment analyses on DEGs split on up- or downregulation, within six immune subclusters at baseline between PCOS and controls, and between PCOS-baseline and after 16 weeks of intervention with metformin or lifestyle, respectively. GOs with BH-adjusted P < 0.05 are reported and −log10(transformed) for visualization. f, Heatmap showing DEGs in GOs between controls and cases of PCOS and those that are reversed by metformin or lifestyle intervention. g, UMAP of subclustered endothelial or lymphatic cells from all individuals. h, Bar plot showing the proportion of the five endothelial or lymphatic subclusters from control (n = 5), PCOS (n = 12), PCOS-metformin (n = 7) and PCOS-lifestyle (n = 3) cases. i, Heatmap of scaled log(transformed) gene expression characterizing the five endothelial or lymphatic subclusters. j, Violin plot showing DEGs in GOs between PCOS cases and controls, and between PCOS-baseline and after 16 weeks of intervention with metformin or lifestyle, respectively. The line inside the box indicates the median value and the box delimits the 25th and 75th percentiles. The smallest and largest values are indicated by the lines outside the box. k, GO enrichment analyses on DEGs split on up- or downregulation, within endothelial artery and lymphatic subclusters at baseline between control and PCOS cases and between PCOS-baseline and after 16 weeks of intervention with metformin or lifestyle, respectively. GOs with BH FDR P < 0.05 are reported and −log10(transformed) for visualization. See ‘Statistical analyses’ for a detailed description of DEG analysis and GO enrichment analysis statistics.
Source data
The largest immune subpopulations with the most DEGs were uNK1 (n = 34), uNK2 (n = 52) and uM1 (n = 153) (Fig. 4d and Supplementary Table 2a–c), with no difference between induced and noninduced bleeding samples (Extended Data Fig. 4e,f). These cells, active during the menstrual and proliferative phases, are crucial for wound healing and endometrial regrowth, processes impaired in PCOS38. Key genes elevated in uNK1, uNK2 and uM2 include GPX3, linked to embryo quality39, and SLPI, CXCL14, PAEP and NAMPT, important for endometrial receptivity13,36 (Fig. 4d). Remarkably, metformin reversed PAEP expression and partially by lifestyle (Extended Data Fig. 2c). Moreover, PAEP expression was projected to immune annotated clusters in the Stereo-seq data, confirming its expression (Extended Data Fig. 2d).
GO analysis revealed pathway enrichment in uNK2 and uM1, with most uNK2 pathways downregulated in PCOS but restored after 16 weeks of metformin, but to a less extent by lifestyle (Fig. 4e,f and Supplementary Table 3a–c). Metformin also normalized ECM- and collagen-related genes (COL1A1, COL1A2, COL3A1 and MMP7) in uNK2 and integrin-mediated pathways in uM2 (Fig. 4e,f).
In the PCOS-endometrium, the smallest subcluster, endothelial or lymphatic (2,308 nuclei) (Fig. 4g–i), showed downregulation of PDE3A, SULF1, FN1 and CLDN5 in an endothelial artery subcluster and FN1, CD9 and DSCAM in lymphatic cells, with upregulation of HDAC9 in the endothelial artery subcluster (Fig. 4j, Supplementary Table 2a–c and Extended Data Fig. 4g,h). These changes were unaffected by interventions. GO analysis highlights pathways in cell development and junction assembly in lymphatic cells (Fig. 4k and Supplementary Table 3a–c).
Among immune subpopulations, uNK1, uNK2 and uM1 were most impacted in the PCOS-endometrium. Dysregulated pathways involve collagen metabolism, ECM organization and integrin signaling. ECM- and collagen-related genes are downregulated in uNK2, whereas integrin signaling genes are upregulated in uM1, with both responsive to metformin treatment.
Cell–cell interactions in the PCOS-endometrium
SnRNA-seq and Stereo-seq data reveal distinct dysregulated genes and biological processes in epithelial, stromal and immune subpopulations of the PCOS-endometrium. Intercellular communication within and between subpopulations is critical for endometrial response to hormonal imbalance16. Using CellChat, we analyzed cell-to-cell ligand–receptor interactions among subpopulations. The interaction probability, signaling pathways and ligand–receptor pairs are detailed in Supplementary Table 4a–e.
In the PCOS-endometrium, the stroma 1 subpopulation exhibited dominant interaction strength with SOX9+ cycling, SOX9+LGR5+, SOX9+LGR5− and luminal subpopulations. These interactions were unaffected by metformin and lifestyle interventions (Extended Data Fig. 7a–c).
Next, analysis of ligand–receptor genes in the different subpopulations revealed that the strongest interactions in the PCOS-endometrium involved ECM components, including collagen, laminin and fibronectin 1 (FN1) pathways, aligning with DEGs in major subpopulations (Fig. 5a,b, Extended Data Fig. 8a and Supplementary Table 4a–e).
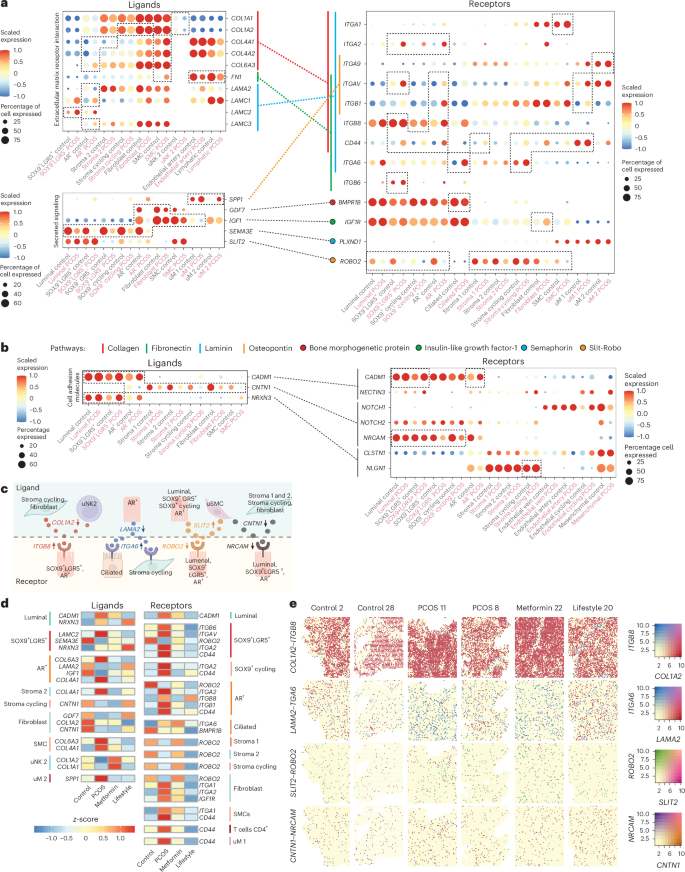
Dotplots of genes encoding ligands and receptors of CellChat-predicted interactions and signaling pathways in different cell subpopulations. a, The ligand dotplots refering to signaling pathways annotated as ECM–receptor interaction or associated secreted signaling. The dashed and filled lines indicate which ligand–receptor pars interact on the y axis. The colors are explained in the pathway legend. The dashed boxes indicate DEGs (MAST model in Seurat) and cell subpopulations on the x axis. All dots are scaled on the average log(transformed) expression indicated by the color and the size of the dot shows the percentage of cells expressing the gene. b, Dotplot of genes encoding ligand–receptor pairs annotated as cell adhesion molecules by CellChat. c, Illustration of selected cell subpopulation and specific receptors and ligands. The arrows indicate whether the encoding genes are up- or downregulated in PCOS. d, Heatmap of genes encoding ligands and receptors that are reversed after metformin or lifestyle treatment compared with PCOS. The colored bars on the side of the heatmap indicate to which cell subpopulations the genes belong. The colors of the blocks in the heatmap represent the z-score, that is, a scaled average of log(transformed) gene expression. e, Spatial distribution and gene expression of selected interacting ligand and receptor genes from the CellChat analysis in Fig. 6a,b. The color bar indicates the coexpression level of the genes. Schematic in c created using BioRender.com.
Key findings in the PCOS-endometrium include downregulation of collagen ligands COL1A1 in uNK2 and COL1A2 in proliferative stroma, fibroblasts and uNK2, whereas COL4A1, COL4A2 and COL6A3 are upregulated in AR+ epithelium, stroma 2 and SMCs (Fig. 5a and Supplementary Table 4a–e). Collagen ligands interact with upregulated integrin-encoding genes, such as ITGA1 in SMCs, ITGA2 in SOX9+LGR5+, SOX9+ cycling and AR+ and ITGAV and ITGB1 in AR+ and uM1. CD44 was expressed across epithelial and stromal subclusters, except luminal, ciliated, stroma 2 and uM2 (Fig. 5a,d and Supplementary Table 4a–e). This interaction supports the activation of ECM signaling pathways, potentially driving the increased epithelial cell proportion in the PCOS-endometrium through enhanced proliferation.
FN1 is downregulated in SMCs, endothelial arterial and lymphatic cells, whereas LAMA2 is downregulated in AR+ epithelial cells. In contrast, LAMC1 and LAMC3 are upregulated in AR+ cells and LAMC2 in SOX9+LGR5+ cells. These FN1 and laminin ligands interact with the same integrin-encoding genes as collagen ligands (Fig. 5a and Supplementary Table 4a–e).
In the secretory signaling pathways, SPP1 (osteopontin) is upregulated in uM1 and uM2 in the PCOS-endometrium, forming ligand–receptor pairs with ITGA9 (upregulated in uM2), ITGAV (in SOX9+LGR5+, AR+ and uM1) and ITGB1 (in AR+ and uM1) (Fig. 5b and Supplementary Table 4a–e). GDF7 is downregulated in AR+ and fibroblast cells, interacting with the BMPR1B receptor, which is downregulated in ciliated cells. IGF1 is downregulated in AR+, fibroblasts, SMCs and uM1 cells, interacting with IGF1R. SEMA3E, downregulated across epithelial subpopulations, interacts with PLXND1, the expression of which remains unchanged. In the Slit-Robo pathway, only the ROBO2 receptor is downregulated in epithelial and stromal subpopulations (Fig. 5b–d and Supplementary Table 4a–e).
Cell adhesion molecule-related signaling pathways including CADM1, acting as both ligand and receptor, are upregulated in luminal, SOX9+LGR5+ and AR+ epithelial cells and interact with NECTIN3, which is not differentially expressed (Fig. 5c and Supplementary Table 4a–e). CNTN1, downregulated in AR+ and stromal subpopulations, interacts with NOTCH1-2 and NRCAM receptors, the latter showing differential expression in epithelial subpopulations except AR+ (Fig. 5c,d). NRXN3, upregulated in luminal and SOX9+LGR5+, interacts with CLSTN1 and NLGN1, with the latter elevated in proliferative stroma in PCOS.
Importantly, many DEGs encoding ligands and receptors are among the top-ranked genes in PCOS versus controls (Figs. 2–4). Comparison of CellChat DEGs with treatment-responsive genes revealed significant changes in collagen, integrin, CD44 and ROBO2 expression, which was further validated by Stereo-seq data (Fig. 5d,e and Extended Data Fig. 6).
Our analysis uncovers key dysregulations on integrin receptors activated by collagen, fibronectin 1 and laminin in SOX9+LGR5+, AR+ epithelial cells and uM1 and uM2 subpopulations in the PCOS-endometrium. Despite their key role in menstrual endometrium40, integrins in PCOS remain underexplored. These adhesion molecules, capable of bidirectional signaling in response to extracellular changes, may represent therapeutic targets for endometrial dysfunction27 (Extended Data Fig. 8b).
Endometrial cell types and human diseases
PCOS is associated with a variety of reproductive and metabolic diseases3. Genome-wide association studies (GWASs) have suggested a link between PCOS and bioavailable testosterone, endometrial cancer and endometriosis41. In addition, PCOS shares genetic loci with T2D, fasting insulin and glucose, as well as BMI-adjusted waist:hip ratio (WHR)42. Using CELLEX and CELLECT, we integrated snRNA-seq data with GWASs to identify endometrial cell types mediating these associations.
PCOS GWASs showed a significant association with ciliated epithelial cells, whereas endometriosis GWASs were linked to plasmacytoid dendritic cells (pDCs). Stromal subpopulations, except proliferative stroma, were strongly associated with BMI-adjusted WHR. In addition, uNK2 and uNK3 associated with 2-h glucose-level GWASs and fasting insulin GWASs were associated with stroma 1, stroma 2, fibroblasts, proliferative endothelial cells and type 3 innate lymphoid cells (ILC3 cells) (Fig. 6a,b and Supplementary Table 5a–d).
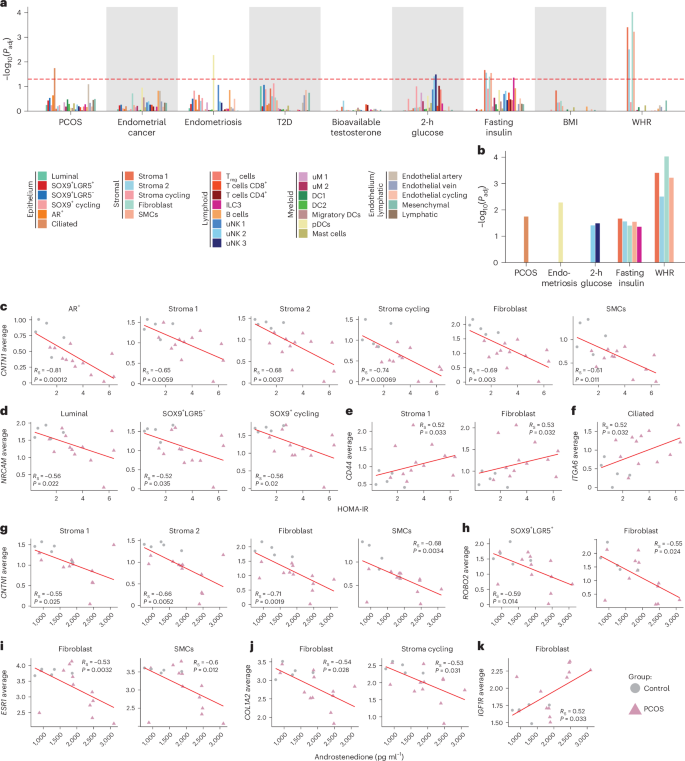
a, CELLECT analysis of the association between cell types in human endometrial snRNA-seq data (PCOS + controls) with GWASs. The red dashed line outlines the −log10(transformed) Bonferroni’s adjusted P = 0.05. The colors of the bars indicate the subclusters listed in the legend. Fasting insulin, 2-h glucose, T2D and WHR were BMI adjusted. Subclusters with a higher adjusted −log10(P) than the red dashed line indicate significant enrichment. b, A magnification of GWASs and subclusters identified as significantly enriched by CELLECT analysis. The exact adjusted P values (a and b) can be found in Supplementary Table 5b. c, Spearman’s correlation of averaged gene expression of DEGs per subcluster. CNTNT1 is negatively correlated with HOMA-IR in epithelial and stromal subpopulations. d, NRCAM1 negatively correlated with HOMA-IR in epithelial subpopulations. e,f, CD44 (e) and ITGA6 (f) positively correlated with HOMA-IR in stromal subpopulations. g, CNTNT1 negatively correlated with androstenedione in stromal subpopulations. h, ROBO2 negatively correlated with androstenedione in epithelial subpopulations. i,j, ESR1 (i) and COL1A2 (j) negatively correlated with androstenedione in stromal subpopulations. k, IGFR1 positively correlated with androstenedione in stromal subpopulations. See ‘Statistical analyses’ for a detailed description of Spearman’s correlations. RS, Spearman’s rank correlation.
To investigate the relationship between calculated averaged gene expression of DEGs per cell type and PCOS clinical traits, correlation analyses were performed across cell types at baseline including all women (Supplementary Table 6). CNTN1, downregulated in AR+ and stromal subpopulations in PCOS, negatively correlated with HOMA-IR and androstenedione in stromal cells (Fig. 6c,g). NRCAM, the CNTN1 receptor, inversely correlated with HOMA-IR in epithelial subpopulations (Fig. 6d). CD44 and ITGA6 showed positive correlations with HOMA-IR in stroma 1, fibroblasts and ciliated epithelial cells (Fig. 6e,f). ROBO2, ESR1 and COL1A2 inversely correlated with androstenedione in epithelial and stromal subpopulations, whereas IGF1R was positively associated in fibroblasts (Fig. 6h–k).
Together these findings suggest that hyperandrogenism and insulin resistance predominantly affect epithelial subclusters (AR+, SOX9+LGR5+, SOX9+LGR5−, SOX9+ cycling) and stromal subclusters (stroma 1, stroma 2, stroma cycling, fibroblasts), contributing to the risk of endometrial dysfunction in women with PCOS.
Discussion
PCOS affects millions globally, reducing endometrial receptivity43, increasing miscarriage risk and elevating endometrial cancer susceptibility3,44. However, its cellular and molecular heterogeneity and treatment responses remain unclear. In the present study, we present the most comprehensive proliferative-phase endometrial atlas in overweight, hyperandrogenic, insulin-resistant women with PCOS and controls of similar age, weight and BMI, and post 16-week first-line treatment effects in PCOS by analyzing ~250,000 nuclei. We defined cell-type-specific molecular signatures and altered cellular composition and spatial localization of PCOS-specific cells. Distinct disease-specific signatures partially recover with metformin and lifestyle management. The present PCOS-endometrial cell atlas (PECA) study advances consensus-based cell annotation13,14,16 and provides a foundation for future single-cell PCOS endometrial research.
The increased endometrial disease risk in PCOS arises from altered sex steroid profiles, particularly hyperandrogenism3. Elevated testosterone leads to follicular arrest and chronic anovulation, causing unopposed estrogen exposure3,4, which promotes endometrial proliferation and elevates hyperplasia and cancer risk45. Insulin resistance and hyperinsulinemia further exacerbate this via direct mitogenic effects3. Obesity, affecting >50% of patients with PCOS, independently increases cancer risk46 by enhancing androgen production and peripheral estrogen conversion47. Aberrant endometrial gene expression suggests intrinsic dysfunctions linked to reduced receptivity, miscarriages and poor pregnancy outcomes5,10,43,48,49, although specific cellular contributions remain unclear.
The present study examined transcriptional and compositional differences in the proliferative PCOS and control endometrium. Patients with PCOS were hyperandrogenic, had elevated luteinizing hormone (LH) levels and were insulin resistant, with no age, weight or BMI differences from controls. Notably, the PCOS-endometrium had more epithelial cells and fewer stromal and lymphoid cells, despite synchronized biopsy collection and no evidence of hyperplasia. Although gene expression changed, these cellular differences persisted post 16-week metformin or lifestyle intervention. An increased epithelial:stromal ratio may contribute to the fivefold higher endometrial cancer risk in PCOS50.
We identified robust transcriptomic differences in PCOS endometrial, epithelial and stromal subclusters, with upregulated genes involved in cell adhesion, ECM and integrin signaling (ITGAV, ITGA2, ITGA3, ITGB6, ITGB8, CD44 and ADAMTS9), particularly in SOX9+LGR5+ and AR+ subclusters. Notably, ITGA2 and ITGA3, linked to endometrial cancer24, suggest integrin inhibitors as potential therapies40. These changes probably drive increased proliferation, reduced differentiation of epithelial cells and heightened cancer risk. The less differentiated epithelial phenotype in endometrial cancer and endometriosis, marked by SOX9+LGR5+ and SOX9+LGR5− signatures4, aligns with our PCOS findings.
Sex hormone fluctuations regulate endometrial growth, degeneration and immune responses, shaping local immune populations. In the PCOS-endometrium, uNK2 and uM1 subpopulations are most affected, with elevated PAEP, linked to pregnancy loss and implantation failure13,20, and SLPI, CXCL14 and NAMPT associated with endometrial cancer13,23. These findings highlight specific immune subpopulations as key players in PCOS pathophysiology and potential therapeutic targets.
Cell-type-specific differential gene expression correlates with clinical PCOS features, including HOMA-IR and androstenedione, suggesting that hyperandrogenism and insulin resistance contribute to endometrial dysfunction. GWASs suggest that epithelial cells influence PCOS risk, whereas stromal cells impact hyperinsulinemia and WHR. However, CELLECT findings require cautious interpretation because they identify cell populations enriching GWAS signals rather than effector genes51.
Ligand–receptor analysis, supported by Stereo-seq, reveals unique epithelial–stromal and uNK2 and uM1 immune subpopulation interactions in the PCOS-endometrium. In PCOS, epithelial subclusters activate COLLAGEN, LAMININ, cell adhesion molecule (CADM) and protein tyrosine phosphatase receptor type M (PTPRM) pathways, whereas stromal subclusters engage PTPR, insulin-like growth factor (IGF), adhesion G protein-coupled receptor L (ADGRL) and SLIT. In contrast, immune subclusters show downregulation of cholesterol, FN1, PTPRM, CD45 and COLLAGEN pathways. critical for ECM turnover, and mediate collagen uptake and degradation while producing collagens for tissue remodeling52, reflecting PCOS-related dysregulation.
Spatiotemporal single-nuclei analysis of the PCOS-endometrium reveals that 16 weeks of metformin and lifestyle management reverse many dysregulated genes, particularly in epithelial SOX9+LGR5+ and AR+ cells, stromal fibroblasts, SMCs and uNK2 and uM2 subpopulations. Metformin, a hydrophilic compound53, acts via mitochondria activating AMP-activated protein kinase (AMPK), mammalian target of rapamycin (mTOR) and GLUT4 to inhibit gluconeogenesis54. Beyond insulin sensitization, in vitro studies suggest antiproliferative and anti-metastatic effects in estrogen-dependent, endometrial carcinoma-like cells55,56,57. Notably, metformin reduced testosterone, androstenedione and free androgen index (FAI), but not HOMA-IR, suggesting that hyperandrogenism and/or hyperinsulinemia drive cell-specific molecular changes. These findings highlight metformin’s role in targeting integrin signaling and dysregulated pathways to improve endometrial health in PCOS.
Our data reveal a distinct disease-specific transcriptomic profile in epithelial, stromal, immune and endothelial subclusters of the PCOS-endometrium. Despite uniform proliferative-phase biopsies and similar age, weight and BMI between groups, large-scale profiling across all menstrual phases is needed. Notably, Provera-induced and noninduced bleeding showed no differences in nuclei proportions or subclustering.
This single-cell transcriptomic atlas of the PCOS-endometrium (PECA) provides a valuable resource for understanding PCOS-associated endometrial diseases, including cancer. The present study is unique in that it includes detailed and standardized phenotyping, which we link to the transcriptomic profile of specific endometrial cell types in the PCOS-endometrium. These results open new therapeutic targets, such as integrin inhibitors, and underscore the therapeutic role of metformin in modulating cell-type-specific endometrial dysfunction for endometrial health in women with PCOS.
Methods
Participants and interventions
The study adheres to good clinical practice and follows the Declaration of Helsinki. Approval has been granted by the Regional Ethical Review Board of Stockholm, Sweden (Dnr: 2015/1656-31/2 with amendment Dnr: 2024-00633-02) and is approved by the Medical Products Agency (EUCT: 2024-514505-64-00) and registered at Clinicaltrials.gov (NCT02647827). The women were recruited via online advertisements and examined at the Women’s Health Research Unit at the Karolinska University Hospital, Stockholm. Before any assessments, women received oral and written information and provided written informed consent. All women included in the study were aged ≥18 to ≤40 years with a BMI ≥ 25. PCOS diagnosis was set according to the revised 2003 Rotterdam criteria, excluding any endocrine-related disorder58. Transvaginal ultrasound measured the number of antral follicles (2–9 mm), ovarian volume (>10 cm3) and endometrial thickness (mm). Women with PCOS had irregular menstrual cycles >35 d. The Ferriman–Gallwey score was used to assess hirsutism with a score >4 considered as clinical hyperandrogenism. The control participants did not differ from PCOS in terms of age, weight and BMI. In addition, controls had <12 antral follicles (2–9 mm), an ovarian volume <10 cm3, regular menstrual cycles (±28 d) and a Ferriman–Gallwey score ≤4. Both women with and women without PCOS had no other gynecological diseases (for example, uterine fibroids, endometriosis), were neither pregnant nor breastfeeding in the last 6 months and were not taking any medication or hormonal treatment, including oral contraceptives, for at least 3 months before the baseline examinations, except for some women who took Provera 10 mg for 7 d to induce bleeding.
Serum analyses included sex steroids: DHEA, androstenedione, testosterone, estradiol and progesterone measured by gas chromatography–tandem mass spectroscopy59. All other hormones were analyzed at a Karolinska University Hospital-accredited laboratory by the following methods: LH and follicle-stimulating hormone (FSH) with electrochemiluminescence, Elecsys LH and FSH, respectively, and sex hormone-binding globulin by Roche Diagnostics analyzed on Cobas 8000 (Roche Diagnostics Scandinavia AB).
Endometrial tissue office biopsies were collected under local anesthesia using an endometrial suction curette (Pipet Curet, CooperSurgical) in the morning after an overnight fast on days 6–8 of a spontaneous period or after an induced withdrawal bleeding to assure that there was no variation caused by the menstrual cycle. One part of each biopsy was snap frozen in liquid nitrogen and stored at −80 °C and one small piece was fixed in 4% paraformaldehyde for histology. After screening and baseline measures, women with PCOS were randomly assigned to one of three groups using our online electronic case report form: (1) lifestyle management alone; (2) metformin + lifestyle; or (3) electroacupuncture + lifestyle, for 16 weeks. In short, all participants received information on lifestyle management. This included an initial counseling session in which they were informed about the importance of weight management, healthy eating and physical activity. All participants received a book with lifestyle advice and received a weekly text message reporting their steps over the previous week and whether they had menstrual bleeding. The metformin group received 500 mg orally, 3× a day for 16 weeks. The dose was increased from 500 mg d−1 in week 1 to 1,000 mg d−1 in week 2 to the full dose in week 3. Blinding or masking of the intervention was not possible because of the nature of the intervention. Importantly, the assessors were blinded to the patient’s group assignment. For details of interventions, see the published study protocol60. In brief, all women received lifestyle management instructions, oral metformin 500 mg 3× daily, in total 1,500 mg d−1. Treatment started after baseline measurements, which were repeated after 16 weeks of treatment and snRNA-seq and spatial Stereo-seq were carried out on endometrial tissue biopsies successfully collected at baseline and after 16 weeks of intervention in (1) the lifestyle management alone and (2) the metformin + lifestyle groups.
Staining and imaging
The fixed endometrial tissue was used to perform immunofluorescence staining of estrogen receptor-α (ER-α). After fixation, the tissues underwent dehydration and were thereafter embedded in paraffin. The paraffin-embedded endometrium was sectioned in 8-mm-thick slices, which were treated with sodium citrate buffer, pH 6.0, for antigen retrieval. After blocking by 5% bovine serum albumin in phosphate-buffered saline (PBS), the sections were incubated with ER-α (rabbit monoclonal, Abcam EPR4097, cat. no. ab108398, lot GR3371387-3, stock 1.009 mg ml−1) and EPCAM (mouse monoclonal, Cell Signaling Technology, cat. no. VU-1D9, lot 9) primary antibodies overnight at 4 °C. Then they were incubated with Alexa Fluor-488 (green, Invitrogen, donkey anti-rabbit, cat. no. A21206) and -594 (red, Invitrogen, donkey anti-mouse, cat. no. A21203) conjugated secondary antibodies at 37 °C for 1 h. The sections were then stained with DAPI (Thermo Fisher Scientific, cat. no. 62248) for 5 min. The fluorescent images were taken with an LSM 900 confocal microscope ×63 water (Zeiss). The isotype control images for ER-α were done in the same manner but with the rabbit immunoglobulin G isotype control antibody (Abcam EPR25A, cat. no. ab172730, 1.649 mg ml−1) instead of the primary ER-α antibody.
Hematoxylin and eosin (H&E) staining was performed on cryosections made in preparation for spatial transcriptomics. We used the section right before the one used for spatial transcriptomics for all samples besides 031 Baseline, where we used the section that is two after the one used for spatial. Briefly, cryosections were cleared with xylene and rehydrated with ethanol and water, to then be stained with hematoxylin (Dako, cat. no. S3309) for 15 s, washed with tap water until clear and stained with eosin (1:6 dilution, Sigma-Aldrich, cat. no. HT110216) for 10 s. The sections were then submerged in reversed order back to xylene and mounted with Pertex Mounting Media (Histolab Products AB) and covered with a coverslip. The sections were left to dry for 24 h before imaging with an Olympus IX73 widefield inverted microscope by stitching together brightfield images from ×10 magnification.
Nuclei extraction of frozen endometrial biopsies
Nuclei isolation of snap-frozen endometrial biopsies was modified according to the published tissue in salt tween (TST) method61. On ice, a piece of sample (4 × 4 mm2) was placed on a precooled Petri dish and chopped with a knife into smaller pieces. The tissue pieces were transferred into a douncer with 1 ml of TST buffer and homogenized 5× with a loose pestle, followed by 8–10× with a tight pestle. The homogenized solution was filtered through a 100-µm filter into a 2-ml tube, followed by filtering of the homogenized solution through a 20-µm filter into a 15-ml tube. An additional 1 ml of TST buffer was used to wash the douncer and the 100-µm and 20-µm filters. An additional 3 ml of 1× ST buffer was added to reach a volume of 5 ml and followed by centrifugation at 4 °C, 300g for 4 min. The 4 ml of supernatant was carefully filtered through a 20-µm filter to a new 15-ml tube, followed by centrifugation at 4 °C, 500g for 5 min. Thereafter the supernatant was carefully discarded and the pellet was resuspended in 50 µl of nonspecific binding (NSB) buffer and filtered through a 20-µm filter. An additional 50 µl of NSB buffer was added to wash the tube and the filter.
SnRNA-seq library preparation and sequencing
Following the manufacturer’s protocol, snRNA-seq libraries from isolated nuclei were generated utilizing the Chromium Next GEM Single Cell 3′ Gel Bead Kit (Dual Index) v.3.1 (10x Genomics) and Chromium Next GEM Chip G Single Cell with the goal of capturing 10,000 nuclei per reaction. Library qualities were verified using a 2100 Bioanalyzer (Agilent 4200 TapeStation). Sequencing was performed on the Illumina NovaSeq6000 system at Novogene, with the objective of achieving an average coverage of 25,000 raw reads per nucleus (Supplementary Table 1c). As a result of the inherent challenge in capturing neutrophils using the office biopsies and 10x Genomics platform, the cell type was not captured.
Tissue preparation for spatial transcriptomics with Stereo-seq
A tissue block with an edge length of <1 cm was rinsed with cold PBS and then embedded in precooled OCT (Sakura) using dry ice for setting of OCT. Three to four serial cryosections of 10-µm thickness were cut from the OCT-embedded samples for H&E staining and Stereo-seq library preparation. Brightfield images of the H&E samples were acquired using a Motic microscope scanner for histopathological evaluation.
Quality control of RNA from OCT-embedded samples
From each OCT-embedded sample, 100- to 200-µm-thick sections were cut for extraction of total RNA using the RNeasy Mini Kit (QIAGEN) according to the manufacturer’s protocol. The RNA integrity number (RIN) was determined using the Bioanalyzer (Agilent 4200 TapeStation). Samples that qualified for the transcriptomic study had a RIN between 7.3 and 8.0.
Stereo-seq library preparation and sequencing
The spatial transcriptomic RNA library was prepared using Stereo-seq chips (BGI Research) with an area of 1 cm2. The capture spots had a diameter of 220 nm and a center-to-center distance of 500 nm. Each Stereo-seq capture probe contained a 25-bp coordinate identity barcode, a 10-bp molecular identity barcode and a 22-bp poly(T) tail for in situ messenger RNA capture. A 10-µm cryosection from the OCT-embedded tissue was quickly placed on the chip, incubated at 37 °C for 5 min and then fixed in precooled methanol at −20 °C for 30 min. The fixed tissue sections were stained with Qubit single-stranded DNA dye (Thermo Fisher Scientific) to obtain the nuclei location information. Tissue sections were permeabilized for 6 min at 37 °C in 100 μl of 0.1% pepsin in 0.01 mol l−1 of HCl buffer, followed by a wash with 0.1× saline-sodium citrate supplemented with 0.05 U μl−1 of RNase inhibitor. The RNA released from the permeabilized tissue was captured in situ by capture oligo-probes and was reverse transcribed at 42 °C for 3 h. The tissue sections were then digested with a tissue removal buffer at 55 °C for 10 min. The complementary DNA-containing chip was incubated overnight at 55 °C in 400 μl of cDNA release buffer. The released cDNA was further purified and amplified using cDNA amplification primer. Approximately 20 ng of cDNA was fragmented, amplified and purified to generate each sequencing library. Sequencing was performed using the pair-end 50 + 100 bp strategy on an MGI DNBSEQ-Tx sequencer.
Endometrium snRNA-seq analysis
The raw sequencing reads from the FASTQ files were aligned to a reference transcriptome (GRCh38-2020-A) including introns using Cell Ranger Software (v.6.1.1). Filtered reads from Cell Ranger were transformed into Seurat object for initial quality control with Seurat (v.4) and processed individually to remove low-quality nuclei. Nuclei with <500 genes, >10% mitochondrial reads, >5% ribosomal reads and >1% hemoglobin reads were filtered out and genes expressed in <3 nuclei were removed. Duplicates and multiples were removed with scDblFinder (v.1.18). The filtered Seurat objects were integrated using the sctransform method v.2.0 from the Satija lab62. Seurat’s SelectIntegrationFeatures with 2,500 features and FindIntegrationAnchors with the default settings were used to identify anchors to integrate the samples. Integration was performed using IntegrateData and sctransform as the normalization method and used for clustering with uniform manifold approximation and projection (UMAP). After clustering with sctransform, the count matrix was normalized and transformed using Seurat log(normalize).
Cell-type annotation and subclustering
Cell-type annotation was performed manually by comparing marker gene expression with previous published work and applying FindAllMarkers to sctransform clusters to examine the most highly expressed genes in each cluster. The seven main cell-type clusters epithelial, stromal, SMCs, immune including lymphoid and myeloid cells, endothelial and lymphatic cells were further subdivided from the main Seurat object and reintegrated using the sctransform method as described above. Epithelial, stromal and endothelial cells were manually annotated, whereas immune cells were manually annotated and validated using SingleR (v.2.6) and the Monaco immune data as a reference dataset. Sctransform was applied to subcluster PCOS induced and noninduced per main cell type.
Differential gene expression analysis and GO enrichment analysis of snRNA-seq
DEGs were identified pairwise by applying FindMarkers and the MAST method63 (v.1.3) at baseline comparing the control group with the PCOS group, and the effect of intervention by comparing the PCOS-baseline with the PCOS-metformin group and the PCOS-lifestyle group, respectively. The identified DEGs were categorized into two groups based on whether gene expression was up- or downregulated and on a positive or negative log2(fold-change) (log2(FC)) before importing them into the clusterProfiler package (v.4.12.2) to perform a functional enrichment analysis of the biological process ontology with enrichR (v.3.2) using the compareCluster function. This generated two sets of GO output tables with either up- or downregulated GOs per comparison and cellular subpopulation. The GO tables from the different comparisons and cell types were merged and manually curated to identify GO terms relevant to PCOS and endometrium and to identify GO terms that reverse after treatment.
CellChat: snRNA-seq cell–cell communication analysis
Cell–cell communication analysis was performed using CellChat (v.2.1.2)64 with NMF (v.0.27) and reticulate (v.1.38). All identified subclusters of the epithelium, stroma, immune system and endothelium or lymphatic system were projected on to the original Seurat object of all cell nuclei. CellChat objects with the group labels control and PCOS-baseline, as well as metformin and lifestyle treatment, were generated from the Seurat object and the log(normalized) RNA matrix. In this way, four CellChat objects were generated, which were processed individually before being merged into three groups for comparisons: (1) control versus PCOS at baseline; (2) PCOS: baseline versus 16 weeks of metformin; and (3) PCOS: baseline versus 16 weeks of lifestyle. Up- and downregulated genes were identified using default settings (percentage expression >25%, log(FC) > 0.5, adjusted P < 0.05) before prediction of ligand–receptor interactions using CellChatDB human. Communication probabilities were calculated using computeCommunProb with population.size to account for cell clusters of different sizes, followed by the computeCommunPropPathway to predict signaling pathways and the relative strength of these pathways based on predicted strength. Based on predicted ligand and receptor expression, information flow was mapped and labeled as either outgoing signaling indicative of ligand expression or incoming signaling indicative of receptor expression. Taken together, CellChat enabled the prediction of which cell subpopulations interact based on the ligand and receptor expression predicted from the gene expression data and to which signaling pathways the interactions belong. The individual CellChat objects were merged to facilitate comparison of the communication probabilities of cell-type interactions between the groups. In this way, it was possible to investigate how the relative strength of ligand–receptor interactions differed between cell types in the groups. The results obtained showed both shared pathways between the groups and pathways that were not shared, suggesting that pathways are up- or downregulated in PCOS and whether treatment affects them. Genes encoding the ligand–receptor pairs with predicted interaction were extracted and used to visualize the interaction. When comparing the relative strength of interactions between cases and controls, only ligand–receptor pairs and pathways with identified DEGs were considered by MAST-based DEG analysis. DEGs were further filtered by comparing them with DEGs found in PCOS versus metformin and PCOS versus lifestyle to discover ligand and receptor treatment-responsive genes.
Endometrium Stereo-seq analysis
Stereo-seq Analysis Workflow (SAW) (v.5.5.3) and anndata (v.0.7.5.6) were utilized to process the raw data generated from Stereo-seq, including the FASTQ and mask file storing the coordinate ID of the chips65. Stereopy (v.1.1.0) was used to bin the data to bin30 and generated gene expression matrices were converted to Seurat objects for further downstream processing and harmonization with the existent snRNA-seq dataset. The data were filtered to remove bins with >20% mitochondrial reads, >5% ribosomal reads, >1% hemoglobin reads, genes expressed in <3 bins and bins expressing >250 or <10,000 mapped reads. The data were normalized using both sctransform and log(normalization), of which sctransform was used only for clustering the data. The clusters were annotated using the snRNA-seq dataset with the major cell-type annotation as a reference, of which the spatial dataset was projected on to using the Seurat unimodal UMAP projection MapQuery. The annotated spatial object was filtered to include only bins with a prediction score >0.5. The annotation of the spatial object was used as a guide when identifying regions of the spatial object, including both epithelial and stroma cell types on which to project gene marker expression.
Candidate etiological cell types via CELLEX and CELLECT
GWAS summary statistics for nine given traits (Supplementary Table 5a) and cell-type expression specificity estimates derived from our snRNA-seq data are the input data for CELLECT (v.1.3)51. The output is a list of candidate etiological cell types for a given trait. CELLEX (v.1.2.2) calculates robust estimates of expression specificity and was run separately on the control and PCOS snRNA-seq gene expression matrices and on the combined (PCOS + control) matrices to calculate gene expression specificities for each subcell type. The cell-type specificity matrix was used together with GWASs as input for CELLECT–MAGMA covariate analyses using default parameters.
Statistical analyses
Statistical analyses of the clinical variables were performed in IBM SPSS Statistics v.29.0.2.0 or R v.4.4.0. To examine differences in nuclei proportion, first the Kolmogorov–Smirnov and Shapiro–Wilk tests were used to check the data distribution. As most of the data were not normally distributed, the nonparametric, two-sided Mann–Whitney U-test was used for comparisons between women with and women without PCOS at baseline and the two-sided Wilcoxon’s signed-rank test was used to investigate changes from baseline to after 16 weeks of intervention (metformin and lifestyle, respectively) in women with PCOS. To correct for multiple testing, Benjamini–Hochberg (BH)-adjusted P < 0.05 was used to determine whether the difference was significant. For DEG analyses, an adjusted P < 0.05, using BH, with a log2(FC) > 0.5 or <−0.5 after two-sided MAST testing and minimal fraction of gene expression in either population, >0.25 was considered significant. For GO enrichment analysis, the most enriched biological processes with at least three genes and an adjusted P < 0.05, that is, false discovery rate (FDR), after one-sided over-representation analysis were considered significant and reported. In the CELLECT and CELLEX analysis, significant cell types were identified using by trait Bonferroni’s P-value threshold of P < 0.05. Spearman’s rank correlation was used to assess the relationship between the averaged gene expression of DEGs per cell type and sample and clinical variables that differed between women with and women without PCOS. Relationships with RS > 0.5 or RS < −0.5 and P < 0.05 were considered significant. For the snRNA-seq, targeting ~10,000 nuclei per individual, with ~25,000 raw reads per nucleus and our sample size, we expected to detect differences with a power of ~80–90% and a high effect size with a mean of 0.7–0.9 and an s.d. of 0.2.
Reporting summary
Further information on research design is available in the Nature Portfolio Reporting Summary linked to this article.
Responses