Single-molecule live-cell RNA imaging with CRISPR–Csm
Main
RNA is directly involved in protein synthesis and regulates gene expression at both transcriptional and post-transcriptional levels1. Beyond RNA sequence, the spatial and temporal distributions of individual transcripts control these activities. Indeed, dynamic and orchestrated interactions among RNA, RNA-binding proteins (RBPs) and other cellular machinery occur at particular subcellular regions and time points2,3,4. For example, zipcode-binding protein 1 mediates directional transport of β-actin (ACTB) mRNA to the leading edge of fibroblasts5, where it becomes anchored to actin filaments by elongation factor 1α and locally translated, ultimately supporting cell growth and motility6.
Live-cell RNA imaging methods have begun to reveal RNA dynamics within individual cells, highlighting the value of such interrogations2,3,4. However, methods to label with stem loops7,8 or aptamers9 require the genetic insertion of sequences within specific regions of RNA or rely on exogenous expression of tagged RNA7,8,9—manipulations that are time-consuming and can interfere with native RNA behaviors10. Approaches to visualize unmodified endogenous RNA using molecular beacons11 or clustered regularly interspaced short palindromic repeats (CRISPR)–Cas systems12,13,14,15 suffer from limited single-molecule resolution (often restricted to highly abundant, repetitive RNAs)3,4 and excessive background signals produced by endosome-entrapped probes or overexpressed fluorescent protein fusions3,4. While the former methods have proven successful on occasion16, there is a pressing need for a generalizable single-molecule live-cell native RNA imaging platform.
Here, we describe single-molecule live-cell fluorescence in situ hybridization (smLiveFISH), an alternative strategy for visualizing any unmodified endogenous transcript. Using the RNA-targeting type III-A CRISPR–Csm system from Streptococcus thermophilus with multiplexed guide RNAs, smLiveFISH can track individual mRNA molecules in different types of living cells. We used smLiveFISH to analyze the behavior of two different mRNAs, NOTCH2 and MAP1B, encoding a cell-surface receptor protein and a microtubule-associated protein, respectively. We found that NOTCH2 mRNAs comprise two populations with distinct dynamics associated with cotranslational polypeptide translocation across the endoplasmic reticulum (ER). In contrast, MAP1B mRNAs exhibit several distinct behaviors including directional transport in a translation-independent manner. We further show that smLiveFISH can detect differences in single-transcript localization in response to small molecules, such as incorporation into P-bodies, underscoring the utility of assessing individual endogenous RNA behavior.
Results
Design and characterization of smLiveFISH
CRISPR–Cas complexes are programmable DNA or RNA nucleases from prokaryotic adaptive defense systems against bacteriophages17,18. Cas nucleases bind to CRISPR RNAs (crRNAs) to form ribonucleoprotein (RNP) complexes that recognize nucleic acid targets using base-pairing complementarity between the crRNA and target DNA or RNA17,18. Fluorescently labeled, catalytically inactivated Cas nucleases from different types of CRISPR–Cas systems (such as RCas9 (ref. 12), dCas13 (refs. 13,14) and dCsm (ref. 15)) have been used to label RNAs of interest in live cells. However, these approaches have yet to achieve single-molecule resolution because each RNA is targeted with a single crRNA, resulting in a similar fluorescence intensity between free and target-bound RNPs. Only RNA granules or RNAs with repeated sequences produce sufficient signal from multiple copies of bound RNPs that is distinguishable from nonspecific binding or background signal.
To overcome this signal-to-noise issue, we drew inspiration from smFISH19,20. In smFISH19,20, short fluorescently labeled DNA probes are tiled along the target RNA, increasing the signal-to-noise ratio and allowing detection by microscopy of equal-intensity diffraction-limited spots in fixed cells19,20. We reasoned that single-molecule imaging of endogenous RNAs in living cells could be possible if fluorescently tagged RNPs can be simultaneously tiled along a target RNA (Fig. 1a).
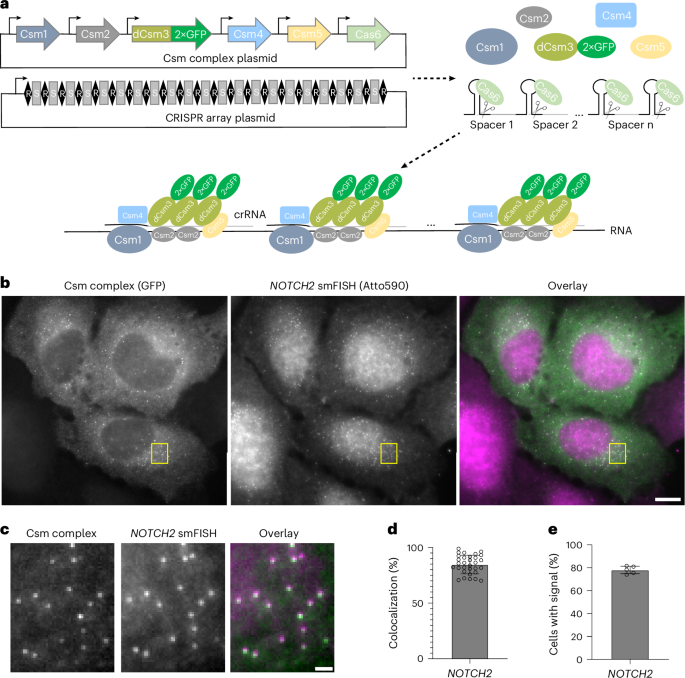
a, Schematic of the smLiveFISH system using multiplexed guides against a target RNA to achieve single-molecule resolution. Upon transfection with Csm and CRISPR array plasmids, cells produce Csm1, Csm2, dCsm3–2×GFP, Csm4, Csm5 and Cas6 proteins along with the pre-crRNA. Cas6 processes the pre-crRNA into individual crRNAs that assemble with Csm proteins into RNPs. RNPs, each with their own crRNA spacer, bind target RNA molecules simultaneously through base-pair complementarity, allowing RNA detection at single-molecule resolution. b, Left, fixed-cell image of individual NOTCH2 mRNAs labeled by GFP-tagged Csm complex and 48 NOTCH2-targeting crRNAs. Middle, image of individual NOTCH2 mRNAs labeled by smFISH probes. Right, overlaid image. Scale bar, 10 μm. c, Enlarged view of the yellow boxed region in b. Scale bar, 1 μm. d, Percentage colocalization of Csm complex foci and smFISH foci (measured as Csm complex foci colocalized with smFISH foci divided by Csm complex foci per cell). Error bar indicates the mean ± s.d.; each dot represents one cell; (n = 31 cells). e, Percentage of transfected cells with Csm-complex-labeled foci. Images obtained from five randomly selected 7 × 7 tiling regions from three biological replicates (n = 275 cells). Error bar indicates the mean ± s.d.; each dot represents one 7 × 7 tiling region.
For initial studies we compared the GFP-fused Cas13 and Csm complexes, both of which can generate individual crRNAs by processing pre-crRNAs, as catalyzed by Cas13 (refs. 21,22) and Cas6 (ref. 23), respectively. To evaluate the labeling performance of dPspCas13b (ref. 14), dRfxCas13d (ref. 22) and dCsm (ref. 15) proteins, we targeted XIST RNA, a long noncoding transcript that forms large clouds from hundreds of XIST copies in HEK293T cell nuclei24. We used a single crRNA with eight complementary target sites on a repetitive region of XIST15 (Extended Data Fig. 1 and Supplementary Table 1) and validated labeling with H2AK119ub, a heterochromatin mark enriched at the inactivated X chromosome that overlaps with XIST RNA. Only the Csm complex could label XIST robustly, an observation consistent with prior results15,25 (Extended Data Fig. 1). Notably, the Csm system has other advantages relative to Cas13. First, it contains multiple GFP-linked catalytically inactive Csm3 molecules15,26 (≥3 per complex) (Fig. 1a), which enhances signal and may aid in single-molecule detection. Second, it has higher binding affinity for RNA (Kd = 0.3 nM)23 relative to that for Cas13 (Kd ≈ 10 nM)27. On the basis of these observations, we focused on the Csm complex to develop a single-molecule mRNA labeling system.
To target mRNAs in the cytoplasm, we removed the nuclear localization signal (NLS) from each protein component of the mammalian-optimized Csm system15 and again encoded them within a single plasmid (Fig. 1a and Supplementary Table 2). To facilitate the export of pre-crRNA from the nucleus to the cytoplasm, we added a short signal sequence28 present in naturally intronless mRNAs to the 5′ end of the CRISPR array and expressed it from a CAG (RNA polymerase II) promoter (Supplementary Table 2). We selected NOTCH2 mRNA as a cytoplasmic target for proof of concept for two reasons. First, its length permits the design of distinct smFISH probes to validate labeling by the Csm complex. Second, it encodes a cell membrane protein and is, thus, enriched near the ER29,30,31, which is useful for RNA-centric exploration of cotranslational protein translocation. In each of two CRISPR array plasmids developed for this experiment (Extended Data Fig. 2 and Supplementary Table 2), all 24 36-nt targeting sequences were designed to bind in a tiled fashion along the length of the 3′ untranslated region (UTR) of NOTCH2 mRNA to avoid potential interference with mRNA translation32.
While CRISPR arrays were previously used for multiplexed targeting in human cells, their length was relatively short (generally fewer than ten crRNAs) and their processing was not directly demonstrated15,33. To test whether the Csm-associated Cas6 endonuclease could process long pre-crRNAs in cells (Fig. 1a), we used a single FISH probe (Extended Data Fig. 3a and Supplementary Table 3) complementary to the direct repeats to detect individual unprocessed pre-crRNAs. In U2OS cells cotransfected with a CRISPR-array-encoding plasmid and an empty vector expressing GFP alone, we observed high levels of intact pre-crRNA transcripts, indicated by diffraction-limited spots, in both the cytoplasm and the nucleus (Extended Data Fig. 3a). Upon cotransfection of plasmids encoding the CRISPR array and GFP-tagged Csm components, the individual spots disappeared specifically from the cytoplasm (where Cas6 and Csm proteins are localized), consistent with pre-crRNA processing (Extended Data Fig. 3b). Additionally, single-molecule spots were observed in the cytoplasm using GFP fluorescence detection, representing putative NOTCH2 mRNA signals (Extended Data Fig. 3b).
SmLiveFISH enables visualization of individual NOTCH2 mRNAs
We next used NOTCH2 smFISH to identify the spots observed in cells transfected with crRNA-array-encoding and Csm complex-encoding plasmids. Two-color imaging revealed strong colocalization of Csm-labeled foci with smFISH spots, indicating that GFP-tagged Csm complexes successfully labeled endogenous NOTCH2 mRNA (Fig. 1b,c). Quantification showed that 85% of Csm-labeled spots colocalized with smFISH spots (Fig. 1d). In addition, we found that 78% of transfected cells had clearly distinguishable spots in the cytoplasm, consistent with a high labeling efficiency (Fig. 1e). We also tested whether fewer crRNAs (6, 12 or 24) could be used to efficiently label NOTCH2 mRNA. Although we were able to detect single mRNA molecules using as few as six crRNAs (Extended Data Fig. 4a–c), the signal was less distinguishable from background compared to when more were used.
We next applied this method in other cell lines, including HEK293T, HeLa, primary human fibroblast IMR-90 and African green monkey COS-7—the latter having 94% NOTCH2 3′ UTR sequence identity to the human sequence. We observed robust labeling of endogenous NOTCH2 mRNA in all of these cell types (Extended Data Fig. 5a–d). As controls, expression of the Csm complex alone only generated a homogeneous signal when GFP fluorescence was monitored (Extended Data Fig. 6a) and expression of the crRNA array alone exhibited only weak homogeneous GFP autofluorescence (Extended Data Fig. 6b).
Having established the efficacy of smLiveFISH, we asked whether labeling endogenous RNAs might perturb their activity in cells. Previous live-cell RNA imaging methods were found to alter target mRNA stability and/or localization10,34,35. Thus, we compared mRNA abundance, decay rate, localization and protein level for NOTCH2 between Csm-labeled and unlabeled samples (Extended Data Fig. 7). Reverse transcription (RT)–qPCR measurements showed no significant change in steady-state mRNA levels across four different transcript regions (Extended Data Fig. 7a). We specifically examined both upstream and downstream of the Csm-tiled 3′ UTR region to check for accumulation of 5′ or 3′ degradation products, as has been reported for MS2 methods10,34,35. Furthermore, mRNA levels decayed at a similar rate following actinomycin D treatment, indicating no significant change in turnover time (Extended Data Fig. 7b). Western blotting showed invariable levels of NOTCH2 protein, suggesting that translation was unaffected (Extended Data Fig. 7c,d). Lastly, the location of mRNAs (identified by smFISH) was similar between Csm-labeled and unlabeled samples (Extended Data Fig. 7e). In summary, these results demonstrate smLiveFISH to be a robust, efficient and minimally invasive tool for visualizing unmodified endogenous RNAs at single-molecule resolution in many cell types.
NOTCH2 mRNAs display translation-dependent dynamics
Next, we conducted live-cell imaging to examine the dynamics of NOTCH2 mRNA in U2OS cells and observed two distinct mRNA populations according to their diffusion dynamics: slow-moving and fast-moving (Fig. 2a,b). We reasoned that anchoring to the ER membrane to allow cotranslational translocation29,31 of nascent polypeptide could explain why one population of NOTCH2 mRNA was nearly static. To test this possibility, we treated cells with puromycin, a translation elongation inhibitor that causes release of mRNA from the nascent polypeptide36. Upon treatment, the static population of NOTCH2 mRNA rapidly decreased (Fig. 2c,d and Supplementary Video 1). Single-molecule displacement and diffusivity mapping (SMdM) analysis37 of the two populations using a two-component diffusion mode (Eq. (2)) revealed that puromycin treatment correlated with a shift in the NOTCH2 mRNA population from slow to fast movement (Fig. 2e,f). Taken together, these results suggest that stationary binding of NOTCH2 transcripts to the perinuclear region is translation dependent, consistent with mRNA docking for peptide translocation across the ER (Fig. 2g).
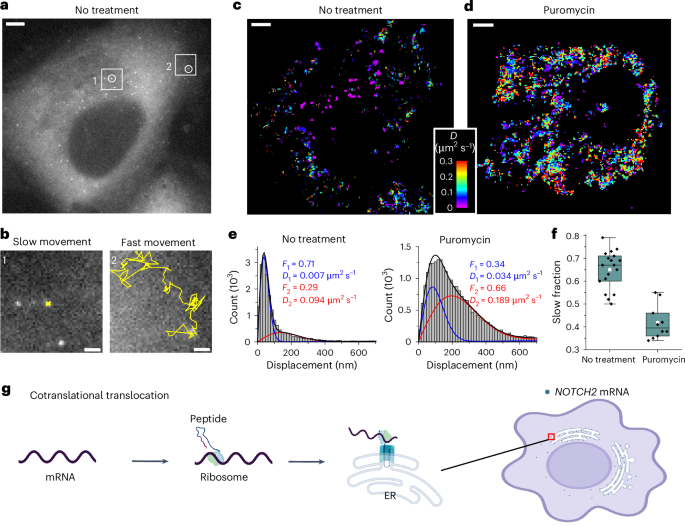
a, Single snapshot of individual NOTCH2 mRNAs in live U2OS cell. Scale bar, 5 μm. b, Movement trajectories (yellow) over time of two highlighted mRNA foci in a, reflecting slow and fast movements. Images were recorded at ten frames per second over 25 s. Scale bar, 1 μm. c, Color-coded diffusivity map based on SMdM analysis of NOTCH2 mRNA foci in the cell shown in a. d, Same as c but the cell was treated with puromycin for 1 h. The full video is shown in Supplementary Video 1. e, Distributions of single-molecule displacements across successive frames for the data shown in c,d (histograms) and fits (curves) to a two-component diffusion mode (Eq. (2)). Blue curve, slow component; red curve, fast component; black curve, sum. Resultant fractions of the two components and D values are marked in the plots. f, Quantification of the slow fraction in treated and untreated cells. Each data point corresponds to the analysis from one cell (no treatment, n = 18 cells from three biological replicates; puromycin treatment, n = 10 cells from three biological replicates). The box plots indicate the medians (center lines), means (white squares), first and third quartiles (bounds of boxes) and 1.5× the interquartile range (whiskers). g, A proposed cotranslational translocation mechanism directing NOTCH2 mRNA to the cell perinuclear region by anchoring to the ER.
MAP1B mRNAs localize to the cell edge by directional transport
To explore the generalizability of smLiveFISH, we examined a second mRNA, MAP1B, which encodes a microtubule-associated protein involved in axon growth during neuronal development38. We hypothesized that MAP1B transcripts might use a distinct mechanism of transport because of their different spatial localization pattern relative to NOTCH2 mRNA, as observed in fixed cells30.
We designed 48 crRNAs tiling the 3′ UTR of MAP1B mRNA (Supplementary Table 2) and transfected U2OS cells with Csm-complex-encoding and CRISPR-array-encoding plasmids. Similar to NOTCH2 mRNA labeling, single-molecule spots were observed in the cytoplasm using GFP fluorescence detection, representing putative MAP1B mRNA signals (Fig. 3a,b). We validated these spots with separate MAP1B smFISH probes bearing a second color fluorophore and observed strong colocalization of Csm-labeled spots with smFISH spots (Fig. 3a,b). Using smLiveFISH, we investigated the spatial distribution of the labeled RNA species. By measuring the distance from mRNA molecules to the cell nucleus and/or cell edge, we found that MAP1B mRNAs were enriched at the cell periphery while NOTCH2 mRNAs were enriched in the perinuclear region (Fig. 3c,d), in agreement with previous RNA FISH results in fixed cells30. To rule out potential interference with RNA behavior because of Csm labeling, we again compared mRNA abundance, decay rate, localization and protein levels of MAP1B between labeled and unlabeled samples and found no obvious differences (Extended Data Fig. 7).
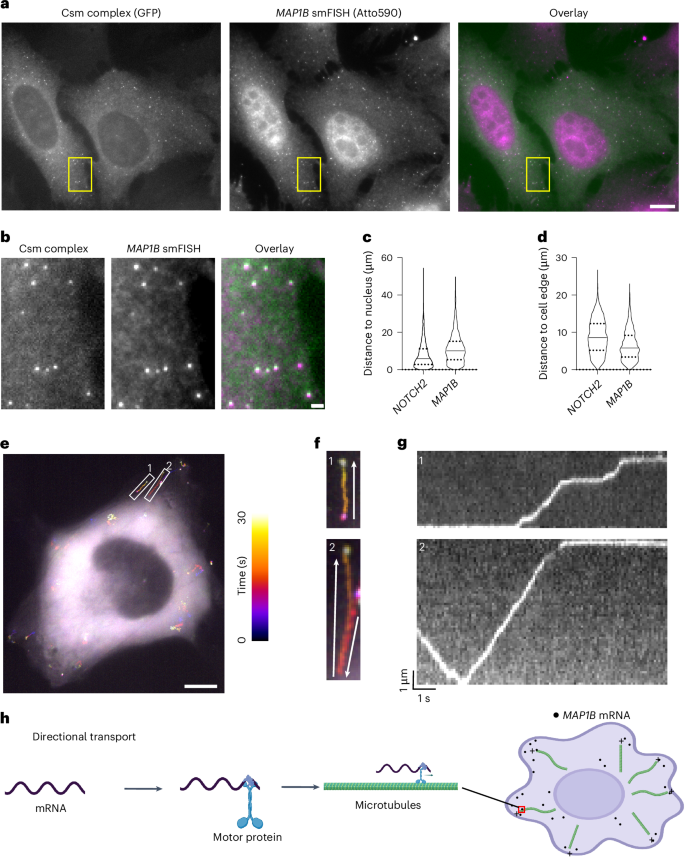
a, Left, fixed-cell image of individual MAP1B mRNAs labeled by GFP-tagged Csm complex and 48 MAP1B-targeting crRNAs. Middle, image of individual MAP1B mRNAs labeled by smFISH probes. Right, overlaid image. Scale bar, 10 μm. b, Enlarged view of the yellow boxed region in a. Scale bar, 1 μm. c, Violin plot showing distance to the nucleus for individual NOTCH2 or MAP1B mRNA molecules labeled with Csm complex. The median is indicated by the solid line; quartiles are indicated by the dashed lines. d, Same as c but showing distance to cell edge. e, Temporal color-coded trajectory of MAP1B mRNAs in live U2OS cell. Scale bar, 10 μm. White boxed regions highlight the directional transport of two MAP1B mRNA molecules. f, Enlarged views of the white boxed regions 1 and 2 in e. The full video is shown in Supplementary Video 2. White arrows indicate the direction of movement for each molecule. g, Kymograph of white boxed regions 1 and 2 in e showing directed movement of the indicated MAP1B mRNAs. h, A proposed mechanism for directional movement of MAP1B mRNA to the cell periphery through motor protein trafficking along microtubules.
To elucidate the mechanism that enriches MAP1B mRNAs at the cell periphery, we performed live-cell imaging. Strikingly, unlike NOTCH2, we frequently observed linear transport of MAP1B mRNAs toward the cell edge, upon which they remained relatively static (Fig. 3e–g and Supplementary Video 2). Occasionally, MAP1B mRNAs moved backward toward the cell nucleus but then eventually progressed again to the cell edge (for example, region of interest 2 in Fig. 3e–g and Supplementary Video 2). By analyzing these movement trajectories through kymograph, we also observed pausing of MAP1B mRNAs during transport (Fig. 3g and Supplementary Video 2). Previous RNA immunoprecipitation experiments demonstrated interactions between microtubule motor protein kinesin-1 and MAP1B mRNAs39. Taken together, these results suggest that, unlike perinuclear NOTCH2 mRNA, MAP1B mRNA uses directional transport on microtubules as a driving force to localize to the cell edge (Fig. 3h).
Translation inhibition sequesters MAP1B mRNA in P-bodies
Most transported mRNAs are thought to be translationally inactive until reaching their destination for local translation40 but a recent study showed that translation can also occur before or during transport41. Especially given that MAP1B mRNA encodes a microtubule-associated protein that may explain its transport along the cytoskeleton, we asked whether inhibiting translation influences its transit and/or postdestination dynamics.
To test this, we treated cells with puromycin and performed smLiveFISH for MAP1B mRNA. The presence of puromycin did not change the observed directional transport of MAP1B mRNA toward the cell edge (Fig. 4a–c and Supplementary Video 3), suggesting that movement is not coupled to translation. In fact, the mean transit speed of MAP1B mRNAs increased slightly but significantly from 1.3 to 1.5 μm s−1 following puromycin treatment (Fig. 4d). This might have resulted from loss of polysomes and/or RBPs from MAP1B transcripts, a possibility that remains to be tested. Similarly, we observed no change in dynamics of the stationary MAP1B mRNA population already at the cell edge upon puromycin treatment compared to the obvious shift from slow to fast movement seen for NOTCH2 mRNA (Fig. 4e and Supplementary Video 3). Thus, unlike NOTCH2 mRNA, MAP1B mRNA localization dynamics are not translation dependent.
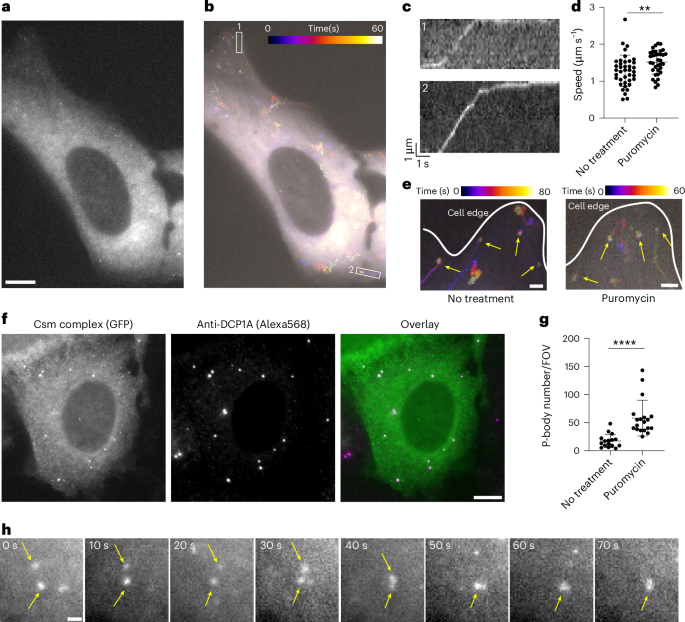
a, Single snapshot of individual MAP1B mRNAs in live U2OS cell treated with puromycin. Scale bar, 10 μm. b, Temporal color-coded trajectory of MAP1B mRNAs in cell shown in a. c, Kymograph of white boxed regions 1 and 2 in b showing directed movement of the indicated MAP1B mRNAs. The full video is shown in Supplementary Video 3. d, Directed movement speeds of MAP1B mRNAs in untreated (n = 39 events) and puromycin-treated (n = 35 events) conditions. Each dot represents a directed movement event. Error bars represent the mean ± s.d. **P < 0.01 (two-tailed t-test). e, Temporal color-coded trajectory of MAP1B mRNAs at the cell edge. Yellow arrows mark stationary molecules. Scale bar, 2 μm. f, Left, fixed-cell image of MAP1B mRNAs labeled by GFP-tagged Csm complex after puromycin treatment. Middle, immunostaining for the P-body marker DCP1A. Right, overlaid image. Scale bar, 10 μm. g, Quantification of P-body number with or without puromycin treatment. Each dot represents the P-body number per field of view (FOV), with FOVs containing similar numbers of cells between conditions (no treatment, n = 16 FOVs; puromycin treatment, n = 19 FOVs). Error bars represent the mean ± s.d. ****P < 0.0001 (two-tailed t-test). h, Time-lapse micrographs of MAP1B RNA granule formation after puromycin treatment in live U2OS cell. Yellow arrows highlight two small puncta fusing into one larger granule. The full video is shown in Supplementary Video 4. Scale bar, 1 μm.
Interestingly, some MAP1B mRNAs coalesced into larger granules following puromycin treatment (Fig. 4f and Supplementary Video 3). Because puromycin treatment was shown to induce P-body formation and enlargement in U2OS cells42, we tested whether these RNA granules represent P-body formation. Costaining for the P-body marker DCP1A (mRNA decapping enzyme 1A) showed that P-body number increased after puromycin treatment and that MAP1B mRNA granules colocalized with P-bodies (Fig. 4f,g). We captured one example of two small RNA puncta moving randomly, contacting one another and eventually fusing into a single large granule (Fig. 4h and Supplementary Video 4). Together these data show that smLiveFISH can be used to study RNA storage and metabolism in living cells.
Discussion
SmLiveFISH enables real-time tracking of unmodified endogenous mRNAs at single-molecule resolution, revealing both their spatial and their temporal dynamics in living cells. The platform uses two components, a Csm protein-encoding plasmid and a programmable crRNA-encoding plasmid. For the latter, we provide a generalizable method to construct long CRISPR arrays of up to 24 complementary sequences to a target RNA. Using smLiveFISH, we identified cotranslational translocation and directional transport as two distinct methods for NOTCH2 and MAP1B mRNA localization to the perinuclear and peripheral regions of the cell, respectively.
SmLiveFISH represents a notable advance over previous live-cell RNA imaging techniques. It obviates the need for exogenous expression or genetic tagging of RNA7,8,9 and can be used to image low-abundance and nonrepetitive RNAs while maintaining single-molecule resolution and low background3,4. However, as with other live-cell RNA imaging methods, smLiveFISH may potentially alter native RNA behavior to some degree. Although we did not observe changes in mRNA stability (abundance, decay rate and degradation products) or translation, it is possible that tethering several Csm complexes to the 3′ UTR affects mRNA folding, binding of regulatory trans-factors (RBPs and microRNAs) or rates of transport and/or diffusion.
In parallel with smLiveFISH, we tested two Cas13 systems (PspCas13b and RfxCas13d) that have demonstrated imaging utility for highly abundant, repetitive RNAs14,43. Both Cas13 proteins had limited efficacy in our hands even when attempting to image the abundant and repetitive XIST long noncoding RNA (Extended Data Fig. 1). The comparative effectiveness of CRISPR–Csm for single-transcript imaging shown in this study may have resulted from Csm’s ~30-fold higher binding affinity for RNA compared to Cas13 (refs. 23,27) and/or its multisubunit nature, allowing for ≥3 Csm3–GFP molecules per complex.
In addition to benefits of using the Csm complex, smLiveFISH takes advantage of Cas6’s ability to process long pre-crRNAs, a property we harnessed to achieve single-molecule sensitivity. By tiling multiple crRNAs along an mRNA’s 3′ UTR, we were able to increase signal-to-noise ratio, with as few as 6–12 crRNAs sufficient for detection. It is important to note that smLiveFISH may have limited applicability to mRNAs with short UTR regions. Because approximately one of three spacers chosen at random has robust targeting efficiency (likely because of target secondary structure and availability)15, it is likely that fewer spacers could be used if they are selected using bioinformatic prediction methods44 or are first tested and verified for targeting efficiency. Lastly, we provide a step-by-step protocol for constructing large CRISPR arrays used in smLiveFISH imaging.
Mutations in RBPs contribute to multiple neurodegenerative disorders including mutated FMRP (fragile X mental retardation protein) in fragile X syndrome (FXS) and mutated TDP43 (TAR DNA-binding protein 43) in amyotrophic lateral sclerosis (ALS). Both FMRP and TDP43 are implicated in regulation of MAP1B mRNA transport, translation and/or stability in neurons45,46,47 and dysregulation of MAP1B and other target mRNAs is thought to contribute to disease48. SmLiveFISH can now be used as a sensitive assay to explore such mechanisms in ways that fixed-cell assays cannot, such as by measuring changes in mRNA transport speed or stepwise displacement (Figs. 3 and 4). These analyses may help uncover the pathological mechanisms of RNA-centric diseases such as FXS and ALS.
We observed different behaviors for NOTCH2 and MAP1B mRNA after puromycin treatment, with MAP1B but not NOTCH2 forming large RNA granules coincident with P-bodies. Previous sequencing results for mRNAs isolated from purified P-bodies support these findings49, whereby mRNAs encoding proteins involved in cell division, differentiation and morphogenesis are enriched in P-bodies, while those encoding integral ER proteins are depleted49. These findings suggest that NOTCH2 and MAP1B mRNAs may rely on different decay pathways whose sorting mechanisms have yet to be elucidated.
Structural investigation of type III CRISPR–Cas systems indicates that the Csm1 and Csm4 subunits recognize the (−6) and (−7) nucleotides of the crRNA 5′ handle in a sequence-specific way26. Thus, it may be possible to develop orthogonal type III CRISPR–Cas systems with minimal crosstalk to the type III-A CRISPR–Csm complex from S. thermophilus used here, enabling multicolor live-cell RNA imaging. This method can then be extended to address questions about RNA–RNA interactions, splicing and cotranslational protein complex assembly. We expect smLiveFISH to accelerate efforts to study the spatiotemporal dynamics of various RNA species in many contexts, with immediate applications in the RNA, cell biology and neurobiology fields.
Methods
Cell lines and cell culture
HEK293T, U2OS, HeLa, IMR-90 and COS-7 cells were obtained from the University of California, Berkeley (UCB) cell culture facility and were grown in medium containing high-glucose DMEM (Thermo Fisher Scientific), 10% FBS (Sigma) and 1× penicillin–streptomycin (Thermo Fisher Scientific) at 37 °C with 5% CO2.
Plasmid construction
The nucleus-targeting Csm complex plasmid construction was described previously15 (Addgene, plasmid 195242). A cytoplasm-targeting Csm complex plasmid was generated from this by removing the NLS sequences before each protein sequence, changing dCsm–EGFP to dCsm–2×sfGFP and removing the U6-crRNA region. dPspCas13b–3×EGFP plasmid was purchased from Addgene (plasmid 132398) and dRfxCas13d–EGFP was modified from Addgene plasmid 109050 by removing the T2A sequence between dRfxCas13d and EGFP.
For the CRISPR array plasmid, NOTCH2 arrays were constructed through multiple steps of overlap extension PCR, as illustrated in Extended Data Fig. 2. Specifically, an oligo pool containing multiple 3–4-spacer fragments (sequences listed in Supplementary Table 1) was purchased from Integrated DNA Technologies (IDT). Then, the following steps were performed:
Step 1. Amplification of oligo pool fragments
A 50-µl PCR reaction was set up using Q5 high-fidelity 2× master mix (New England Biolabs (NEB)) containing 5 fmol of fragment (for example, spacers 1–4), 25 pmol of forward primer, 25 pmol of reverse primer, 25 µl of 2× master mix and water to a final volume of 50 µl. PCR was performed for 14–16 cycles. The PCR products were separated and purified from an agarose gel. If a smear was observed on the gel, the template amount or PCR cycle number was reduced.
Step 2. Joining of fragments
A 50-µl PCR reaction was set up using Q5 high-fidelity 2× master mix (NEB) containing 0.3 pmol of fragment 1 (for example, spacers 1–4 from step 1), 0.3 pmol of fragment 2 (for example, spacers 4–6 from step 1), 25 µl of 2× master mix and water to a final volume of 50 µl. Overlap extension PCR was performed for 6–8 cycles. The PCR products containing six spacers were separated and purified from an agarose gel.
Step 3. Addition of overhangs to joined fragments
A 50-µl PCR reaction was set up using Q5 high-fidelity 2× master mix (NEB) containing 5 fmol of joined fragment (for example, spacers 1–6 from step 2), 25 pmol of forward primer, 25 pmol of reverse primer (for example, containing overhang for spacer 7), 25 µl of 2× master mix and water to a final volume of 50 µl. PCR was performed for 14–16 cycles. The PCR products were separated and purified from an agarose gel.
Step 4. Joining of overhang-containing fragments
A 50-µl PCR reaction was set up using Q5 high-fidelity 2× master mix (NEB) containing 0.3 pmol of fragment 1 (for example, spacers 1–7 from step 3), 0.3 pmol of fragment 2 (for example, spacers 6–12 from step 3), 25 µl of 2× master mix and water to a final volume of 50 µl. Overlap extension PCR was performed for 6–8 cycles. The PCR products containing 12 spacers were separated and purified from an agarose gel.
Step 5. Cloning and sequence verification of intermediate fragments
The 12-spacer fragments from step 4 were cloned into vectors that were then introduced into bacteria for colony picking and sequence verification. Typically, 5–10 clones for each construct were sufficient to obtain a correct sequence.
Steps 6 and 7. Generation of final full-length arrays
Steps 3–5 were repeated to generate 24-spacer plasmids from the sequenced 12-spacer plasmids from step 5.
MAP1B arrays were constructed similarly but overhang regions were included in the original oligo pool sequences to bypass step 3 (Supplementary Table 1). Arrays were cloned downstream of a CAG promoter with a short signal sequence28 from the HSPB3 gene placed before the array to enhance pre-crRNA export from the nucleus. All cloning was performed in NEB stable Escherichia coli (NEB) to prevent recombination between repetitive sequences. Plasmids were verified by whole-plasmid sequencing. CrRNA and oligo pool sequences are listed in Supplementary Table 1. Plasmid sequences are listed in Supplementary Table 2.
Optical setup and image processing
Cell samples were imaged using a wide-field fluorescent microscope (Zeiss Axio Observer Z1 inverted fluorescence microscope) with a ×100/1.4 numerical aperture oil Ph3 Plan Apochromat objective, an ORCA-Flash4.0 camera (Hamamatsu), an X-Cite 120Q lamp and ZEN 2012 software. GFP filter sets included the BP 470/40 excitation filter, the FT 495 beamsplitter and the BP 525/50 emission filter. Atto590 and Alexa Fluor 568 filter sets included the BP 572/25 excitation filter, the FT 590 beamsplitter and the BP 629/62 emission filter. Images representing max-intensity z-projections were generated by FIJI software. Colocalization analysis was performed by FIJI plugin ComDet (version 0.5.5). Single-molecule tracking was performed by FIJI plugin TrackMate (version 7.12.1). The temporal color-coded images (Figs. 3e,f and 4b, e) were generated using the FIJI temporal color code function. Kymographs were generated using the KymoResliceWide plugin (version 0.6.0), with polyline selections used to track particle moving trajectories.
Immunostaining
For H2AK119ub staining, 1.5 × 10⁵ HEK293T cells were grown on 18-mm-diameter, #1.5-thickness, collagen-coated coverslips (Neuvitro) in a 12-well plate. The next day, cells were transfected with 0.8 μg of XIST–targeting dCsm–GFP complex plasmid, 0.4 μg of dPspCas13b–3×EGFP plus 0.6 μg of XIST-targeting PspCas13b crRNA plasmid or 0.4 μg of dRfxCas13d–EGFP plus 0.6 μg XIST–targeting RfxCas13d crRNA plasmid using 5 μl of TransIT-293 transfection reagent (Mirus Bio). After transfection, cells were grown for 48 h to allow protein and crRNA expression. Then cells were fixed with 4% paraformaldehyde (Electron Microscopy Sciences) in 1× PBS at room temperature for 10–15 min. Following three washes with 1× PBS, cells were permeabilized by 0.5% (v/v) Triton X-100 (Sigma) in 1× PBS for 10 min at room temperature. Samples were again washed with 1× PBS three times after permeabilization. The permeabilized cells were incubated in a blocking buffer (1× PBS containing 3% (w/v) BSA (Jackson ImmunoResearch)) for 1 h. Cells were then incubated with anti-H2AK119ub primary antibodies at 1:1,000 dilution (Cell Signaling, 8240S) in blocking buffer for 1 h at room temperature and washed with 1× PBS three times for 5 min each. Next, cells were stained with Alexa Fluor 568-labeled secondary antibodies in blocking buffer for 1 h at room temperature. Samples were washed again with 1× PBS three times to remove unbound antibodies. To prevent bound antibody dissociation, samples were postfixed with 4% (v/v) PFA in 1× PBS for 10 min and washed three times with 1× PBS for 5 min each.
For DCP1A staining, 1 × 10⁵ U2OS cells were grown on 18-mm-diameter, #1.5-thickness, collagen-coated coverslips (Neuvitro) in a 12-well plate. The next day, 0.8 μg of cytoplasm-targeting Csm complex plasmid and two MAP1B CRISPR array plasmids (0.7 μg each) were transfected into cells using 5 μl of TransIT-LT1 transfection reagent (Mirus Bio). After transfection, cells were cultured for 48 h to allow protein and crRNA expression. Antibody staining was performed as for the above H2AK119ub procedure but with anti-DCP1A antibody (Abcam, ab183709).
RNA FISH
HEK293T, HeLa, IMR-90 and COS-7 cells were grown on 18-mm-diameter, #1.5-thickness, collagen-coated coverslips (Neuvitro) in a 12-well plate. The next day, 0.8 μg of cytoplasm-targeting Csm complex plasmid and two CRISPR array plasmids (0.7 μg each) were transfected into cells using 5 μl of TransIT-293 transfection reagent (Mirus Bio) or TransIT-LT1 transfection reagent (Mirus Bio). For U2OS cells, 1 × 10⁶ cells were nucleofected with 1.5 μg of cytoplasm-targeting Csm complex plasmid and two CRISPR array plasmids (1.2 μg each). Then, U2OS cells were seeded on 18-mm-diameter, #1.5-thickness, collagen-coated coverslips (Neuvitro) at a density of 2.5 × 10⁵ cells per well. After transfection, cells were grown for 48 h to allow protein and crRNA expression, fixed with 4% paraformaldehyde (Electron Microscopy Sciences) and permeabilized with 0.5% (v/v) Triton X-100 (Sigma) in 1× PBS for 10 min at room temperature. After a 5-min incubation in wash buffer comprising 2× SSC (Thermo Fisher Scientific) and 30% (v/v) formamide (Thermo Fisher Scientific), cells were stained with NOTCH2 or MAP1B mRNA FISH probes in hybridization buffer containing 30% (v/v) formamide, 0.1% (w/v) yeast tRNA (Thermo Fisher Scientific), 1% (v/v) murine RNase inhibitor (NEB), 10% (w/v) dextran sulfate (Sigma) and 2× SSC in a humidity-controlled 37 °C incubator overnight. FISH probes were applied at a concentration of 200 nM (5 nM per probe, ~40 probes in total). After staining, cells were washed twice with wash buffer at 37 °C, each for 30 min. Then, cells were stained with DAPI and 5 nM readout probes in a separate hybridization buffer composed of 2× SSC and 10% (v/v) ethylene carbonate (Sigma) in nuclease-free water before imaging. The NOTCH2 and MAP1B mRNA FISH probe sequences and readout probe sequence are provided in Supplementary Table 3. NOTCH2 and MAP1B FISH probes were ordered as oligo pools from IDT.
Live-cell imaging
For live-cell imaging of NOTCH2 and MAP1B mRNAs, 1 × 10⁶ U2OS cells were nucleofected with 1.5 μg of cytoplasm-targeting Csm complex plasmid and two CRISPR array plasmids (1.2 μg each). Then, U2OS cells were seeded in a two-well glass-bottom NuncLab-Tek chamber (Thermo Fisher Scientific) at a density of 4 × 10⁵ cells per well. After 48 h, the medium was changed to live-cell imaging buffer containing DMEM without phenol red supplied with 10% FBS, 1× penicillin–streptomycin and ProLong live antifade reagent (Thermo Fisher Scientific).
Puromycin treatment
For puromycin treatment, cells were incubated in live-cell imaging buffer containing 275 μM puromycin for 60 min at 37 °C before fixation or live-cell imaging.
Illustration software
Figures 2g and 3h were created using BioRender.com.
SMdM data analysis
SMdM analyses were described previously37. Briefly, single-molecule spots were first localized in all frames. Paired locations were identified across successive frames for calculation of displacements in the frame time Δt = 100 ms. The displacements were spatially binned with a grid size of 2.5 pixels (325 nm). The displacements in each spatial bin were separately fitted to a single-component diffusion mode through maximum likelihood estimation:
Here, a = 4DΔt, where D is the diffusion coefficient and b accounts for a uniform background. The resultant local apparent D values were presented on a continuous color scale to produce a diffusivity map (Fig. 2c,d). Separately (Fig. 2e,f), all single-molecule displacements in each cell were pooled and fitted to a two-component diffusion mode50:
where F1 and F2 = (1 − F1) are the fractions of the two diffusivity components and a1 = 4D1Δt and a2 = 4D2Δt account for the two diffusion coefficients D1 and D2.
RNA abundance measurements
Total cell RNA was extracted using TRIzol Reagent (Thermo Fisher Scientific) as per the manufacturer’s instructions. Genomic DNA was removed using TURBO DNase (Thermo Fisher Scientific). After inactivating TURBO DNase with DNase-inactivating reagent, 2 μg of DNase-free RNA was reverse-transcribed using SuperScript III reverse transcriptase (Thermo Fisher Scientific) with random primers (Promega) as per the manufacturer’s instructions. qPCR was performed using iTaq Universal SYBR green supermix (Bio-Rad) in a CFX96 real-time PCR detection system (Bio-Rad). Gene-specific primer pairs used to detect mature transcripts are listed in Supplementary Table 4. The relative amount of target RNA compared to GAPDH was calculated using the 2−ΔΔCt method. Measurements were taken for three biological replicates, each with three technical replicates. No-RT and no-template controls were run alongside all RT–qPCR experiments.
RNA decay measurement
Cells were treated with 10 µg ml−1 actinomycin D (Thermo Fisher Scientific) for 0, 1, 2, 4, 8, 12 and 24 h to block transcription. Then, total RNA was extracted using the Direct-zol MiniPrep kit (Zymo Research) according to the manufacturer’s instructions. qPCR was performed on a CFX96 real-time PCR detection system (Bio-Rad) with the one-step RT–qPCR Kit (Thermo Fisher Scientific) to determine relative RNA levels. The relative mRNA levels of NOTCH2 and MAP1B versus the reference 18S ribosomal RNA were determined using three biological replicates. Following PCR amplification, melting curve analysis confirmed a single PCR product for each target gene. PCR primer sequences are listed in Supplementary Table 4.
Western blot
Cells were lysed in cold radioimmunoprecipitation assay lysis and extraction buffer (Thermo Fisher Scientific) supplemented with protease inhibitors (Sigma-Aldrich). Following centrifugation, the supernatants were collected and protein concentration measured using the Pierce 660-nm protein assay. Then, 10–30 µg of protein lysate was denatured in 1× Laemmli buffer at 95 °C for 10 min and resolved by SDS–PAGE. Proteins were transferred to an Immun-Blot LF PVDF membrane (Bio-Rad). The membrane was blocked with blocking buffer (0.05% Tween-20 and 3% BSA in 1× PBS) for 1 h at room temperature, incubated with primary antibody in blocking buffer for 2 h at room temperature, washed three times with 1× PBS, incubated with dye-conjugated secondary antibody for 1 h at room temperature and washed three more times with 1× PBS. The 700-nm and 800-nm channels of a LI-COR Odyssey CLx were used to visualize protein bands. The following primary antibodies were used for western blot: anti-NOTCH2 (Cell Signaling, 5732S; 1:1,000 dilution), anti-MAP1B (Thermo Fisher Scientific, PA5-82798; 1:1,000 dilution) and anti-ACTB (Proteintech, 60008-1-Ig; 1:2,500 dilution). The following secondary antibodies were used: IRDye 680RD goat anti-mouse (LI-COR, 926-68070; 1:20,000 dilution) and IRDye 800CW goat anti-rabbit (LI-COR, 926-32211; 1:20,000 dilution). Fiji was used to quantify the relative band intensities on blot images.
Statistics and reproducibility
Statistical analyses were conducted using GraphPad Prism (version 10.2.2). Exact statistical values are presented in the figures. The microscopy images presented from representative experiments were independently replicated at least three times with similar outcomes, unless explicitly indicated by the sample size noted in each figure.
Reporting summary
Further information on research design is available in the Nature Portfolio Reporting Summary linked to this article.
Responses