Sleep-stage dependent patterning of slowly propagating brain activity

Introduction
In the absence of overt behavior, the mammalian brain shows a remarkable amount of ongoing activity1,2,3. In addition to ongoing mentation and monitoring of the environment, this activity may support various homeostatic roles including learning and memory consolidation4,5,6. Various invasive or non-invasive methods have shown that much of this activity continues during sleep and anesthesia, is temporally correlated within large-scale brain networks, and fluctuates at slow, multi-second time scales7,8,9. Uncovering the functional role of this activity may improve our understanding of sleep’s functions and is an important topic of recent neuroscientific research.
An intriguing recent finding by studies employing functional magnetic resonance imaging (fMRI) in humans during the so-called “resting state” is the occurrence of multi-second waves of activity that propagate across cortical hierarchies between sensory/motor (SM) cortices (i.e., the visual, auditory, somatosensory, and motor cortices) and higher-order cognitive networks (i.e., the default mode network (DMN) and frontoparietal network)10,11. The existence of these cross-hierarchy propagating waves has been verified with resting-state electrophysiological recordings from macaques10. Similarly, in mice, spontaneous neuronal spiking activity during unstimulated immobility is organized in multi-second cascades that, like the propagating waves in humans and macaques, organize around peaks in brain-averaged “global” activity12. An intriguing aspect of these infra-slow global dynamics (i.e., cascades and waves), which could represent the same neurophysiological process on different spatial scales and across species, is their potential role in offline learning and memory consolidation. For example, the information flow across distinct levels of the brain’s functional hierarchy could be critical for learning. The cross-hierarchy propagation of fMRI waves resembles the cross-layer “back-propagation” of errors in artificial neural networks (ANN)13, which is required for adjusting connection weights and thus the optimization/learning of these large-scale models layer by layer. The spiking cascades observed with electrophysiology are accompanied by fluctuations in the rate of hippocampal sharp wave ripples (SPW-Rs), which have been found to be relevant for memory consolidation12,14. Furthermore, both types of events are tightly linked to arousal fluctuations, consistent with the long-standing hypothesis that memory consolidation relies on neuromodulatory action15.
Both spiking cascades and fMRI waves are phase coupled to arousal modulations, such as changes in delta-band activity and pupil size10,12,14,16. Consistent with this, fMRI waves are associated with specific deactivations in subcortical arousal-regulating regions, including the nucleus basalis (NB) of the basal forebrain and the locus coeruleus (LC) of the brainstem10,17. This suggests that, at least in part, these infra-slow global dynamics may arise from fluctuations in cholinergic and noradrenergic neuromodulatory tones, which at the same time may modulate electrophysiological features such as SPW-Rs18,19. Thus, fMRI propagating waves may be reflective of seconds-scale fluctuations in neuromodulatory tone, which in turn may orchestrate some of the homeostatic processes supporting memory consolidation.
Sleep, a state known to be critical for offline learning and memory consolidation, may fulfill these functions through similar arousal-linked brain dynamics on a timescale of seconds. Sleep itself results from interactions of major neuromodulatory systems20 and can be divided into different, typically minutes-long stages characterized by distinct levels of neuromodulatory transmitters. Nevertheless, even within sleep stages, substantial neuromodulatory fluctuations occur on finer, seconds-long time scales. Examples are “micro-arousals”, brief changes in arousal level that are increasingly recognized as contributing to memory and learning21,22,23,24. Such micro-arousals are associated with different EEG features depending on the sleep stage, for example with spindles and K-complexes during non-rapid-eye-movement (NREM) sleep, and with pontine-geniculate-occipital (PGO) waves during rapid-eye-movement (REM) sleep. These EEG features all have been recognized as supporting memory consolidation23,24,25.
Over the last two decades, numerous fMRI studies have identified brain areas associated with these EEG features16,26,27,28,29,30 but few have characterized associated activity propagation or sequential activation, particularly while considering the full spectrum of natural sleep stages. Initial findings in this regard nevertheless suggest that spatiotemporal fMRI dynamics are sensitive to sleep states10,31,32. For example, multi-second fMRI lag structures between the cortex and hippocampus are systematically modulated during slow wave sleep, possibly indicative of the putative role of hippocampal-cortical communication in memory consolidation31. Similar changes in multi-second dynamics have also been observed with electrophysiology and optical imaging31,33. During REM sleep, fMRI has been used to map brain activations associated with rapid eye movements, revealing widespread activity beyond the visual cortex with multi-second delays28,29. Thus, the fMRI propagating waves may underlie the widespread fMRI activations during sleep, playing a crucial role in facilitating communications across brain regions necessary for memory consolidation. Their spatiotemporal patterns may change across different sleep stages, contributing to sleepstagespecific effects on various aspects of memory consolidation5,24. Nevertheless, despite these early findings, it remains unclear if and how the cross-hierarchy propagating waves are different between sleep stages in the light of their distinct neuromodulatory tones. For example, given the unique combination of high cholinergic tone and low noradrenergic tone during REM, would fMRI wave characteristics of REM be different from wake and NREM sleep?
To investigate this, we analyzed whole-night fMRI to characterize cross-hierarchy fMRI propagating waves. We observed systematic modulations in the occurrence of these waves across sleep stages, with REM sleep being particularly dominated by bottom-up propagations from the SM areas to the DMN. These bottom-up propagations during REM sleep exhibited unique dynamics at key regions involved in PGO waves, the thalamus, pons, and visual cortex, and were closely associated with eye movements. We discuss these findings in the context of the current understanding of the relationship between arousal and memory consolidation.
Results
Occurrence frequency of the cross-hierarchy waves depends on sleep stage
We first quantified the occurrence frequency of propagating waves across the various polysomnography-defined34 sleep stages. The brain-wide “global” activity (i.e., fMRI signal averaged across the brain, which we refer to as the global mean blood oxygenation dependent (gBOLD) signal) frequently showed large distinct peaks. After sorting brain regions according to the principal gradient (PG), a direction approximately describing the gradient in cortical functional hierarchy35, we noticed slanted bands around the gBOLD peaks that indicated a sequential activation across regions along this direction (Fig. 1A). Utilizing a previously described method10, we then computationally identified these cross-hierarchy propagating waves along the PG direction through time-position correlations of local peaks (p < 10−5, see Materials and Methods for details). These waves were categorized as bottom-up (from SM to DMN regions) or top-down (from DMN to SM regions) propagations, respectively (Fig. 1B). The fraction of time associated with each type of these cross-hierarchy waves (“fractional occurrence”) showed significant modulation across wakefulness and the various sleep stages. Bottom-up propagations gradually increased from wakefulness to deeper NREM sleep stages (N1 to N3), peaking during REM sleep (Fig. 1C). Top-down propagations followed a similar trend from wakefulness to NREM stages, but exhibited an opposite change and reached their minimum during REM sleep (Fig. 1D). Consequently, REM sleep featured the largest difference between the two types of propagations (Fig. 1E). These findings overall are consistent across data collected on two subsequent nights but more significant in the second night (Fig. S1).

A Resting-state fMRI signals are projected onto the principal gradient (PG) direction (bottom) and segmented according to troughs (vertical dashed lines) of global BOLD (gBOLD, global mean fMRI signal averaged within gray matter regions in the green mask). The identified bottom-up and top-down propagating waves are marked by red and blue colors respectively. B The averaged pattern of bottom-up and top-down propagating waves. The occupancy fraction of bottom-up (C) and top-down (D) propagating waves, as well as their differences (E), across awake (N = 24 nights), N1 (N = 24), N2 (N = 24), N3 (N = 24), and REM (N = 18) conditions. For bottom-up propagations (C), significant differences in the occupancy fraction were observed between Awake vs. N1 (p = 0.014 paired t-test), Awake vs. N2 (p = 0.0014, paired t-test), Awake vs. N3 (p = 0.050, paired t-test), Awake vs. REM (p = 0.0047, two-sample t-test). For top-down propagations (D), significant changes were found between Awake vs. N2 (p = 5.7 × 10⁻⁴, paired t-test), and N2 vs. REM (p = 0.033, two-sample t-test). For their difference (E), significant differences were seen between Awake vs. REM (p = 0.043, two-sample t-test) and N2 vs. REM (p = 0.044, two-sample t-test). These significant changes were marked by asterisks (*p < 0.05; **p < 0.01; ***p < 0.001). The error bars in the figure indicate the standard error of the mean. SM = sensory/motor; DMN = default-mode network.
Distinct features of bottom-up propagations during REM sleep
Bottom-up propagating waves exhibited notable alterations during REM sleep. While these infra-slow waves generally maintained their sequential pattern of cross-hierarchy dynamics across different sleep stages (Figs. S2 and S3), significant timing changes were apparent, most notably in the thalamus and pons. These subcortical areas showed considerably earlier activation during REM sleep compared to other states, as is clear from the average patterns of propagations (Fig. 2A). This qualitative observation was confirmed by quantitative analysis of their relative delays with respect to the propagation center (i.e., the corresponding gBOLD peak) (Fig. 2B). During wakefulness and light sleep stages, these regions consistently lagged behind the propagation center, whereas they significantly preceded it during REM sleep (Fig. 2B). Additionally, there was a substantial increase in the peak activation of these regions during REM sleep (Fig. S4).
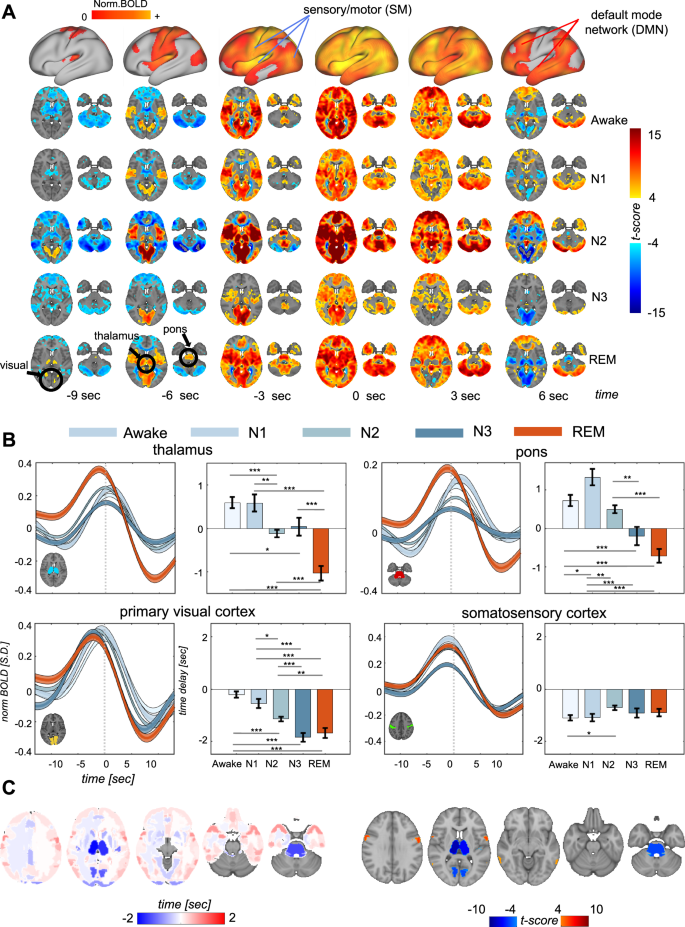
A Averaged activity patterns of bottom-up propagations under awake (N = 375), N1 (N = 162), N2 (N = 1022), N3 (N = 252), and REM (N = 251) sleep. The top row is grand-average of bottom-up propagation across all conditions (N = 2062) shown on the brain’s surface. B Region-specific dynamics in the thalamus (top left), pons (top right), visual cortex (bottom left), and somatosensory cortex (bottom right) for bottom-up propagations. For each of the four regions, the left panel shows averaged fMRI time courses for bottom-up propagations of various sleep stages, whereas the right panel summarizes the relative time delays between their peak activation and the propagation center (t = 0). For the thalamus, significant changes in time delays were observed between Awake vs. N2 (p = 1.3 × 10⁻⁵, 2-sample t-test), Awake vs. N3 (p = 0.016, 2-sample t-test), Awake vs. REM (p = 4.8 × 10⁻¹⁴, 2-sample t-test), N1 vs. N2 (p = 0.0025, 2-sample t-test), N1 vs. REM (p = 1.6 × 10⁻⁹, 2-sample t-test), N2 vs. REM (p = 3.7 × 10⁻⁶, 2-sample t-test), and N3 vs. REM (p = 6.0 × 10⁻⁵, 2-sample t-test). For the pons, significant changes in delays were seen between Awake vs. N1 (p = 0.021, 2-sample t-test), Awake vs. N3 (p = 5.0 × 10⁻⁴, 2-sample t-test), Awake vs. REM (p = 8.4 × 10⁻¹⁰, 2-sample t-test), N1 vs. N2 (p = 0.0020, 2-sample t-test), N1 vs. N3 (p = 8.6 × 10⁻⁶, 2-sample t-test), N1 vs. REM (p = 1.3 × 10⁻¹², 2-sample t-test), N2 vs. N3 (p = 0.0034, 2-sample t-test), and N2 vs. REM (p = 7.0 × 10⁻⁸, 2-sample t-test). For the visual cortex, significant delays were found between Awake vs. N2 (p = 1.1 × 10⁻⁸, 2-sample t-test), Awake vs. N3 (p = 9.5 × 10⁻¹⁵, 2-sample t-test), Awake vs. REM (p = 2.6 × 10⁻¹¹, 2-sample t-test), N1 vs. N2 (p = 0.011, 2-sample t-test), N1 vs. N3 (p = 7.4 × 10⁻⁷, 2-sample t-test), N1 vs. REM (p = 4.1 × 10⁻⁵, 2-sample t-test), N2 vs. N3 (p = 3.7 × 10⁻⁴, 2-sample t-test), and N2 vs. REM (p = 0.0094, 2-sample t-test). For the somatosensory cortex, significant delay difference was only found between Awake vs. N2 (p = 0.010, 2-sample t-test). These significant changes were marked by asterisks (*p < 0.05; **p < 0.01; ***p < 0.001) in the plots. The shaded regions represent the standard error of the mean. The error bar in the figure is the standard error of the mean. C Shifts in region-specific time delays (left) and their significance (right) from Awake to REM sleep highlight the largest changes in the thalamus, pons, and visual cortex, which are known to be involved in PGO waves.
Given the well-established involvement of the thalamus and pons in PGO waves, a hallmark of REM sleep, we investigated whether the visual cortex, another key region relevant to PGO waves, exhibited similar changes. While the peak activation of the primary visual cortex occurred already ahead of the bottom-up propagation center during wakefulness and N1, it further advanced during deeper NREM stages and REM sleep (Fig. 2B, bottom left). In contrast, no such phase shift was observed in the somatosensory region across different brain states (Fig. 2B, bottom right). As a result, the relative phase of the visual and somatosensory regions was reversed during deeper NREM stages and REM stages compared to wakefulness and N1 sleep (Figs. 2B and S4).
To comprehensively assess phase shifts across the entire brain, we conducted a data-driven lag analysis across all cortical and subcortical regions of interests (ROIs) defined by brain atlases (see Methods for details). The thalamus, pons, and visual cortex were the regions displaying the most substantial phase shifts in bottom-up propagations during REM sleep compared to wakefulness (Figs. 2C and S5). In summary, bottom-up propagating waves during REM sleep are characterized by prominent leading co-activations in the thalamus, pons, and visual cortex.
Bottom-up propagations during REM sleep are associated with eye movements
We further examined the potential relationship between bottom-up propagations and eye movements, another hallmark of REM sleep that is also linked to PGO waves25,36,37 and momentary increases in cholinergic modulatory tone38. The eye movement estimated by electro-oculography (EOG) signal variation (see Methods for details) revealed a distinctive peak occurring roughly 4 seconds ahead of the bottom-up propagation center only during REM sleep but not under other conditions (Fig. 3A, and Fig. S7). Importantly, this EOG-based eye movement peak was also absent for gBOLD peaks unrelated to bottom-up propagations (Fig. S7). To gain further insights, we identified isolated events of EOG-based eye movements (i.e., eye movements preceded and followed by at least 8 s of stability, see Methods for details) and aligned fMRI changes accordingly. The projection of the eye movement associated fMRI changes onto the PG direction unveiled a clearly slanted band (Fig. 3B) that is apparent as a bottom-up propagating wave on the brain’s surface (Fig. 3C) and associated with early thalamic and pontine changes (Fig. 3C).
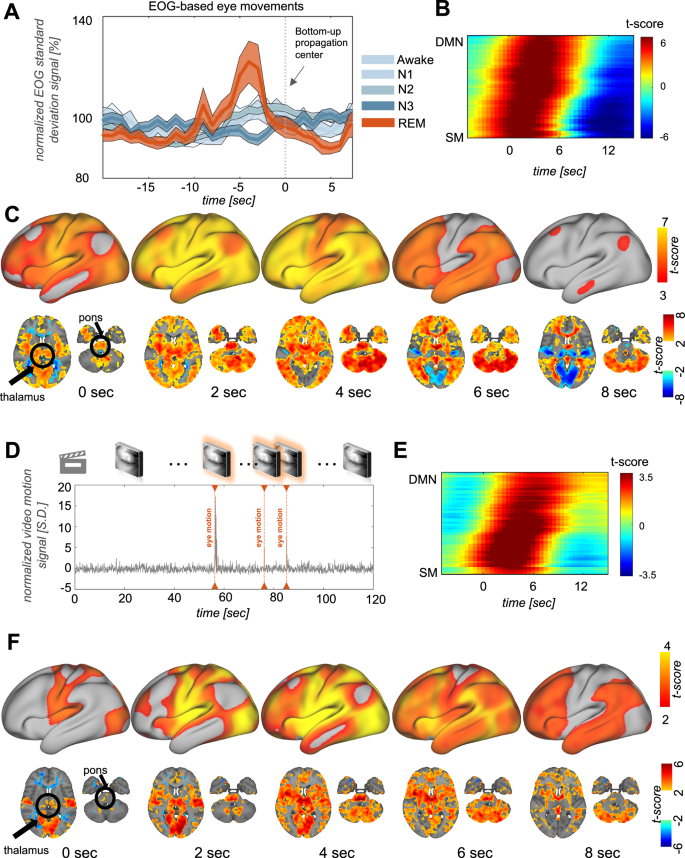
A EOG-based estimates of eye movements showed large changes at the early phase (~ −4 s) of bottom-up propagations during REM sleep (orange) but not under other brain states. The shaded region represents the standard error of the mean. B Averaged fMRI changes, which were sorted according to the principal gradient (PG), around isolated eye movement events (N = 413) detected based on EOG during REM sleep (see details in Methods). C EOG-eye-movement-triggered fMRI changes displayed on a brain surface exhibit a clear propagation from the SM to DMN regions. D Examples of isolated eye movements based on concurrent video recordings. E Averaged fMRI changes, which were sorted according to the principal gradient (PG), around isolated eye movement events (N = 178) detected based on video during REM sleep. F Video-based eye movements are associated with fMRI dynamics of propagation from the SM to DMN regions.
In confirmatory analysis, we analyzed concurrently recorded eye-video to independently detect eye movements using an established method (Fig. 3D, see Methods for details)39. Like the EOG-based analysis, isolated eye movement events identified from videos were associated with fMRI activation with progressively increased delays along the PG direction (Fig. 3E). The averaged pattern of fMRI activation associated with these video-based eye movements also exhibited a clear bottom-up propagation with early thalamic and pontine co-activations (Fig. 3F).
Discussion
In the absence of overt behavior, multi-second waves of activity traverse the cortex in a manner that follows the hierarchy of functional specialization bidirectionally. A comprehensive analysis of the full spectrum of natural sleep states shows that these waves are present at all sleep stages, albeit with substantial differences. Both occurrence frequency and specific spatiotemporal features showed differences across sleep stages. Most notably, REM sleep stood out for its relative dominance of bottom-up propagations. Importantly, bottom-up propagating waves during REM sleep exhibited distinct differences compared to those of wakefulness and other sleep stages. The thalamus, pons, and visual cortex significantly shifted their phase and co-activated with other sensory/motor areas at the early phase of each wave. During REM sleep, these bottom-up waves were also associated with rapid eye movements.
The observed modulation in wave activity across sleep stages is consistent with, and likely related to, previously observed changes in resting-state fMRI dynamics during NREM sleep10,16,40. Both the occurrence frequency and spatiotemporal features of these propagating waves are expected to profoundly affect relative time delays and thus zero-lag correlations between different brain regions, potentially contributing to changes in fMRI lag structure and connectivity measures32,41,42,43,44. Compared to NREM sleep, the modulation of bottom-up propagating waves appears more pronounced during REM sleep. While a few studies have explored resting-state fMRI during REM sleep, previous comparisons with other sleep stages were limited to examining zero-lag correlations45,46. Previous findings of increased thalamic correlation with sensory/motor areas during REM sleep align with our finding that the thalamus shifted its phase in bottom-up propagations to co-activate with the sensory/motor regions45.
Bottom-up propagations are linked to prominent REM sleep features, i.e., eye movements and PGO waves. Several studies have shown that eye movements during REM sleep are associated with fMRI changes over widespread brain areas28,29,30. An intriguing but previously unexplained observation has been that the fMRI correlates of rapid eye movements exhibit distinct time delays for different brain regions, including negative delays, relative to eye movement onset29. Our findings align with these early observations but, more importantly, provide an explanation for this puzzle by integrating these fMRI changes into the cross-hierarchy propagating wave framework. Consistent with the previously observed negative fMRI delays29, the onset of bottom-up propagations clearly preceded eye movements, even without accounting for the multi-second hemodynamic delays inherent to fMRI contrast47. Thus, the eye movements could be a consequence or reflection, rather than a cause, of these propagating waves.
Bottom-up propagations are likely also related to PGO waves, another REM sleep signature that has also been linked to rapid eye movements25,36,37. When comparing bottom-up propagations across sleep stages, three key regions for PGO waves − the thalamus, pons, and visual cortex—stood out as they exhibited the most significant phase shifts in this wave activity during REM sleep compared to wake and light sleep stages. This correspondence suggestes a connection between bottom-up propagating waves and PGO waves. It is, however, worth noting that these two types of events occur at distinct time scales (>10 s versus sub-second) and thus should not be regarded as the same. Instead, PGO waves may occur, along with rapid eye movements25,36,37, with a high probability at a certain phase of bottom-up propagations when the thalamus, pons, and visual cortex co-activate. Furthermore, auditory and somatosensory/motor cortices co-activated with these three regions during the early phase of bottom-up propagations, consistent with electrophysiological studies indicating that PGO waves extend beyond the three key regions and involve other sensory and motor areas28.
The cross-hierarchy propagating dynamics could be crucial for REM sleep to fulfill its role in facilitating memory consolidation and learning. REM sleep is known to serve vital brain functions, particularly related to learning and memory consolidation48,49,50. The realization of these functions has been linked to REM sleep dynamics and features, such as PGO waves and eye-movement-associated dreaming25,51. Our study links these established REM signatures to infra-slow global brain activity, and more importantly, unveils the intricate organization of this infra-slow dynamic, i.e., its cross-hierarchy propagation, that aligns well with its potential role in learning and memory. From a computational standpoint, the information flow across distinct levels of hierarchy could be critical for learning. An artificial neural network can only effectively learn (i.e., being optimized) by back-propagating errors, layer by layer, along the direction of hierarchical gradient to adjust model weights (i.e., connections of artificial neurons)13,52. It is worth noting that the bottom-up propagations are actually from association areas to primary regions within sensory systems10,11 consistent with this “back-propagation” notion. From a more theoretical perspective, a leading hypothesis proposes that to function efficiently, the brain operates as a predictive coding model in which hierarchical processing is essential51,53. During REM sleep and dreaming, when the brain disconnects from the external world and lacks sensory inputs, sensory inputs can be reactivated internally at lower-level cortical regions and then resynthesized by higher-order brain areas to optimize and update this model29,54,55. The hierarchical information flow would also be essential for this (re)activation-synthesis process. Our finding that the REM dynamics are largely organized as cross-hierarchy propagating waves supports this theory by showing that sensory activations are followed by the activation of higher-order networks.
The bottom-up propagation might be related to dreaming, particularly during REM sleep. First, in addition to the thalamus and pons, the visual cortex is the only sensory modality showing substantial phase shift (Fig. S5), consistent with its unique role in dreaming as compared with other sensory modalities56,57. Second, the bottom-up propagations occur most frequently with high amplitude during REM sleep, when dreams are known to be most vivid and intense58. Lastly, the sequential activation of heteromodal regions after unimodal areas during bottom-up propagations may well correspond to the process that elements generated during sensorimotor activity are interconnected to form a cohesive dream narrative and thus generate dream consciousness in the high-order brain areas45,59.
The neural mechanisms responsible for changes in the frequency and patterns of cross-hierarchy waves across sleep stages remain unclear and cannot be discerned from our study. However, a comparison with previous studies indicates that our findings, particularly the bottom-up waves, are consistent with a putative involvement of adrenergic and cholinergic neuromodulation. It has been shown that bottom-up propagating waves are associated with specific deactivations in the brainstem LC and the basal forebrain NB, major subcortical hubs for adrenergic and cholinergic neuromodulatory signaling respectively10. In addition, the pharmaceutical deactivation of the NB in one brain hemisphere effectively suppressed the amplitude of gBOLD of the ipsilateral side60, a feature which the cross-hierarchy propagating waves center on.
The modulation of fMRI waves across sleep stages is consistent with this putative involvement of adrenergic and cholinergic modulators, which are known to vary across sleep stages61. While deeper NREM sleep generally exhibits reduced levels of both neurotransmitters, REM sleep features a distinct pattern with a high cholinergic tone but the lowest norepinephrine level15,62. This may explain why the most conspicuous changes in both the frequency and pattern of fMRI propagating waves occurred during REM sleep. In addition, the existence of second-scale phasic modulations of these two neuromodulatory systems has been well documented within sleep stages21,63. For example, NREM sleep is characterized by infra-slow fluctuations in norepinephrine tone attributed in part to variable LC activity21,63,64, which can be enhanced optogenetically to improve memory21. Such “microarousals” have been proposed to elicit hippocampal-cortical communication22. Several recent fMRI studies have reported widespread signal changes co-occurring with secondary measures of (micro) arousals16,65,66. Elevated cholinergic modulation exerted by the pedunculo-pontine nucleus induced similar “phasic” micro-states during REM sleep38, which are specifically accompanied by eye movements and PGO waves38. These phasic REMs have also been proposed to guide the direction of information flow between cortex and hippocampus and linked to learning and memory67.
The cholinergic and noradrenergic activity change around spontaneous arousals during wake, which are indicated by pupil dilations, may provide clues for the change in bottom-up wave pattern during REM sleep68. While both neurotransmitters increase ahead of spontaneous pupil dilations in mice during wakfulness68, the cholinergic change systematically lags behind noradrenergic modulation. It is interesting to speculate that the phase shift of the thalamus, pons, and visual cortex might be related to this delay. Specifically, these regions might be less affected by the noradrenergic system and thus its withdrawal during REM sleep. Their “apparent” phase advance might be actually caused by the phase delay of all other brain regions due to the lack of noradrenergically mediated activations during REM sleep. Consistent with this hypothesis, the visual regions indeed showed the lowest norepinephrine concentration among cortical regions whereas on the other end of the spectrum sits the motor and somatosensory regions69, which indeed showed phase delays in our analyses (Fig. S5). But the test of this hypothesis requires future animal studies with simultaenous recordings of cholinergic and noradrenergic modulatory signals.
In summary, our analysis shows that previously reported, multi-second waves of brain activity are present across the full range of arousal states occurring during natural sleep. Distinct differences in wave characteristics are seen between REM and NREM sleep, which might be due to distinct neuromodulatory tones between these arousal states. It is speculated that fMRI wave-like activity associated with momentary changes in arousal state supports the consolidation of memories. Future studies including brain-wide recording of cortical activity together with direct measurement of activity in key arousal-regulation centers will be required to test these hypotheses. Confirmation will go a long way towards interpreting and exploiting the information contained in spontaneous fMRI signal variations.
Materials and methods
Data acquisition and preprocessing
All data for this study were collected under human subjects research protocols that were approved by the National Institutes of Health Institutional Review Board and involved obtaining informed consent from the participants. The protocol number is 2016-N-0031 and the ClinicalTrials.gov Identifier is NCT02629107.
We include 12 subjects with two consecutive nights of simultaneous fMRI/EEG from a previous study70. Subjects had regular sleep two weeks prior to the experiment. All resting-state fMRI (rsfMRI) data were collected in a 3 T Siemens MRI scanner with multi-slice echo-planar imaging (flip angle = 90°, spatial resolution = 2.5 × 2.5 mm in-plane, slice thickness = 2 mm, TR/TE = 3000/36 ms). Data were collected with multi-slice echo-planar imaging in a slice-interleaved fashion. EEG and EOG data were acquired using a Brain Products (Gliching, Germany) EEG system with 64 channels covering most of the scalp (sample rate = 5 kHz). Two EOG electrodes were both suborbital to maximize the safety of the cap by maximizing the symmetry of the electrode locations. 10 MHz clock of the MRI system was used to synchronize EEG and fMRI.
The analysis involved all 12 participants (aged 18–35, 8 of whom were female) who completed both sessions of scanning. Considering the relatively small subject number, we included data from two nights in our analysis to fully utilize the data. Only fMRI runs lasting longer than 30 min and exhibiting high-quality EEG and fMRI data were preserved since acoustically stimulated or spontaneous awakenings could interrupt fMRI scans during the night. Data with excessive motion, non-uniform or ambivalent arousal states were further excluded. The fMRI data were preprocessed using AFNI software71, including the removal of outliers and slow polynomial trends, correction for slice timing, motion registration, non-linear registration to the Talairach template (TT_N27_SSW), and regressing out the estimated motion parameters and their derivatives from the data while ignoring (censoring) any outliers of motion greater than an aggregate translation (mm) and rotation (degrees) parameter of 0.3. Cardiac and respiratory effects on the fMRI were not removed since these factors are closely related to the global bold signal (gBOLD)16. Regressing these factors will cause the loss of neuro-information. Next, the fMRI was smoothed temporally using a bandpass filter within the range of approximately 0.01 to 0.08 Hz in MATLAB. Finally, we discarded the last 5 min of each fMRI run during which acoustic stimulations were introduced. The EEG signal was corrected for both MRI gradient and cardio-ballistic artifacts and was subsequently down-sampled to a 250 Hz frequency using Analyzer software (Brain Vision, Morrisville USA), which is described in the previous study70. Based on the standard criteria34, the sleep score was derived from a central electrode in 30 s epochs with standard filters and channel reference in the previous study70. The eyelid video data was also used to supplement the EOG data to aid the scoring of REM sleep. Awake, N1, N2, N3 were detected in all nights. Only 18 nights showed REM sleep.
Two MRI-compatible cameras were used to monitor subjects during their sleep. The first camera was aimed at the subjects’ right eye, tracking eyelid closure and eyeball movements during REM sleep. The second camera was mounted on the wall of the scanner room to monitor body movements for safety. The acquisition of video data was controlled by a computer, which received a duplicate of the trigger signal from the scanner, denoting the beginning of each imaging volume. Across all subjects and both nights, 82 REM sleep periods (longer than 1 min) were detected, and 44 REM sleep periods were with normal fMRI trigger information and video.
Quantification of the gBOLD propagating waves
We quantified gBOLD propagating waves using a similar method described previously10. Specifically, fMRI gray-matter voxels were grouped into 70 position bins (regions) of equal size (with an equal number of gray-matter voxels) along a principal gradient (PG) direction4, which was derived in a previous study by using a low-dimensional embedding method on a mean connectivity matrix from 820 subjects35. Next, the rsfMRI BOLD signals within each bin were averaged and displayed as a time-position graph with one dimension representing time and the other denoting 70 bins along the PG direction. Then, the time-position graph was cut into time segments based on troughs of the gBOLD signal (i.e., the global mean signal of the gray-matter regions), and a local peak was identified for each position bin within each segment. The local peak was defined as the largest peak at each bin. We only included time segments with a real “global” involvement (i.e., local peaks were detected in at least 50 out of 70 position bins) for subsequent analyses. For each time segment, we computed the Pearson’s correlation between the timing delay (relative to the gBOLD peak) and position (along the PG direction) of local peaks of all the position bins. Segments with significant (p < 10−5) positive and negative time-position correlations were identified as the bottom-up (SM-to-DMN) and top-down (DMN-to-SM) propagations, respectively.
The fractional occurrence of these two types of propagations was computed for different sleep stages as the ratio of the total duration of the propagations to the total duration of a specific sleep stage.
We then obtained the average pattern of the two types of propagations in different sleep stages. For this and subsequent analyses, we focused only on data from stable sleep stages (longer than 1 min) and excluded those during transitions of different sleep stages. Abnormal EEG fluctuations were often seen at the last 20 TRs of some REM sleep stage sessions, presumably due to motion, and we removed the last 20 TRs for all sleep stages to keep consistency. To obtain a more accurate location of the propagations, we interpolated the fMRI data from the 3 s resolution to a 0.5 s one, re-computed gBOLD in this higher resolution, and then defined its peaks as the center of the propagations. We then aligned and averaged the propagation instances according to their centers to obtain their averaged pattern for each sleep stage. The results were further converted into t-score maps (one-sample t-test) to quantify the significance of activations at different regions in these propagation dynamics.
Region-specific dynamics in the bottom-up propagations
The region-specific dynamics were first explored in four regions: the thalamus, pons, primary visual cortex, and somatosensory regions. Masks for the thalamus and pons were obtained from the Talairach atlas72 whereas the primary visual and somatosensory masks were defined based on the Juelich atlas. The interpolated fMRI signals of 0.5 s resolution were extracted and averaged within the four masks to represent region-specific signals. These regional signals were aligned and averaged according to the identified propagation centers defined above to describe the region-specific dynamics at the propagating waves. To assess the relative phase of these regions in the bottom-up propagations, we quantified their relative delays with respect to the propagation centers. Specifically, for each identified bottom-up propagation instance, we found local signal peaks of the four regions within a 15 s time window (the approximate duration of the propagations) centering around the propagation center and then computed their relative delays with the center. The propagation instances without any local peaks being identified within the specified time window, which account for ~8% on average for all four regions, were excluded from the analysis. The relative delays were then summarized across the propagations and compared between different sleep stages. In addition to the relative delays, we also recorded and compared the amplitude of local peaks in the four regions.
We then expanded the above analysis to all 67 cortical and subcortical regions defined in the HarvardOxford-Cortical/Subcortical atlas, which were registered into the Talairach space. Because the HarvardOxford Subcortical atlas did not provide a specific delineation for the pons, we replaced its “brainstem” region by the “pons” region in the Talairach atlas in this data-driven whole-brain analysis. Then, the region-specific delays of REM sleep were compared with those during wakefulness.
Eye movements
We estimated the amplitude of eye movements based on the variation of the electrooculography (EOG) signal. We first referenced two EOG channels with respect to the FPZ channel. We extracted segments of the EOG signal around the identified propagation centers (from −21 s to +9 s). We then calculated the temporal standard deviation of the EOG signals using a 1 s sliding window. The resulting EOG variation signal was regarded as an approximate estimate of eye movements and averaged over the two EOG channels. These segments were normalized by their mean and then averaged to estimate eye movements around the propagations. The procedure was repeated for both the bottom-up and top-down propagations, as well as for the gBOLD peaks not associated with any significant propagations (time-position correlation with a p > 0.05). The analysis was conducted separately for different sleep stages.
We then examined fMRI changes around brief and isolated eye movements during REM sleep. This analysis focused on 82 REM sleep periods longer than one minute. We computed the EOG variation signal in a similar way described above but with a sliding window size of 0.2 s to better capture its fast changes. Eye movements were then identified as the time periods with the EOG variation signal 3 standard deviations above the mean, which represent the periods of high eye movement variability. We merged consecutive eye movements if the resulting merged periods were shorter than 3 s in duration, similar to a previous study73. We then found the centroid of the EOG variation signal for each merged eye movement and regarded it as the center of this eye movement event. The isolated eye movements were defined as a subgroup of the identified eye movements with stable eye positions 8 s before and after them. The interpolated fMRI signals of 0.5 s resolution were then aligned and averaged according to the center of these isolated eye movement events. We further obtained t-scores for the fMRI changes and presented them in the time-position graph along the PG direction and on a brain surface.
We then estimated eye movements independently from concurrently recorded videos. Among 18 nights of data with REM sleep, 9 have concurrent video recordings and normal fMRI triggers. We estimated eye movements through these videos using an established method39, which applied a singular value decomposition to extract the motion-related video component. This method was applied to a region of interest (ROI) around the eye to improve the specificity and sensitivity of eye movement detection. The resulting eye motion signal was further normalized over each recorded REM period. Then, we used the same method described above for the EOG signals to detect isolated eye movements based on video-based motion signals. Then, the interpolated fMRI was aligned and averaged according to the center of these events.
Statistical analysis
To compare the fractional occurrence of propagations across different sleep stages, we used a paired t-test for the awake, N1, N2, and N3 sleep stages, whereas their comparison with the REM stage, which is only present in 18 nights of 24 nights recordings, was tested by two-sample t-test. The two-sample t-test was also used for comparing the region-specific delays across sleep stages. The whole-brain analysis of region-specific delays was also performed with a two-sample t-test between the awake and REM conditions, but the resulting p-values were Bonferroni corrected for comparisons made for 67 ROIs. The fMRI changes at the propagations and the isolated eye movement events were estimated for their significance through a one-sample t-test. All statistical tests were two-tailed.

Responses