Smart wireless flexible sensing system for unconstrained monitoring of ballistocardiogram and respiration

Introduction
With the aging population and the increasing prevalence of sedentary lifestyles, there has been a surge in demand for physiological monitoring devices, particularly for the continuous tracking of vital signs such as heart rate and respiration1,2,3,4,5,6,7,8,9,10,11,12,13,14. However, traditional monitoring methods, such as electrocardiography (ECG) and photoplethysmography (PPG), face substantial challenges regarding comfort and portability for prolonged monitoring15,16,17,18,19,20,21,22,23,24. These methods typically require specialized equipment, including electrodes, leads, recorders, and computerized analysis systems, and they depend on trained technicians for operation and analysis. In this context, ballistocardiogram (BCG) has emerged as a promising non-invasive method for capturing cardiac vibrations, offering unconstrained monitoring and enhanced user comfort and convenience25. Furthermore, BCG supports long-term monitoring, making it suitable for tracking sleep and exercise, while also providing real-time feedback to help users manage their health. Additionally, compared to traditional ECG devices, BCG is more cost-effective and has a lower barrier to entry, allowing ordinary users without a professional medical background to operate the devices, thereby enhancing its suitability for family and community health management26,27. BCG monitoring devices possess the potential to facilitate uninterrupted long-term measurements of comfort through a variety of versatile, smart wearable carriers. However, certain application scenarios involving high static pressure present significant challenges. For instance, the use of accelerometers and vibration sensors for seated BCG signal acquisition often encounters issues such as signal interference, suboptimal signal quality, and complications in real-time monitoring due to elevated static pressures28,29,30,31,32,33,34,35,36,37. Addressing these challenges necessitates careful consideration of various factors during the design and implementation of BCG monitoring devices to ensure an accurate, stable, and comfortable monitoring experience. Consequently, the development of high-performance flexible sensors capable of effectively monitoring weak signals in the presence of static pressure becomes particularly crucial.
Here, we present a smart wireless flexible pressure sensing system for unconstrained monitoring of ballistocardiogram and respiration. The pressure sensor employs a layered structural design, using a gradient spherical crown as the force-sensitive layer and a three-dimensional graphene mesh as the electrode, achieving force-to-electricity conversion through the coupling effects of triboelectric effect and electrostatic induction. Due to the gradient spherical crown structural design, the sensor exhibits good dynamic pressure response characteristics under different static pressures, while also possessing a wide frequency operating range and good stability. The weak physiological signal monitoring system developed with this pressure sensor can accurately monitor the BCG signal as well as the respiratory signal of the human body in an unconstrained way, without the need to wear electrodes or other wearable devices. Furthermore, the smart unconstrained sensing system has the protentional to perform the auxiliary diagnostic function of heart rate variability. The system is expected to achieve higher accuracy and broader application scenarios in the future, offering strong support for personalized health management and early disease warning.
Results
The working principle of the unconstrained monitoring system
BCG signals, representing the weak vibrations generated by heartbeats, provide valuable insights into the systolic and diastolic dynamics of the heart (Fig. 1a). To accurately capture these subtle signals, we developed a sensing system that enables continuous, real-time monitoring of cardiac activity without direct attachment to the body. The complete composition of the system and signal transmission is illustrated in Fig. 1b. The system incorporates a flexible sensor along with measuring circuit specifically designed to capture small mechanical vibrations induced by heartbeat and respiration. These vibrations travel through various body structures, including bones, blood vessels, and skin, to the surface of the sensor, where they are captured and converted into electrical signals by the sensor. The core component of the monitoring system is a flexible pressure sensor with a gradient spherical crown microstructure (Fig. 1c). The sensor comprises a UV adhesive containing a gradient spherical crown microstructure on its surface (Fig. 1d), along with a layer of PDMS that incorporates laminated graphene-meshed electrodes (Fig. 1e), the TEM images and Raman spectra of the electrode are shown in Supplementary Fig. 1. The fabrication process for the UV adhesive layer with the spherical crown structure and the PDMS layer with graphene-meshed electrode are illustrated in Supplementary Figs. 2 and 3, respectively. The gradient spherical crown structure not only withstands greater pressure but also generates charge more efficiently due to an increased effective contact area, thereby enhancing signal strength under high static pressure compared to non-gradient spherical crown structures. This design enables the sensor to maintain high sensitivity to small dynamic pressure signals even at static pressures. This capability is crucial for capturing subtle heart rate variability in heart health monitoring. The fabricated sensor is depicted in Fig. 1f. Compared to recent literature, the sensor exhibits advantages, particularly in its superior performance of the sensitivity under high static pressure (Supplementary Fig. 4).

a BCG signals generated by the heartbeat. b Generation, transmission, acquisition, and analysis of physiological signals (including BCG and respiratory signals). c Schematic diagram of the sensor’s structural disassembly. GNWs: graphene nanowalls. d Scanning electron microscope image of graphene electrode surface (scale bar: 100 μm). e SEM image of microstructural surface of gradient spherical crown array (scale bar: 100 μm). f Photograph of the flexible sensor (scale bar: 3 cm).
Theoretical analysis and sensing performance test
Figure 2a illustrates a schematic representation of the gradient spherical crown microstructures. Given that Young’s modulus of the lower UV adhesive is significantly greater than that of the PDMS, the PDMS undergoes extruded deformation according to the shape of the spherical crown when subjected to external forces. The pressure sensor with a gradient spherical crown microstructure is based on a triboelectric effect operating in a single-electrode contact-separation mode, due to its high output, simple circuit, and other advantages. As cyclic pressure is applied to the sensor, the PDMS and UV adhesive undergo a cyclic contact-separation movement, which can be converted to electrical signals due to the coupling effect of the triboelectric effect and electrostatic induction (Fig. 2b). Compared to UV adhesive, PDMS exhibits a greater capacity to acquire electrons, which can be explained by the potential well diagram in Fig. 2c. Therefore, under pressure, the surface of the PDMS becomes negatively charged, while the surface of the UV adhesive becomes positively charged. As the pressure gradually decreases, the two materials begin to separate, creating a potential difference that drives electrons to flow from the graphene-meshed electrode to the ground. When the two materials return to proximity, electrons flow back from the ground to the graphene-meshed electrode. To further verify the mechanical properties of the PDMS, we simulate the deformation of the gradient spherical crown microstructures under various pressure loads using COMSOL Multiphysics finite element analysis software. The simulation results depict the three-dimensional displacement distribution of PDMS at 5 kPa and 10 kPa, along with the corresponding cross-sectional views (Fig. 2d), which indicate that the degree of deformation of PDMS increases as pressure rises. Additionally, to evaluate the performance advantages of the gradient spherical crown structure, we simulated the whole process of compression and compared the pressure distribution of both the gradient spherical crown and the non-gradient spherical crown structures (Supplementary Fig. 5). The results indicate that the gradient structure features a larger contact area and a more intricate geometry, facilitating higher output voltages, improved mechanical stability, enhanced durability, and a broader dynamic range, thereby enhancing the overall performance and reliability of the sensor.
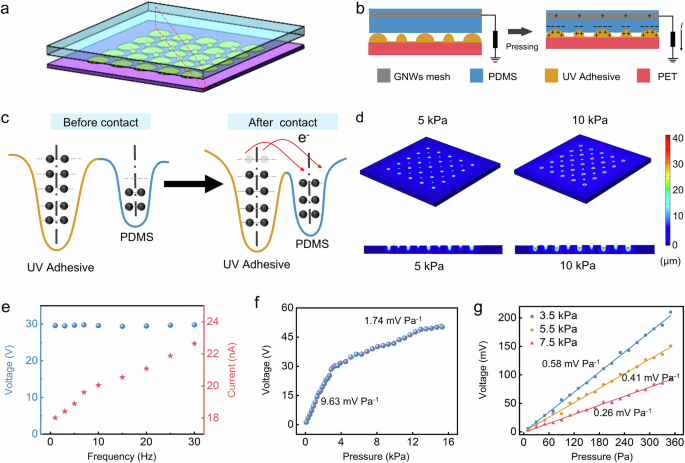
a Schematic diagram of the gradient spherical crown microstructure. b Schematic diagram of the charge transfer process when the sensor is under pressure. c The potential well model of the charge transfer before and after contact. d Simulation results of displacement of the spherical crown pressure sensors under different pressure loads. e The voltage and current frequency response curve of the sensor. f Sensitivity response curve without static pressure load. g Sensitivity response curve under different static pressure load.
In the context of human physiological signal monitoring, respiratory signals typically exhibit frequencies below 0.5 Hz, while cardiac signals primarily range from 1 to 20 Hz. Consequently, this study investigates the response of sensor within a frequency range of 0.1–30 Hz (Fig. 2e). The results indicate that the peak current increases with frequency, whereas the peak voltage remains relatively constant, proving the sensor’s commendable frequency response characteristics. The sensor exhibits two sensitivities under no external static pressure load, with a sensitivity of 9.63 mV Pa−1 for the pressure range from 0 to 3 kPa, and a sensitivity of 1.74 mV Pa−1 for that from 3 to 15 kPa (Fig. 2f). This study also tests the sensitivity of the sensor under static pressure loads of 3.5, 5.5, and 7.5 kPa (Fig. 2g). The results reveal sensitivities of 0.58, 0.41, and 0.26 mV Pa−1 under these three testing conditions, respectively. While sensitivity decreases as the static pressure load increases, it remains adequate for practical applications. To enable long-term monitoring of human physiological pressure signals, sensor stability is of utmost importance. Experiments demonstrate that the pressure sensors maintain stability after 30,000 cycles of cyclic pressure testing, with consistent peak-to-peak values in the voltage signals (Supplementary Fig. 6).
Application of unconstrained BCG and respiratory signal monitoring
In the physiological signal monitoring system, the sensor is fixed on the seat surface, and the subject sits on the seat with the sensor installed in a standard sitting posture. After the subtle signals of human breathing and heartbeat are captured by the sensor, the captured weak physiological signals are first amplified and filtered in sequence through the signal-processing circuit to remove the redundant high-frequency components in the signal. Then, the processed signal is converted into a digital signal through the analog-to-digital conversion chip and then transmitted wirelessly to the mobile terminal through the bluetooth module. Finally, the signal separation algorithm integrated into the terminal is used to separate and extract features of the physiological signal, and the breathing rate and heart rate of the subject are obtained, thereby realizing the monitoring of human physiological signals (Fig. 3a). The waveform collected during the entire process, from when the subject sits down to when they leave, reveals that the physiological signals are mixed (Fig. 3b). Based on the preceding analysis, the low-frequency component with a large amplitude corresponds to the respiratory signal, while the high-frequency component with a smaller amplitude superimposed on the respiratory signal represents the cardiac impact signal. At around 50 s, the subject kept a state of breath-holding, lasting ~10 s, during which the signal solely comprised the BCG signal. Following this breath-holding period, the subject engaged in deep breathing, during which the amplitude of the respiratory signal significantly increased compared to that during normal breathing. Additionally, the enlarge view of three states of normal breathing, breath-holding, and deep breathing are shown in Supplementary Fig. 7. It is evident that, except for the breath-holding state, the system predominantly collects mixed signals that contain both respiratory and BCG signals. Filters were used to extract the BCG and respiratory signal. To compute the time interval between the respiratory and BCG signals, peak detection was performed on the separated signals. Figure 3c, d presents the peak detection results for both the respiratory and BCG signals, respectively. To further demonstrate the capability of the physiological signal monitoring system in differentiating between BCG signals of individuals in various states, this study monitored the physiological signals of the human body before and after exercise (Fig. 3e). The experiment analyzed decomposed BCG signals of one subject in before and after exercise states, Fig. 3f displays the BCG signals and features for both resting and after exercise, while Fig. 3g indicates that heart rate after exercise is higher than before exercise by comparing the intervals.
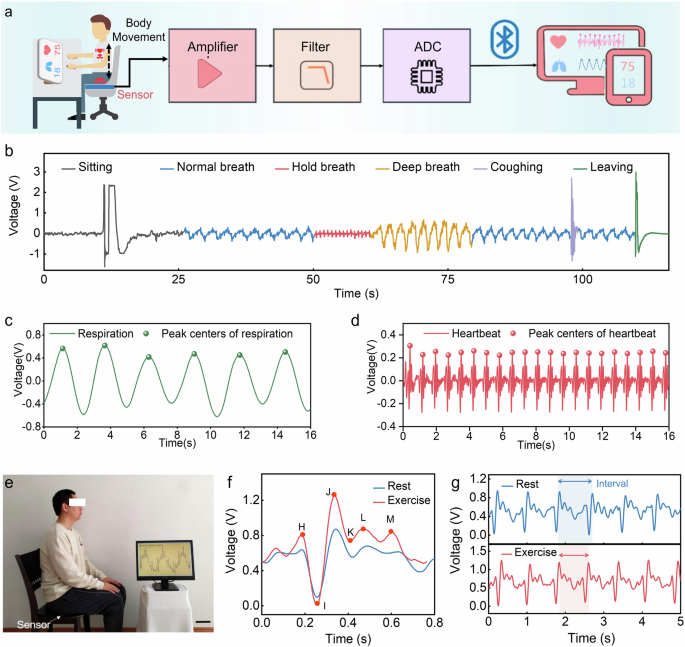
a Schematic diagram of the unconstrained ballistocardiogram (BCG) and respiration signal monitoring system. b Waveforms captured during the whole process of the test, which include normal breathing signals, breath-holding signals, and deep breathing signals. c The respiratory signal detection results. d The BCG signal detection results. e Photography of physiological signal monitoring system. f, g BCG signals detected by this system under exercise and rest.
Feasibility of heart rate variability (HRV) auxiliary diagnosis
In order to obtain more accurate monitoring results of physiological parameters, the system combines signal bandpass filtering with an improved variational mode decomposition (VMD) algorithm to decompose physiological signals, and further processes and calculates the decomposed signals. The signal-processing process is shown in Fig. 4a. As an effective signal-processing technology, the VMD algorithm has been widely used in the field of physiological signal-processing in recent years38,39,40,41. The algorithm processing process is shown in Fig. 4b. The specific content and estimation process of VMD in this study are shown in Supplementary Note 1. The main advantage of the VMD algorithm is its non-recursive nature, which means that it can adaptively decompose complex signals into a set of band-limited intrinsic mode functions based on the physical characteristics of the signal. The VMD algorithm performs well in processing mixed signals and can decompose mixed signals into clear respiratory signals and cardiac impact signals, providing a basis for subsequent peak detection and calculation of the time interval between adjacent peaks (Fig. 4c). To demonstrate the high accuracy of our system combined with VMD algorithm in monitoring heart rate and respiration rate, and to support its application in human health monitoring, we conducted a series of experiments to assess the accuracy and error of heart rate and respiratory rate measurements. We used a commercial single-lead ECG monitoring device and our system to synchronously monitor heart rate. The test results for seven subjects are shown in Supplementary Fig. 8a–c. Detailed comparisons of ECG and BCG waveforms confirmed the consistency of the two methods (Supplementary Fig. 8d). The results showed that heart rate measurement accuracy ranged from 98.56% to 99.74% (Supplementary Fig. 8e, f). Respiratory rates were also measured using the conventional timing method and our system (Supplementary Fig. 8g, h), and respiratory rate accuracy was between 98.9% and 100% (Supplementary Fig. 8i). These results demonstrate the high accuracy of our system for monitoring heart rate and respiration, supporting its application in human health monitoring. To further verify the testing effectiveness in different scenarios, we also conducted comparative testing experiments in lying and sitting positions. As shown in Supplementary Fig. 9, the difference between the two test positions is mainly due to the varying static pressure on the sensors, which results in different output amplitudes. The static pressure in the lying position is lower than in the sitting position. The decomposition of the original signal shows that the BCG signal in the lying position is clearer and more distinct.
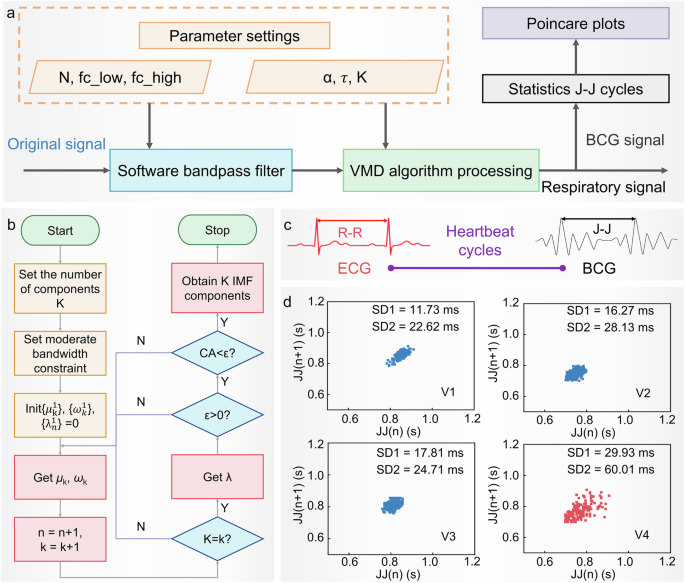
a Schematic diagram of the HRV monitoring algorithm. b Schematic diagram of the improved VMD decomposition algorithm of this system. c The R–R cycle of ECG is related to the J–J cycle of BCG. d Heart rate diagnosis results: Poincare plots corresponding to the four subjects.
Through such signal-processing, VMD not only improves the accuracy of signal decomposition but also provides reliable technical support for auxiliary diagnostic applications. Since the R–R cycle of the ECG and the J–J interval of the two cycles of the BCG can both represent the heartbeat cycle, this system can be used for HRV auxiliary diagnosis to identify individuals with arrhythmia. HRV refers to the change in the difference between successive heartbeat cycles. It plays an important role in predicting the condition and prognosis of heart disease, assessing the risk of acute myocardial infarction, and serving as an independent predictor of the risk of sudden cardiac death42. To verify the feasibility of auxiliary diagnosis of HRV, four subjects were selected: three were healthy individuals without related pathologies, while one was a patient diagnosed with arrhythmia at a local hospital. Poincare plots were utilized to analyze the HRV43. Notably, significant differences in the HRV characteristic parameters SD1 (it is a measure of short-term HRV and reflects the rapid changes in heart rate) and SD2 (it is a measure of long-term HRV and reflects the overall variability in heart rate) were observed between patients with arrhythmias and healthy individuals (Fig. 4d). The larger the characteristic parameters, the higher the risk of having an arrhythmia, thereby verifying the feasibility of the physiological signal monitoring system for HRV-assisted diagnosis. Furthermore, to demonstrate the capability of the system for prolonged monitoring, this study utilizes the system to continuously track heart rate and respiratory rate over an extended duration (Supplementary Fig. 10).
Discussion
This study introduces an unconstrained BCG monitoring system utilizing a flexible pressure sensor with a gradient spherical crown microstructure. Through theoretical analysis and experimental testing, it is demonstrated that this microstructure significantly enhances the effective contact area during interaction, resulting in a sensor with excellent sensitivity (9.63 mV/Pa), a broad frequency response range (0.1–30 Hz), and high stability (30,000 cycles). Notably, the microstructure allows the sensor to maintain good sensitivity even under high static pressures (0.26 mV/Pa at 7.5 kPa). Experimental results show that the BCG monitoring system accurately captures physiological signals from individuals in a seated position and effectively separates the respiratory component from the cardiac vibration response using the VMD algorithm. It also has the potential to assist in the diagnosis of heart rate variability and other cardiac conditions. Methods for precise, unconstrained monitoring based on smart wireless sensing systems have significantly enhanced user comfort while ensuring monitoring accuracy, offering new insights for flexible health monitoring. Further improvements in measurement accuracy under conditions of body movement and exploration of the relationship between BCG signals and medical gold standards will facilitate the widespread adoption of this method, enabling more people to benefit from advancements in flexible electronic technology.
Methods
Preparation of gradient spherical crown microstructures
The photoresist hot-melt method was chosen for the preparation of the gradient spherical crown microstructures. First, the surface pretreatment of silicon wafers. The wafers were ultrasonicated in acetone, anhydrous ethanol, and deionized water (DI water) for 15, 15, and 10 min, respectively. Then, the wafers were cleaned and dried with nitrogen and then cooled down to room temperature after being placed on a baking tray at 150 °C for 15 min. Second, the surface pre-treated wafer as a substrate was placed on a homogenizer, and AZ50XT photoresist was spin-coated on the wafer at a speed of 1500 r min−1. The wafer coated with AZ50XT photoresist on the surface was baked on a baking tray at 75 °C for 2 h and then cooled naturally. Then, the wafers were placed in an ABM model exposure machine (ABM/6/350/NUV/DCCD/BSV/M) to be exposed for the 40 s using a mask plate at an exposure power of 10 mW cm−2. Third, the exposed wafer was put into the developing solution (AZ400k:water = 1:2) to develop, and the development lasted for 4 min, after which the wafers were rinsed clean with DI water and blown dry to obtain a photoresist with a cylindrical array structure. Then, the wafers were put into the oven at a temperature of 130 °C for 270 s. As the temperature rises, the photoresist starts to melt, and the cylindrical structure gradually forms a gradient spherical crown structure under the action of surface tension. After that, the use of gradient spherical crown array microstructure photoresist as a master model, the liquid silica gel and curing agent to 10:1 weight ratio fully mixed on the surface of the master model, placed in a vacuum oven at 80 °C baking 1 h, baking is complete, the silica gel will be stripped to get the concave ball array of silica gel amplitude mold. Finally, the UV adhesive was spin-coated on the surface of the silica gel mold and covered with PET film, and the UV adhesive was cured after 5 min of UV exposure using a photolithography machine, and then peeled off to obtain the gradient spherical crown array microstructure used for the preparation of pressure sensors.
Preparation of graphene-meshed electrodes
The prepared copper lattice substrate was ultrasonically cleaned with acetone and anhydrous ethanol in an ultrasonic cleaner for 10 min, respectively, and then taken out and blown dry with nitrogen for spare. Graphene nanowalls were grown by RF plasma Enhanced Chemical Vapor Deposition (PECVD). The equipment used here is a single-temperature-area large-diameter RF-PECVD (BEQ-RF-1200C, Anhui Beyique Equipment Technology Co., Ltd.), whose RF frequency and RF power are 13.56 MHz and 5 ~ 300 W, respectively, and the temperature inside the tube can reach up to 1200 °C. The pre-treated copper mesh substrate was placed into the center of the quartz tube, and the system underwent vacuum treatment. Hydrogen (10 sccm) was introduced, adjusting the tube pressure to ~50 Pa. The temperature was then ramped to 700 °C over 40 min, followed by a 30-min annealing step at 700 °C to thoroughly remove impurities. Subsequently, the temperature was increased to 750–800 °C, and methane was introduced at a methane-to-hydrogen ratio of 6:4 sccm. Under radio frequency (RF) power conditions of 150–250 W, the temperature was further raised to 1200 °C to initiate graphene nanowall growth. After completion, the RF power and methane supply were turned off, and the system was rapidly cooled to room temperature. Hydrogen was purged from the tube, and the copper mesh substrate with graphene nanowalls was retrieved. The PDMS prepolymer and curing agent (Dow Corning Sylgard 184) were mixed in a 10:1 weight ratio and stirred. The mixture was then placed in a vacuum chamber to remove air bubbles. A PDMS liquid film was created on a glass substrate using the scraping and coating method. This film was pre-cured in an oven for 3–5 min. A copper mesh with graphene nanowalls was partially submerged in the PDMS mixture and heated at 80 °C for 1 h until fully cured. The cured PDMS was soaked in a 30% FeCl3 solution overnight to etch away the copper mesh. It was then rinsed twice with DI water and dried to obtain the PDMS-transferred meshed graphene electrode.
Packaging of the pressure sensor
First, the prepared PDMS with graphene-meshed electrodes was stacked face to face with the spherical crown array microstructure, and the device was laminated around with AB adhesive stickers, and then the PDMS prepolymer and curing agent (Dow Corning Sylgard 184) were mixed and stirred according to the proportion of 10:1 by weight and poured on the surface of graphene-meshed electrodes, and then put into a vacuum oven to bake at 80 °C for 1 h. The microstructure pressure sensor was finally obtained.
Performance test platform
The instrumentation required for the test includes a function generator, power amplifier, electrostatic meter, mechanical vibration table, digital force gauge, test circuit, and the host computer.


Responses