Smartphone conjunctiva photography for malaria risk stratification in asymptomatic school age children

Introduction
Malaria presents a substantial global health burden, especially in sub-Saharan Africa1,2,3. Many countries have successfully implemented various levels of intervention including vector control (e.g., long-lasting insecticide-treated nets and targeted indoor residual spraying) and malaria testing and treatment (e.g., malaria rapid diagnostic test [RDT] and artemisinin-based combination therapy [ACT])2,3,4,5,6. Although recently approved malaria vaccines (RTS,S/AS01 and R21/Matrix-M) offer a promising prevention strategy, large-scale vaccination programs face challenges due to modest efficacy, limited production capacity, and vaccine hesitancy7,8,9. Overall, the prevalence of malaria has recently increased due to a combination of factors, including higher temperature, increased rainfall, growing resistance to insecticides, and persistent human reservoirs of infection10,11,12,13,14,15,16,17,18,19. In 2022, estimated 249 million malaria cases worldwide resulted in 608,000 deaths with the World Health Organization (WHO) African Region accounting for 94% of cases and 95% of deaths.20
The most effective strategies for malaria control and elimination involve testing all suspected cases, including asymptomatic infections4,21,22,23,24. Point-of-care (POC) malaria RDTs have significantly improved malaria diagnosis and management25,26,27,28,29. Population-wide interventions using malaria RDTs followed by ACT have demonstrated the potential to significantly reduce the prevalence of malaria. RDTs are rapid, easy to use, and cost-effective. WHO recommends RDTs for malaria diagnosis in remote areas of sub-Saharan Africa30. However, mass screening with RDTs remains challenging in unreached and underserved populations in African countries. RDTs have several limitations; they are single-use, invasive, and require blood sampling31. Currently, risk stratification or prescreening to guide malaria RDTs is limited to assessing acute febrile symptoms (e.g., headache, chills, and muscle/joint pain)32,33. In the absence of acute symptoms, most infected individuals are unlikely to undergo RDTs, and thus remain undiagnosed.
School-age children (5 – 15 years) greatly benefit from effective malaria screening and detection. The prevalence of malaria is high among school-age children in sub-Saharan Africa with an estimated 200 million at risk19,34,35,36,37,38,39. It is estimated that up to 70% of school-aged children in high-transmission settings harbor malaria parasitemia39. Plasmodium falciparum infections peak in this age group, significantly contributing to asymptomatic (undetected) human infections34,35,36,37,38. Effective screening of school-age children for malaria is critical in two aspects. They can serve as human reservoirs of malaria, increasing transmission to vector mosquitoes19,34,35,36,37,38,39. Malaria may also impair cognitive function and negatively affect educational outcomes. Several recent studies have shown that school-age children with asymptomatic infections can benefit directly from malaria screening, chemoprevention, and treatment14,40,41,42,43.
Advances in retinal imaging and computer vision have improved the understanding of malaria-related microvascular complications in the eye44,45,46,47,48. Malarial retinopathy and cerebral malaria are closely connected with manifestations in the eyes, particularly in severe cases44,45,46,47,48. Malaria causes microvascular changes as infected red blood cells adhere to blood vessel linings, leading to obstruction44,45,46,47,48,49. Key microvascular alterations in malarial retinopathy include microvessel abnormalities, macular and peripheral whitening, and blot hemorrhage in the retina, which are commonly observed in cerebral malaria44,45,46,47,48,49. Consequently, malarial retinopathy is frequently used as an adjunct diagnostic marker of cerebral malaria. Although a smartphone adapter for retinal imaging has been tested for malarial retinopathy, challenges remain, including limited image quality and a restricted field of view50,51.
Capturing images of a more accessible anatomical site with an unmodified smartphone removes the need for specialized equipment, often unavailable in field or resource-limited settings.
We propose imaging of the inner eyelid (palpebral conjunctiva) using smartphone cameras for malaria risk stratification. Instead of directly capturing microvascular changes, mathematical characterization can be used to extract and analyze quantitative spatial information, surpassing the limitations of visual assessment. We hypothesize that radiomic analyses of smartphone photos of the inner eyelid, combined with a deep neural network classifier, can predict malaria risk in school-age children. Radiomics, which is widely used in conventional medical imaging, enables the high-throughput extraction of quantitative features to characterize pathological structures and processes52,53,54,55. Although initially developed for aerial imagery analysis52,53,54,55, radiomics has not yet been applied to clinical photos. In our approach, radiomics extracts spatial and textural features from eyelid photos, which are imperceptible to the human eye. Typically, convolutional neural network (CNN)-based deep learning for computer vision is regarded as a black box. In radiomics, the mathematical characterization of spatial and textural features provides a certain level of transparency and enables multivariate statistical analyses by combining radiomic and non-radiomic clinical data.
Results
Flowchart of mobile health (mHealth) radiomics for malaria risk stratification
Figure 1 outlines the radiomic analysis consisting of three major steps (Methods): frontend processing, feature extraction and selection, and classification. For frontend processing, study personnel captures photos of the inner eyelid using an Android smartphone. The photo acquisition protocol using ambient light (without using the smartphone flashlight) and JPEG format facilitates the implementation of a standardized acquisition protocol (Supplementary Fig. 1). A deep learning-based segmentation model automatically identifies and demarcates the inner eyelid in the photos (Fig. 2). Automatic white balancing is then applied to enhance color consistency across varying acquisition conditions. For radiomic feature extraction and selection, the predefined quantitative radiomic features from the processed inner eyelid images include intensity, texture, transform, and radial features, following the Standardization Initiative guidelines56. White-balanced red (R), green (G), and blue (B) channels are used separately instead of grayscale images. Feature selection is performed using random forests to rank the features and capture their complex nonlinear interactions. For binary malaria classification, a deep learning model using fully connected neural networks predicts the malaria risk.

The flowchart of the radiomic detection for malaria consists of three major steps: frontend processing (photo acquisition, eyelid demarcation, and white balance), feature extraction and selection, and classification. Radiomic analysis is conducted using photos of easily accessible peripheral tissue (the inner eyelid) captured using an onboard smartphone camera.
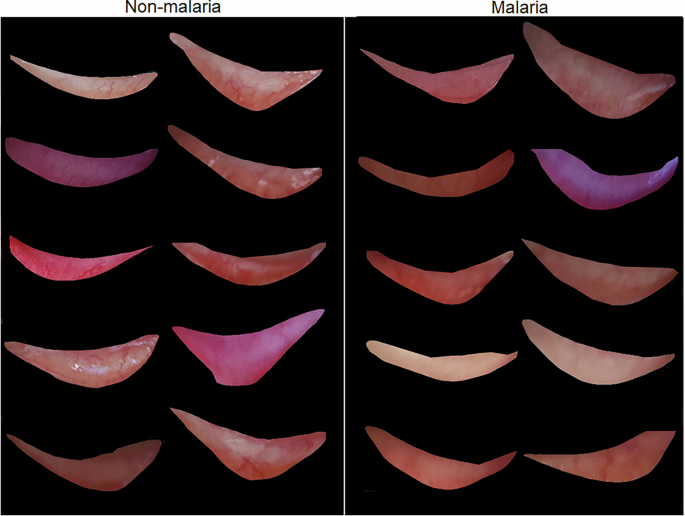
The inner eyelids (palpebral conjunctivae) are automatically demarcated using the deep learning-based segmentation model of Mask R-CNN. Radiomics enables the detection of features related to underlying microvascular changes that are imperceptible to human visual inspection.
Characteristics of the study participants
Table 1 summarizes the overall characteristics of the study participants. We performed radiomic analyses on four hundred and five children aged 5 to 15 years who were asymptomatic for malaria and residing in the Gisagara District of Rwanda. Leveraging Rwanda’s ongoing community-level malaria diagnosis and treatment efforts, children from local schools within walking distance of Gakoma District Hospital were informed about the study and invited to participate (Supplementary Fig. 2). During their visits to Gakoma District Hospital, study nurses concurrently collected data, including smartphone photos, malaria RDT results, temperature measurements, and blood samples (Methods). Gisagara District reported one of the highest malaria incidences in Rwanda with 534 cases per 1000 persons in FY 2020-2021. During the study period (FY 2023 – 2024), Gisagara District reported a malaria incidence of 143 per 1000 persons, exceeding the national average incidence of 45 per 1000 persons during the same period in Rwanda.
The radiomic analyses utilized 4302 photos of the inner eyelids captured by study personnel using different Android smartphone models: Samsung Galaxy S22 and Google Pixel 6 (Supplementary Fig. 3). The clinical data include sex, age, body temperature, blood hemoglobin (Hgb) levels, RDT results, and photos of the inner eyelid. For this study, malaria RDTs were used to detect the histidine-rich protein 2 (HRP2) antigen of Plasmodium falciparum and common Plasmodium lactate dehydrogenase (pLDH) of Plasmodium species25,57 (Methods). Note that only radiomic features from the photos were used as inputs for the malaria prediction model for practicality, although the malaria RDT results were significantly associated with age and blood Hgb levels (Supplementary Table 1). To strengthen the validation of the malaria risk stratification model, we separated the training and testing datasets based on study identifier numbers, because malaria RDT diagnostics are conducted at the individual level. The separate training (70% of the total individuals) and testing (30%) datasets were employed using a stratified random split (Methods). The inner eyelid segmentation model was independently trained using transfer learning (Methods). For binary malaria classification, a small subset of the training dataset was utilized to optimize the hyperparameters (Methods). The characteristics of the training and testing datasets are statistically balanced (Table 1).
Key radiomic features of eyelid photos for malaria
Figure 3a shows the selected radiomic features representing the feature importance determined by the mean decrease in impurity (also known as Gini importance) of the random forest classifier. A limited set of ten important predetermined radiomic features is selected to minimize the risk of overfitting (Methods). Although the selected radiomic features are all related to one another, most pairwise correlation coefficients are neither perfectly positive nor negative (Fig. 3b). All selected features are based on first-order statistics (also known as histogram features; Supplementary Table 2), which describe the image intensity (histogram of intensity) within the region defined by the demarcation mask of the inner eyelid (Fig. 2). 2D shape-related features are intentionally excluded, as they are unlikely to contain diagnostic information due to the variability in how individuals pull down their eyelids. The random forest classifier predominantly selects radiomic features from the G channel, supporting the idea that radiomic features are closely associated with microvasculature patterns. Green filtering is known to significantly enhance the contrast between microvessels and surrounding tissue, as demonstrated in various optical imaging modalities (e.g., colposcopy, endoscopy, and retinal imaging)58,59,60. In the multivariate linear regression models, blood Hgb levels and body temperature are significantly associated with the selected radiomic features (Table 2). However, the correlation coefficients between the radiomic features and blood Hgb levels, as well as body temperature, are exceedingly low (< |0.09 | ) (Table 2 and Supplementary Fig. 4).

a Feature importance of the top ten significant radiomic features, excluding shape-related features due to the lack of potential diagnostic information. The bar graph displays the mean decrease in impurity for each feature. b Pairwise correlation coefficients among the selected radiomic features, illustrating complex interactions. The absence of unity among the pairwise correlation coefficients supports the uniqueness of each selected feature. c Receiver operating characteristic (ROC) curves of the malaria prediction model plotted. The 95% confidence intervals for the ROC curves were calculated using the Wald method. d Precision-recall curve reflecting the relationship between positive predictive values and sensitivity. e Box plot of Pearson residuals comparing the two smartphone models. f Box plot of Pearson residuals between the left and right inner eyelids. g Box plot of Pearson residuals by sex. The box plots indicate the minimum, maximum, median, and the first and third quartiles of the data.
Performance of neural network malaria classification
Receiver operating characteristic (ROC) curve analysis illustrates the performance of the neural network-based malaria classification model using the selected radiomic features. Its ability to distinguish between malaria-infected and non-infected children yields an area under the curve (AUC) of 0.76 with a 95% confidence interval ranging from 0.68 to 0.84, calculated exclusively using the testing dataset (Fig. 3c). The precision (positive predictive value)-recall (sensitivity) curve is also plotted (Fig. 3d). As a standardized residual for binary classification, the Pearson residual is calculated as the raw residual ((e=y-hat{p})) divided by the estimated standard deviation: (r=(y-hat{p})/(sqrt{hat{p}(1-hat{p})})), where (y) is the observed response (0 for a negative RDT or 1 for a positive RDT) and (hat{p}) is the predicted probability (Supplementary Fig. 5). The goodness-of-fit test for all Pearson residuals in the testing dataset further yields a p-value of 0.077, supporting statistically minimal residuals (Methods). In addition, the malaria classification model does not exhibit significant discrepancies across smartphone models, left and right eyes, or sex. The malaria classification model using the radiomic features from the two smartphone models demonstrates no statistically significant difference in the Pearson residuals averaged per individual (p-value = 0.123 of a paired t-test; Fig. 3e) despite variations in onboard camera specifications (Methods and Supplementary Fig. 3). The Pearson residuals between the left and right eyelids are also not statistically significant (p-value = 0.286 of a paired t-test; Fig. 3f). The Pearson residuals of the radiomic model do not show a statistically significant difference between the sexes (p-value = 0.798 of an independent t-test; Fig. 3g).
Associations among radiomic features, blood Hgb levels, and body temperature
Among the clinical data collected, clinical laboratory blood Hgb levels (anemia) and body temperature (measured using a noncontact forehead infrared thermometer) during the hospital visit can serve as nonspecific indicators of systemic inflammation61,62,63,64,65 (Methods). Plasmodium falciparum infection is clinically characterized by pronounced systemic inflammation and febrile illness66. In the multivariate linear regression models, several radiomic features are associated with these indicators (Table 2). Specifically, eight radiomic features (excluding #3 and #6 from the ten selected features) have p-values < 0.05 for blood Hgb levels, whereas five features (#1, #2, #7, #9, and #10) have p-values < 0.05 for body temperature. However, the correlation coefficients between the radiomic features and blood Hgb levels and body temperature are very low (< |0.09 | ) (Table 2 and Supplementary Fig. 3). In addition, separate radiomic analyses for detecting anemia based on the WHO guidelines67 reveal a different set of radiomic features (Supplementary Fig. 4). When the top ten features relevant to anemia are selected (Supplementary Fig. 4a), only two features overlap between malaria and anemia: [R, first-order, maximum (#7)] and [G, first-order, variance (#8)]. These results suggest that the selected radiomic features may exhibit a certain degree of specificity to malaria.
Discussion
To the best of our knowledge, this study presents the first mHealth radiomic analysis, using smartphone photos of easily accessible peripheral tissue to identify children at an increased risk of malaria. Radiomics has been widely applied to various medical image classification tasks across conventional medical imaging modalities (e.g., computed tomography, magnetic resonance imaging, positron emission tomography, single-photon emission computerized tomography, ultrasound, fundus retinography, and optical coherence tomography)52,53,54,55. Clinical photos captured by mobile devices are becoming increasingly essential in clinical, community, and at-home settings, as healthcare professionals and community health workers integrate smartphones and tablets into their practice.
Advanced bioengineering approaches for malaria diagnostics (e.g., biosensors, microfluidics, and paper-based diagnostics) primarily rely on invasive blood sampling (e.g., capillary blood collection). Obviously, noninvasive tests are preferable by various stakeholders if available68. Machine learning and model-based inference analyses of large-scale clinical data have identified key clinical predictors of mortality in children with severe malaria; however, the emphasis has been on disease progression69. Indeed, only a few noninvasive detection studies have been conducted in vivo. Microvascular microscopy has been used to detect infected red blood cells and pigment-containing white blood cells in a mouse model of Plasmodium yoelii70,71. Recently, near-infrared spectroscopy was used to quantify parasites in mice infected with Plasmodium berghei by scanning various body parts72. Furthermore, in a controlled human clinical study using Plasmodium falciparum-infected mosquitoes, commercially available wearable devices successfully provided early warnings of infection, although heart rate abnormalities could be triggered by multiple non-infectious factors73.
Noninvasive imaging of the inner eyelid eliminates the need for specialized equipment. Specialized devices (e.g., retinal fundus imaging systems, optical microscopes, spectrometers, and wearables) pose significant barriers to implementation in resource-limited settings. Numerous existing mHealth sensing and imaging applications require additional accessories or bulky components74,75,76,77, which diminishes user acceptance and hampers the practical transition from research to clinical practice. In contrast, this mHealth solution relies solely on a built-in smartphone camera with no additional hardware. Smartphones have recently transformed healthcare in resource-limited settings, where community health workers are often equipped with mHealth applications (apps) to connect with healthcare professionals even in remote areas74,78,79,80,81. This mHealth solution serves as an example of how machine learning-based and data-driven mHealth technologies can minimize the need for complicated hardware, potentially offering mobility, simplicity, and affordability for rapid and scalable adaptation.
Imaging of the inner eyelid (the palpebral conjunctiva) offers additional advantages owing to its easy accessibility, exposure of microvasculature on the surface, absence of typical skin pigments, and lower risk of privacy breaches82,83,84. Noncontact imaging is also advantageous because alternative sensing sites (e.g., the sublingual region) are often sensitive to pressure applied to the surface85. In addition, the underlying microvasculature is not affected by skin pigmentation (e.g., melanocytes)86. The inner eyelid can potentially be considered a less identifiable body part, although further studies are needed to substantiate this idea. The extensive use of ophthalmic images and external eye photos has facilitated the development of machine learning and artificial intelligence models; however, privacy protection remains a potential concern as retinal scans and eye photos may be linked to identity risks87,88.
One limitation of this study is that malaria status was determined using RDTs that primarily detect the HRP2 antigen of Plasmodium falciparum and the pLDH antigen of common Plasmodium species25,57. Among the four Plasmodium species that cause disease in humans (P. falciparum, P. vivax, P. ovale, and P. malariae), infections caused by P. falciparum are the most likely to progress to severe disease89. Severe and fatal malaria is predominantly caused by P. falciparum, which is the leading cause of death among vector-borne infectious diseases. Importantly, the WHO recommends the use of RDTs capable of detecting the HRP2 antigen in sub-Saharan Africa30.
Another limitation is the absence of confirmatory malaria diagnoses (e.g., smear microscopy and molecular tests), which are essential to rule out false-negative and false-positive RDT results90,91. False negative results can occur for various reasons, including operator errors, improper storage conditions, pfhrp2/3 gene deletions, and low-parasite density infections. While smear microscopy offers a higher parasite detection limit (50 – 500 parasites μl−1), it can be difficult to identify the exact Plasmodium species. Conversely, polymerase chain reaction (PCR) provides highly sensitive and specific detection of Plasmodium species DNA with the ability to detect parasitemia as low as 2–5 parasites μl−1. However, the implementation of PCR as a primary diagnostic method is challenging due to the need for sophisticated equipment, trained personnel, and reagents.
We have developed a radiomic machine learning model for malaria risk stratification in asymptomatic children aged 5 to 15 years in endemic areas of sub-Saharan Africa, using photos of easily accessible peripheral tissue (the inner eyelid) and overcoming the limitations of camera resolution. The use of built-in smartphone cameras offers mobility, simplicity, and affordability, making it suitable for mass prescreening or risk-stratification in resource-limited settings. The generalizability of using arbitrary smartphone models requires further validation through studies involving a wider range of smartphone models. Once the reported radiomic model is successfully implemented into a fully functional mobile app, this mHealth technology could be evaluated for both population-level screening and individual-level care. Identifying asymptomatic infections in unreached populations can support malaria control and elimination efforts by enhancing population surveillance and epidemic preparedness. This mHealth technology could also be adapted for individual-level care as a noninvasive POC diagnostic tool, complementing existing malaria diagnostics and enhancing the management of febrile illnesses.
Methods
Study population and design
This single-center, cross-sectional observational study aimed to develop a radiomic machine learning model for predicting malaria risk among asymptotic children aged 5 to 15 years. Gakoma District Hospital in Rwanda’s Southern Province served as the designated site due to its established partnerships with local schools. Children from local primary schools (ages 5 to 12) and junior secondary schools (ages 13 to 15) near Gakoma District Hospital were invited to participate (Supplementary Fig. 2). The inclusion criteria were as follows: children aged 5 to 15 years, ability to provide written informed consent from a parent or guardian, and willingness to undergo malaria RDTs and blood draws. The exclusion criteria were: visible inflammation of the eye or eyelid, known eye infection reported by the participant, and being too distressed or ill to participate. This study was approved by the Rwanda National Ethics Committee (No. 93/RNEC/2023) and the Purdue University Institutional Review Board (IRB-2022-1644). Informed consent was obtained from each participant’s parent or guardian prior to enrollment.
Clinical data collection
The collected clinical data included sex, age, body temperature, blood Hgb levels, RDT results, and photos of the inner eyelid. Body temperature was measured using a noncontact forehead infrared thermometer (Goodbaby) during hospital visits. Blood Hgb levels, considered the gold standard for blood Hgb testing, were measured from venous blood samples using a certified hematology analyzer (Sysmex XS-500i). Malaria RDTs were conducted using the Bioline Malaria Ag P.f/Pan test (Abbott), which detects the HRP2 antigen of P. falciparum and the common Plasmodium pLDH of Plasmodium species in human whole blood25,57. HRP2 antigen-based RDTs are the most commonly used malaria test in Rwanda and other sub-Saharan African countries25,57. If the RDT result was uninterpretable or the negative control was absent, the test was considered invalid and an additional RDT was performed to confirm the result. The study nurses collected all data within approximately 30 minutes per participant (Supplementary Fig. 2). No treatment was administered before conducting inner eyelid photography or RDTs. However, if the RDT result was positive at the site, the study personnel provided the participant with ACT, following the current standard of care in Rwanda. The study nurses did not have any knowledge of the radiomic outcomes for the participants.
Eyelid photography using unmodified smartphones
Smartphone photos of the inner eyelid were captured immediately before or after clinical data collection. The photo acquisition protocol accounted for diverse conditions to ensure successful translation and implementation in a real-world setting (Supplementary Fig. 1). Our study personnel captured photos, while the volunteer pulled down the eyelid to expose the inner eyelid. Photos were acquired from both eyes and labeled left and right using two different Android smartphone models (Samsung Galaxy S22 and Google Pixel 6). The light conditions were ambient room light or sunlight, without the use of a smartphone flashlight. Both Samsung Galaxy S22 and Google Pixel 6 have camera apps with advanced features and specifications for photography, but they offer different camera capabilities (e.g., lens, autofocus, color rendering)92. As the primary specification, we also quantified the spatial resolutions of Samsung Galaxy S22 and Google Pixel 6 using the edge method93,94. We considered a typical distance of 100–150 mm between the camera and the volunteer’s eyelid. The spatial resolutions were determined by the full width at half maximum (FWHM) of the line spread function (LSF), yielding 172 µm for the Samsung Galaxy S22 and 137 µm for the Google Pixel 6; LSF was derived by taking the derivative of the edge spread function. The photos were time-stamped, saved in JPEG format, and assigned a unique participant identifier.
Training and testing datasets of smartphone photos
The clinical data used for the analyses were based on 4,302 photos of 405 participants. Multiple photos were captured from both the right and left eyelids using different smartphones, resulting in an average of approximately ten photos per individual. We separated the training (70% of the total individuals) and testing (30%) datasets based on study identifier numbers, because malaria diagnostics were conducted at the individual level. The photos from the same individuals were assigned exclusively to either the training or testing datasets, ensuring no overlap. Specifically, we used a stratified random split to maintain proportional representation of malaria-positive and malaria-negative cases in each subset. This approach ensured that both the training and testing groups had similar distributions of the outcome variable, minimizing class imbalances and improving the model generalizability. The model, trained on 3,067 photos, was successfully tested on 1,245 photos using the Pearson ({chi }^{2}) goodness-of-fit statistic;
({chi }^{2}=sum {r}^{2}) with the Pearson residual (r). The overall characteristics of the training and testing datasets are summarized in Table 1, showing that both datasets exhibit similar underlying characteristics.
Automatic demarcation and mask preparation of the inner eyelid
We used a deep learning-based segmentation model to automatically demarcate the inner eyelid. Specifically, we utilized Mask R-CNN, which consists of ResNet 101 for feature extraction, region proposal network, Faster R-CNN, and segmentation mask95. Mask R-CNN was implemented using Detectron2, an open-source library developed by Facebook AI Research that provides object detection and segmentation96. For image annotation, we used Labelme, which is an image labeling tool that offers a graphical polygonal annotation function to mark object edges97. Each annotated image was cross-validated by two researchers to ensure consensus on the various shapes of the inner eyelid, resulting in a segment mask corresponding to the inner eyelid. The Mask R-CNN segmentation model was trained independently as transfer learning proved sufficient for this task. Specifically, we utilized approximately 130 photos that were not part of the main datasets, while leveraging pre-trained Mask R-CNN from the common objects in context (COCO) dataset. The inner eyelid segmentation model also provided an automated means for triaging low-quality photos. On average, the model excluded 5% of the original photos, corresponding to approximately one to two photos per participant.
White balance
We processed the photos using an automatic white balance method (also known as computational color constancy). Automatic white balancing is a common post-processing technique used to ensure that colors in a photo appear natural, regardless of light conditions98,99. Specifically, we utilized Cheng’s principal component analysis (PCA), which selects the percentages of dark and bright pixels for optimal white balance100. The Cheng’s PCA white balancing minimizes color variations caused by different light conditions while requiring minimal computation.
Radiomic feature extraction
We conducted radiomic feature extraction using three main steps: feature extraction, data normalization, and data integration, following the Standardization Initiative guidelines56. For feature extraction, we computed a wide range of predetermined radiomic features from the inner eyelid images. We intentionally excluded 2D shape-related features from the predefined radiomic configuration parameters, because the shape of the inner eyelid can be easily affected by how the individual pulled down their eyelid. Thus, it is highly unlikely that 2D shape-related features contain diagnostic information. Instead of using grayscale images, each RGB channel was processed independently by performing feature extraction separately on each white-balanced R, G, and B image. For data normalization, all extracted radiomic features were standardized using Z-score normalization to ensure comparability across various images. For data integration, we merged the radiomics data with the clinical data based on participant identifiers, ensuring that each set of radiomic features was accurately linked to the corresponding clinical data.
Radiomic feature selection
We selected significant radiomic features using two preprocessing steps: handling missing values and applying min-max scaling. We handled missing values using the k-nearest neighbor imputer, which estimates values based on the closest available data points. To ensure equal contributions from all features, we scaled the features to a range between zero and one. We then utilized random forests to rank the features and capture complex nonlinear interactions within a large feature set. The random forest classifier was trained multiple times with different random seeds to ensure robustness. In each iteration, feature importance was computed, and the top ten features were selected based on their contributions to the classification task. Only features that consistently ranked high across different random seeds were selected to ensure the selection of the most relevant features. Note that the radiomic feature selection was conducted exclusively using the training dataset.
Classification model using neural networks
We constructed a neural network-based classification model to predict malaria RDT results, using only the selected radiomic features as inputs. First, we addressed the imbalance of positive RDT results in the dataset by augmenting synthetic data. Second, we split the resampled data into training (70%) and testing (30%) datasets to ensure that data from the same participants did not overlap between the two datasets. Third, we designed a fully connected neural network by exploring various configurations of hidden layers, activation functions, solvers, and learning rates. The best-performing model was further fine-tuned by optimizing a set of hyperparameters. Specifically, 20% of the training dataset was used for randomized search to optimize hyperparameters, including the learning rate, the maximum depth, and the number of estimators. The final network architecture consisted of an input layer with ten nodes, two hidden layers with 50 nodes each, and an output layer. The network utilized ReLU or tanh activation functions and the Adam optimizer. The initial learning rate was set to 0.001 – 0.01 with scheduled reductions over predefined epochs. We further conducted the ROC analyses of the fully connected neural network classifier, exclusively using the testing dataset.
Statistical regression analyses
We conducted multiple logistic regression analyses using the selected radiomic features and clinical data as input variables while the malaria RDT result was the output variable. These analyses allowed us to gain a conventional understanding of the significant variables associated with the malaria RDT results. In addition, we performed multivariate linear regression analyses using the selected radiomic features and clinical data as input variables, and blood Hgb levels and body temperature as output variables. These linear regression analyses aimed to provide a conventional understanding of the radiomic features associated with blood Hgb levels and acute febrile illness, which are nonspecific indicators of systemic inflammation61,62,63,64,65 (Methods). Plasmodium falciparum infection is clinically characterized by pronounced systemic inflammation and febrile illness66.

Responses