Soft X-ray tomography reveals variations in B. subtilis biofilm structure upon tasA deletion
Introduction
Many microorganisms develop surface-attached biofilms with a characteristic protective matrix consisting of adhesive macromolecules such as exopolysaccharides (EPS), DNA, and proteinaceous filaments or fibrils1,2. This heterogeneous gel-like matrix is complemented by small and medium-sized compounds, among them nutrients, signaling molecules, and surfactants1,2,3. Although biofilms in natural environments are inhabited by a variety of bacteria and other organisms, structural investigations on model biofilms, e.g., of Bacillus subtilis, help to understand basic principles of biofilm construction, function and development. B. subtilis can produce different types of biofilms depending on culture conditions, such as submerged biofilm within a liquid or pellicles that are formed on surfaces of liquids1,4,5.
The extracellular matrix (ECM) of the B. subtilis biofilm contains polysaccharides6 and the major proteinaceous biofilm component TasA, which can form filaments and fibrils7,8,9. The filaments are formed by a strand complementation mechanism8,9, initiated by TapA, which can also anchor the TasA filaments10,11. The hydrophobin-like lipoprotein A (BslA) adds additional protection to the surface of the ECM1.
Different methodological attempts have been made to analyze the entire biofilm architecture using mass spectrometry12, magnetic resonance imaging13,14, scanning transmission X-ray microscopy15,16, small and wide-angle X-ray scattering17, or different electron microscopic techniques18. Making use of an extended antibody staining concept, high-resolution light microscopy has been used to reveal the architecture of living V.cholerae19 biofilm in three-dimensional super-resolution microscopy. A combination of super-resolution PALM with a single objective light sheet and precision genome editing was used in studies of E.coli biofilm structure20. Proteus mirabilis biofilm structure and subcellular DNA organization were investigated by 4-fold expansion microscopy after digesting oligosaccharide and protein components by an enzyme cocktail21. As biofilms are heterogeneous assemblies containing up to 97% (w/w) water22 fixation, drying, freezing, and dehydration steps compromise morphology and 3D structure, representing a challenge for these 3D imaging techniques.
Here, we employ soft X-ray tomography (SXT) as a label-free imaging modality with a spatial resolution of 25–60 nm to investigate the role of the essential biofilm protein TasA. To understand how tasA deletion affects the biofilm 3D architecture, we developed a biofilm-in-capillary workflow using B. subtilis WT and ΔtasA strains as examples. By 3D imaging, we investigate (i) the collective patterning of bacterial cells in biofilms, (ii) changes in ECM distribution, and iii) phenotypical changes of individual bacteria in suspension.
During the process of data acquisition, a set of X-ray projection images (shadows) are collected at different rotation angles around a cylindrical sample represented by a very narrow capillary (typical tip diameter 10–12 µm). Each data acquisition is followed by 3D reconstruction which generates a volume of a specimen with a resolution that may approach 25–60 nm.
SXT operates in the “water window” of the electromagnetic spectrum, exploiting the range between carbon and oxygen absorption edges (4.4 nm to 2.3 nm wavelength) for natural contrast of carbon-rich materials and transparency of oxygen-rich aqueous media23,24. In this energy range, photoelectric absorption is the most dominant process, such that the concentration of chemical species relates to the attenuation of X-rays by the Beer-Lambert law, (I(z)={I}_{0}{e}^{-{rm{mu }}z}), where (mu) is the linear absorption coefficient (or shortly LAC) of the material with thickness (z). Scattering in the “water window” energy range is negligible hence the LAC is approximated as ({rm{mu }}(E)approx frac{{rho }_{m}{N}_{A}}{A}), where ({rho }_{m}), ({N}_{A}), and (A) are the mass density, Avogadro’s number and the atomic mass number, respectively25. As a constant X-ray energy of 530 eV is used, the LAC measurement is a function of molecular composition (atomic number and mass) and concentration (mass density). This unique quantitative nature of SXT has been employed to distinguish cellular organelles26,27,28, to detect variations in DNA packing29, and to study states of viral replication30. As an advantage, SXT does not require labeling, fixation, or staining, enabling the unperturbed investigation of hydrated cells. As full-rotation SXT relies on using capillaries, full-rotation SXT has not yet been applied to imaging cells within colonies or tissues.
In this work, we develop a “biofilm-in-capillary” growth method compatible with full-rotation SXT of up to 200 μm-thick biofilms with a spatial resolution of 50 nm. Using a machine learning approach, we incorporate single-cell and ECM segmentation for systematic analysis of individual cell phenotypes, their spatial organization, and density of ECM. Employing SXT, we were able to detect and analyze the loss of cell orientation after deletion of tasA. Upon rescue with TasA protein, we could detect partial restoration of the ECM structure. We explore correlated changes in ECM structure and cell phenotypes and discuss the role of TasA in biofilm formation. Altogether, we show that the developed biofilm-in-capillary full-rotation SXT workflow is an efficient method for the visualization and analysis of biofilms at the subcellular level under varying conditions.
Results
Biofilm-in-capillary workflow, applied to B. subtilis
To optimize the experimental conditions for full rotation SXT, we developed a workflow that allows B. subtilis to form biofilms inside thin-walled glass capillaries (Fig. 1a), while ensuring that oxygen and our standard medium, ‘Medium optimal for lipopeptide production’ (MOLP), are provided31,32. Starting from a standard B. subtilis culture in Luria-Bertani (LB) medium, we inoculated a 6-well plate with the bacteria diluted in MOLP medium, containing the appropriate antibiotics, and incubated it without shaking for 2 h at 30°C. Subsequently, a portion of the bacteria diluted in MOLP was filled into specially manufactured glass capillaries with a thin tip of 10 µm in diameter. These capillaries were then placed with the large open end into the wells of the 6-well plate (the set-up is displayed in Fig. 1b and Supplementary Fig. 1). This incubation strategy created a stable, moist environment for the bacteria to form a biofilm within the very top of the capillary after 22–44 h of incubation time. The biofilm was also directly visible on the surface of the plate wells thanks to its characteristic pattern (Fig. 1b), consisting of an assembly of wrinkles.
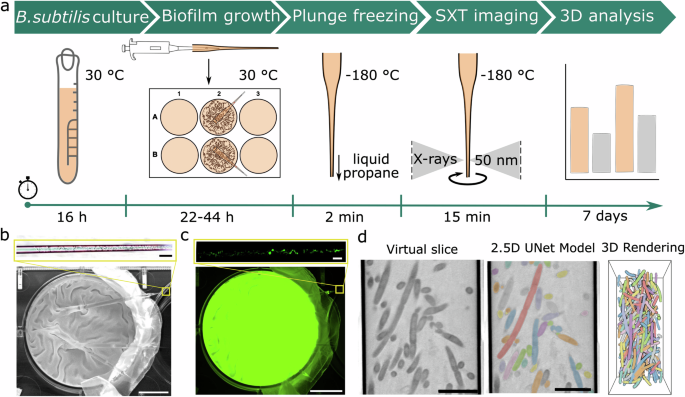
a ‘Biofilm-in-capillary’ workflow steps are presented in a timeline. b Brightfield and c fluorescent maximum projection images of GFP-expressing WT biofilm grown within the glass capillary (top image) and wells in which capillaries were incubated (bottom image) after 22 h incubation of the B. subtilis strain BKD211, which can synthesize fluorescent GFP protein (see strain list in Methods). The folded structures made on the biofilm surface can also be shown inside the glass capillary. The scale bars on images from the well plate are 8.5 mm. The scale bars on images from the capillary are 40 μm. The enlarged regions at the top of (b, c) show images of biofilms formed within capillaries as indicated by yellow boxes. These images show capillary and GFP-expressing cells inside. d For quantitative analysis of 3D morphometrical parameters of single bacteria and ECM fragments upon building biofilms, a neural network (2.5D UNet) supported by the Dragonfly software34 is trained on so-called virtual slices, which corresponds to a single plane of 32 nm thickness from the 3D SXT dataset. After automatic segmentation, the biofilm structure is segmented and rendered in 3D, as shown here with individual colors for each bacteria cell. Images are scaled at 5 μm.
The formation of biofilms within the capillaries was examined by light microscopy (Fig. 1b top and Fig. 1c top), including in vivo imaging of GFP-expressing B. subtilis BKD211. Supplementary video 1 shows an example of individual bacterial cells migrating to the open tip of the capillary while other bacterial cells are stationary. Capillaries with detectable biofilm in the tip were cryo-preserved with a robotic plunge-freezer and imaged with the soft X-ray microscope as previously described33. The covered region of the tip is approximately 150–155 μm long. In this area, several series of SXT projection images are taken, from which 3D volumes containing the whole biofilm inside the capillary are calculated. The reconstructed volume was automatically segmented by the 2.5D U-Net model (Fig. 1d), available as part of the Dragonfly software (version 2022.2)34. By segmenting the bacterial cells and the ECM, the biofilm structure was analyzed at both the single-cell level and gross morphology.
The established biofilm-in-capillary workflow enables the growth of bacterial biofilms from aerobe bacterial cells, compatible with high-resolution 3D imaging by SXT.
TasA gene deletion leads to loss of cellular orientation and ECM compaction
At first, we applied the developed workflow to investigate wild-type B. subtilis biofilms. Such biofilms have a thickness of several hundreds of μm, with expected changes in their structure depending, for example, on oxygen concentration35,36. For this reason, we measured a considerable distance over the capillary length by collecting multiple fields of view (FOVs) (Fig. 2a). The concomitant change of capillary diameter starting from the open tip was compensated for by gradually decreasing the magnification of the microscope and thus FOVs along the capillary length30. The acquired FOV close to the tip of the capillary had a starting dimension of 15 μm × 15 μm (see FOV 1 in Fig. 2b, e). Continuing data collection along the length of the capillary for about 150–155 μm (Fig. 2a, d), the FOV dimensions gradually increased from 15 μm to 17 μm for the last FOV (FOV 9 in Fig. 2b). Examples of 2D virtual slices obtained from the reconstructed tomograms are shown in Fig. 2b. The tomographic collection and reconstruction were then followed by segmentation and 3D rendering of individual bacteria and ECM, yielding the three-dimensional representation of the biofilm shown in Fig. 2c (top). The individual features of the ECM are shown separately in Fig. 2c (bottom).
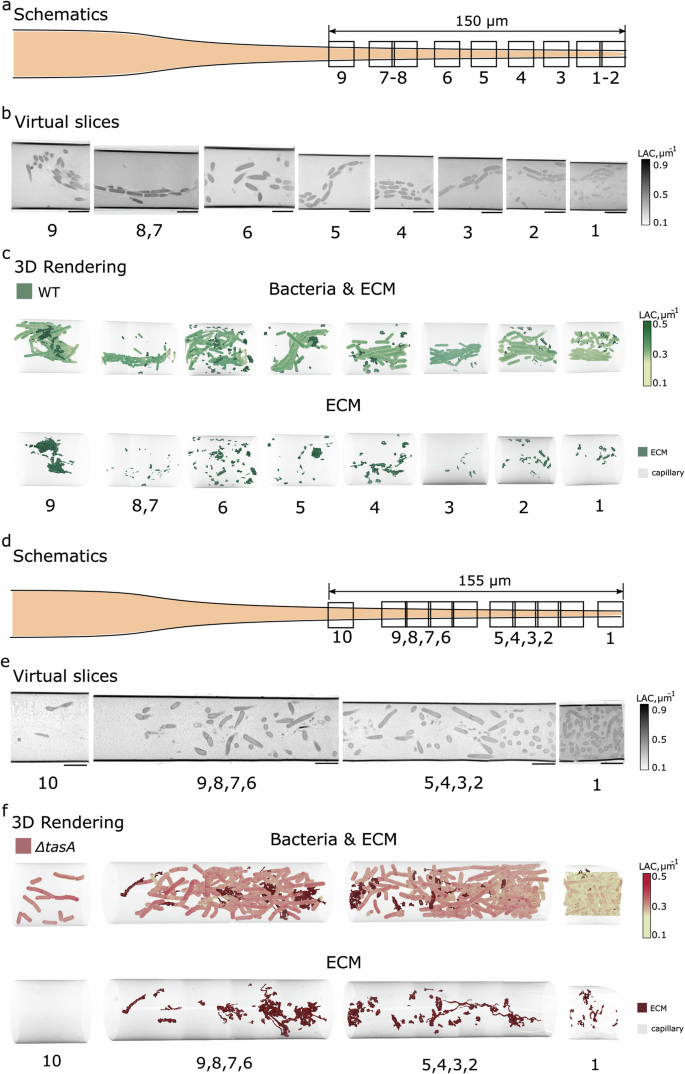
a Schematic of SXT imaging of WT B. subtilis BKD211 biofilm (t = 22 h). The biofilm extends up to 150 μm from the open capillary tip, as measured from the dimensions of the FOVs. b Two-dimensional virtual slices of FOVs 1-9 capture an oriented distribution of the bacteria along the glass capillary. Images are scaled at 5 μm. c 3D renderings of bacteria reveal the structured, helix-like, orientation of the bacteria along the capillary. The ECM fragments (dark green) show an uneven distribution of foam-like substructures along the capillary. d Schematic of SXT imaging of ΔtasA B. subtilis BKD230 biofilm (t = 22 h). The biofilm extends up to 155 μm from the open capillary tip of 10 μm width. e Two-dimensional virtual slices of FOVs 1-10 capture a loss of collective distribution of the bacteria along the glass capillary. Images are scaled at 5 μm. f 3D renderings of segmented bacteria reveal the loss of structured orientation of the ΔtasA bacteria along the capillary. The ECM fragments (dark red) show string-like structures that increase their volume along with the bacteria density. The renderings of the bacteria and ECM were done separately to enhance visibility of the structures. The colorbars on the right show LAC values used in rendering bacterial cells. ECM was visualized as surface view. Quantitative LAC values of cells and ECM are in Supplementary Table 1.
Figure 2c (top) shows the bacteria clustering in tightly aligned patterns37, especially in FOVs 1,2,3, 4, and 8, with few ECM conglomerates inside the long, extended clusters (Fig. 2c, bottom). The compactness and order of the bacterial alignment are striking. At the same time, FOVs 3,5,7, and 9 show chaining, apparent from turns of connected bacteria, see Supplementary Video 2 for a full 3D rotational view. These are the hallmarks of a biofilm in its early phase38, in agreement with the growth time of 22 h. Figure 2c (bottom) shows the distribution of the ECM, which is more spread than in those FOVs that show intense clustering of bacteria.
Similar to the wild-type B. subtilis BKD230 with deleted tasA gene, termed ΔtasA (see strain list in Methods) was visualized in a series of SXT volumes taken along the tip of the capillary (Fig. 2d–f). As no patterning along the tip was visible, the FOVs were acquired with overlap to enable whole volume visualization. In this case, it appears that the cells are no longer arranged in an organized chain fashion (Fig. 2f top, Supplementary Video 3), they rather adopt random orientations. We conclude that TasA increases the level of biofilm organization. At the same time, larger areas filled with ECM are observed that sometimes show elongated, filament-like structures (Fig. 2f bottom).
The above observations were followed up by a quantitative analysis at the cellular level. We compared the volumes, shapes (measured by aspect ratio), and density of individual bacterial cells. To ensure that tasA deletion is the sole factor that affects cellular phenotype in biofilms, we studied B. subtilis WT and ΔtasA cells grown under constant shaking conditions as typical for bacterial cultures without biofilm growth (Supplementary Fig. 2). For this purpose, fresh, agitated cultures were filled into capillaries and immediately cryo-preserved (Supplementary Fig. 2). These individual cell suspensions are denoted as t = 0 in data analysis. The observed phenotype of single cells was then compared to the situation at t = 22 h, see for both wild-type (BKD211) (Fig. 3a) and ΔtasA (BKD230) (Fig. 3b) cells. All measurements, that is bacteria’s volume, LAC, aspect ratio and ECM’s LAC are summarized in Supplementary Table 1.
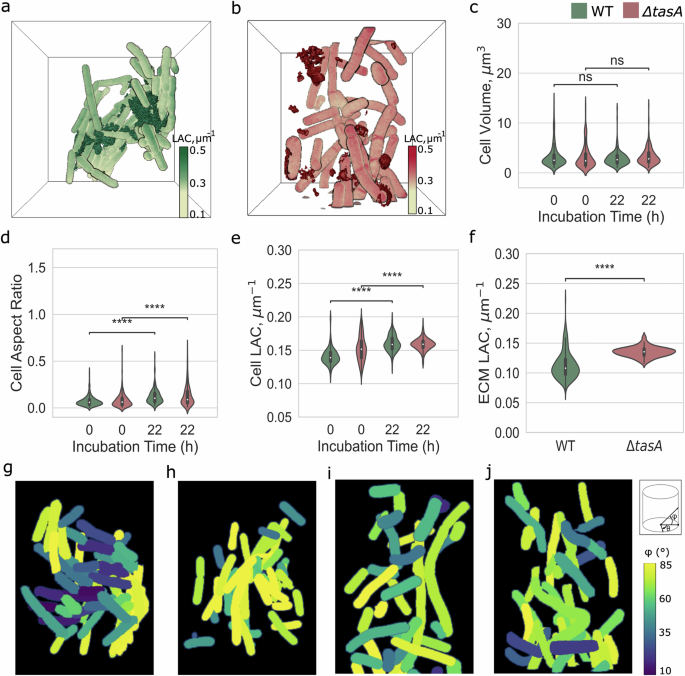
a 3D rendering of biofilms for WT (FOV 9; Fig. 2c)and b ΔtasΑ (FOVs 2–5; Fig. 2f) in a bounding box. The foam-like ECM (dark green) is wrapping the bacteria into a helix-like structure, while the thread-like ECM (dark red) is not attached to the bacteria and has no spatial orientation. The LAC is scaled from 0.1 μm−1 to 0.5 μm−1. Time-dependent comparison of cellular characteristics of single-cell bacteria (t = 0 h) to biofilms (at t = 22 h) for WT (BKD211) (green) and ΔtasA (BKD230) (red) genotypes is probed for c cell volume (μm3), d aspect ratio, and e LAC (μm−1). f X-ray LAC analysis of secreted ECM fragments. The bacteria orientation inside the capillary is measured by their orientation to θ° and φ°, as sketched top right in (j). The φ° shows orientation along the capillary and the θ° is perpendicular to the capillary length. Here is presented the φ° that bacteria acquire at WT (g, h) and ΔtasA (i, j) biofilm. Colors for φ° are scaled from 10° to 85°. Statistical analysis performed in t-test independent samples with Bonferroni correction, p-value (p) ns: 0.05 < p ≤ 1.00, (*): 0.01 < p ≤ 0.05, (**): 0.001 < p ≤ 0.01, (***): 0.0001 < p ≤ 0.001, (****): p ≤ 0.0001, with sample-size (n) for cell analysis, n = 356 (WT, t = 0 h), n = 254 (ΔtasA, t = 0 h), n = 201 (WT, t = 22 h) and n = 261 (ΔtasA, t = 22 h), respectively.
We observe that the average volume of B. subtilis cells is about 3 μm3 and does not change with tasA deletion, both in suspension and under biofilm growth conditions, see Fig. 3c. While this average volume is not associated with the shape difference of bacteria grown in suspension, upon the formation of biofilm, cells become less elongated in comparison to cells grown in suspension condition, where the aspect ratio of cells increases from 0.07 ± 0.05 to 0.12 ± 0.07 in WT for t = 0 and t = 22, respectively; and from 0.08 ± 0.07 to 0.13 ± 0.11 for the same time points of a ΔtasA culture (Fig. 3d, Supplementary Fig. 2d). The differences in cell elongation as a consequence of defective cell division have been reported for cells in biofilms of Pseudomonas aeruginosa39. The changes in average volume and aspect ratio of cells are accompanied by a slightly increased LAC of WT cells from 0.14 ± 0.01 μm−1 to 0.16 ± 0.01 μm−1 for t = 0 and t = 22, respectively, whereas for ΔtasA (see Fig. 3e and Supplementary Fig. 2e) no significant difference was observed with corresponding values of 0.15 ± 0.02 μm−1 and 0.16 ± 0.01 μm−1. Such an increase in the X-ray absorption of the WT bacterial cells when building the biofilm indicates an increase in molecular density, which can be explained by metabolic changes. For example, enhanced protein and lipid oxidation have been previously observed for ΔtasA strains40. To understand whether the deletion of tasA contributes to the difference in composition of the secreted ECM, we compared the mean LAC of ECM fragments between the WT and ΔtasA B. subtilis strains (BKD211 and 230). From the statistical analysis, we observe that the lack of the tasA gene results in chemically denser ECM fragments with a LAC of 0.14 ± 0.01 μm−1 as compared to 0.11 ± 0.02 μm−1 for WT. This 10% density increase may be attributed, for example, to an increased number of carbon-rich proteins and sugars. Along these lines, the higher chemical density of ECM fragments in the case of ΔtasA might be caused by the elevated secretion of exopolysaccharides (EPS), due to cellular stress or increased reactive oxygen species (ROS) production of mutant cells40.
To analyze the organization of biofilms in more detail, we analyzed cell orientation along (φ°) and perpendicular (θ°) to the capillary directions (see Fig. 3g–j and Supplementary Fig. 3 for all FOVs). Assemblies of WT cells in biofilm show complex architectures along the tip of the capillary where in certain regions the neighboring cells take identical orientation, see representative FOV in Fig. 3g. The similarity in angular orientation together with chaining of bacteria results sometimes in a spiral geometry of biofilm. This suggests that during the growth of biofilms chains of bacteria search for orientation towards the oxygen-rich surface in a spiral, concerted manner as also visible in FOV 5 of Fig. 2c, for example. Similar patterns were observed in B. subtilis and P. aeruginosa, where turbulent flow forms in the tube and a zone of clearing appears below the air-liquid interface just before the formation of the pellicle, but only in strains that have flagella41. These highly ordered regions are intercepted by regions of no order (Fig. 3h), confirming the growth pattern of biofilms with varying ordered and disordered regions. On the contrary, in biofilms of the ΔtasA strain, all FOVs lack signs of ordered cell orientation, whether along or perpendicular to the capillary (Fig. 3i, j, Supplementary Fig. 3).
Supplementing TasA protein to ΔtasA cultures restores biofilm morphology
Previous studies have shown that an external addition of TasA protein to cultures of ΔtasA bacteria restores the biofilm7,10,42,43 over 48 h at 30°C10. We investigated this by applying our biofilm-in-capillary workflow over 44 h to understand the 3D organization of such biofilms that are formed after the addition of TasA protein. In the capillary setup, biofilms of ΔtasA cultures formed after the addition of TasA show in principle the same morphology though not as pronounced as for WT B. subtilis (Supplementary Fig. 4 in comparison to Fig. 1b). In Fig. 4a, a representative FOV from SXT imaging of the ΔtasA culture shows a random arrangement of cells. The corresponding culture with TasA added (Fig. 4b) shows a compact cellular assembly, likely supported by the extended matrix. This packing of cells is similar to the wild-type biofilm but different to the ΔtasA situation shown in Fig. 4a. An extended chaining as displayed for WT biofilms in Fig. 2c is however not observed in the various FOVs of rescued biofilm.
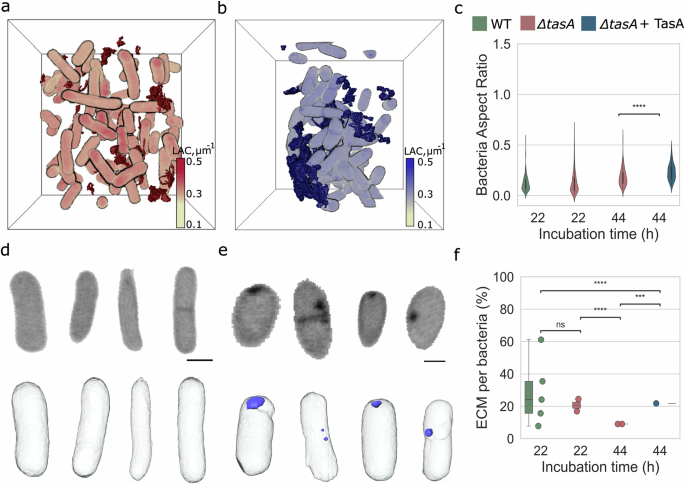
a, b 3D rendering of the ΔtasA and ΔtasA (BKD230) treated with TasA (t = 44 h) biofilm fragment in a bounding box. The ECM (dark red) fragments keep the same string-like structure as ΔtasA (t = 22 h) biofilm, whereas the ECM fragments (dark blue) of ΔtasA cultures treated with TasA become denser. The LAC is scaled from 0.1 μm−1 to 0.5 μm−1. c Bacteria shape becomes significantly rounder upon TasA addition in ΔtasA (t = 44 h). d, e The shape change is also visible in virtual slices and 3D renderings of individual bacteria from ΔtasA and ΔtasA + TasA cultures. Subcellular round and dense structures, here named “punctae” (light blue), are present in every treated with TasA bacterium. The scale bar is 1 μm. Virtual slice grayscale in LAC is from 0.1 μm−1 to 0.5 μm−1. f The extracellular addition of TasA restores by 13% the ECM volume per number of bacterial cells as measured through SXT modality). Every dot represents each FOV considered for this analysis. Statistical analysis performed in t-test independent samples with Bonferroni correction, p-value (p) ns: 0.05 < p ≤ 1.00, (*): 0.01 < p ≤ 0.05, (**): 0.001 < p ≤ 0.01, (***): 0.0001 < p ≤ 0.001, (****): p ≤ 0.0001, with sample-size (n) for cell analysis, n = 201 (WT, t = 22 h), n = 261 (ΔtasA, t = 22 h), n = 131 (ΔtasA, t = 44 h) and n = 98 (ΔtasA + TasA, t = 44 h), respectively.
From the quantitative analysis (see also Supplementary Fig. 5), the most striking effect at the cellular level is the change in cell shape (see Fig. 4d, e). The ΔtasA cells treated with TasA acquire a spherical shape, measured by an increase of aspect ratio from 0.19 ± 0.01 in ΔtasA cultures to 0.24 ± 0.08 in biofilms of ΔtasA supplemented with TasA (see Fig. 4c). This phenotype differs from the elongated WT cells (see Fig. 3c). The biochemical density of the ΔtasA cells without supplement and in the biofilm occurring upon supplementation with TasA has significantly decreased to 0.15 ± 0.02 μm−1 from 0.16 ± 0.01 μm−1, respectively (see Supplementary Fig. 5c). Surprisingly, most cells in the cultures containing TasA contain dense spherical structures, that we call “punctae”, with the LAC of 0.60 μm−1, see Fig. 4e. While we have no precise information on the content and origin of these “punctae”, the LAC values suggest that the puncta contain a high amount of lipids, based on reported LAC for organelles in bacterial cells44,45.
To evaluate the level of ECM restoration by extracellular TasA, we measured the biochemical density of ECM fragments, see Fig. 4f. In ΔtasA cultures treated with TasA, the ECM density (0.11 ± 0.01 μm−1) shows no difference in comparison to cultures containing untreated ΔtasA cells (0.10 ± 0.01 μm−1). Altogether, our data shows that the addition of extracellular TasA does not restore the phenotype of bacterial cells in biofilms including the ordered structure of cells in the biofilm. However, adding TasA to the growth media of the cells partially restores the composition of ECM.
Discussion
A “biofilm-in-capillary” workflow enables analysis of bacterial biofilms and quantitative measurements on both the subcellular and macroscopic size scales in a physiological state using full-rotation SXT. The workflow was validated on GFP-expressing B. subtilis biofilms for visualization of structural phenotypes and biochemical density of single cells and ECM within biofilms formed. The bacterium Bacillus subtilis is one of the best-studied model organisms for investigating biofilm formation. In addition to exopolysaccharides, B. subtilis biofilms contain TasA as a major proteinaceous matrix component which is required for matrix formation, protection against oxidative stress, interaction with the membrane and it can also act as a developmental signal stimulating a subset of biofilm cells to revert to a motile phenotype40,46.
We, therefore, have focused on 3D imaging of WT B. subtilis biofilm and compared it to cultures of ΔtasA cells, restoring also the complex architecture of biofilms by addition of TasA protein. By use of full-rotation tomography and automatic segmentation based on machine learning, we were able to detect subtle differences in cellular phenotypes and ECM at statistically significant sample sizes. We could show that deletion of the tasA gene affects bacterial cells grown in suspension differently in comparison to the same bacteria during biofilm formation upon TasA supplementation. We observed significant changes in cellular elongation and chemical density as measured by soft X-ray absorption when B. subtilis cells are grown in biofilms. At the macroscopic level deletion of tasA leads to loss of cellular orientation. The extracellular addition of TasA protein to ΔtasA cultures partially restores the biochemical density and volume of the ECM; on the other hand, the cell organization and their phenotype are not rescued, suggesting complex functions in cellular metabolism and motility upon biofilm formation. Interestingly, based on high-spatial-resolution and sensitivity to chemical density, we were able to detect accumulation of lipids within ΔtasA cells upon TasA supplementation.
While we showed that biofilm-in-capillary workflow enables imaging of B. subtilis biofilms at high-spatial resolutions, it would be interesting to apply our approach to other types of biofilms, including those consisting of multiple species47, and interactions with artificial additives to biofilms48, for example, nanoparticles49. A potential extension of the proposed workflow would be localization of specific proteins by correlative fluorescence microscopy. Such correlation of structural information provided by SXT with functional aspects of specific proteins visualized via fluorescence microscopy has been demonstrated by several groups50,51,52,53.
Overall, due to high sensitivity to biochemical content SXT imaging combined with biofilm-in-capillary workflow enables unprecedented visualization and quantitative analysis of cells and ECM distribution within a 3D volume of biofilms. The combination of subcellular resolution and density measurements in 3D will provide better insights into the biofilm formation and microenvironment.
Methods
Bacterial strain and culture conditions
The wild-type and ΔtasA bacteria derive from the B. subtilis DK1042 strain based on pBS32-containing wild-type (ancestral 3610 strain), which encodes a ComI variant with a Q-to-L change at codon 1254, see Tables 1 and 2 for the full list of primers and strains. For the integration of gfp-mut2 into the amyE locus under the control of Phyperspank, the gene and backbone (pDR111) were amplified by PCR. The plasmid was constructed using HIFI assembly (NEB #E2621). Transformations into B. subtilis wild-type (DK1042) and ∆tasA (tasA::kan) was performed as described previously9. Positive clones were selected on 150 µg/ml spectinomycin, and integration validated by PCR and sequencing.
Bacteria cultures were grown from frozen stocks on Luria-Bertani (LB: 1% tryptone, 0.5% yeast extract, and 1% NaCl) at 30°C. After inoculation, bacteria were cultured overnight in LB medium at 30°C under shaking at 160 rpm. Before performing biofilm assays, bacteria were subcultured in 1:100 concentration and left to cultivate to 1.0–1.2 optical density (OD) for 4–5 h. Biofilm formation was promoted by bacteria growth in the Medium optimal for lipopeptide production (MOLP)10,32: 30 g/L peptone, 20 g/L saccharose, 7 g/L yeast extract, 1.9 g/L KH2PO4, 0.001 mg/L CuSO4, 0.005 mg/L FeCl3.6H2O, 0.004 mg/L Na2MoO4, 0.002 mg/L KI, 3.6 mg/L MnSO4.H2O, 0.45 g/L MgSO4, 0.14 mg/L ZnSO4.7H2O, 0.01 mg/L H3BO3, 10 mg/L C6H8O7, adjusted to pH 7.0, for 22–44 h at 30°C32.
It should be noted that the ability of MOLP to facilitate B. subtilis pellicle biofilm formation might be connected to its capability to support Lipopeptide production, since Surfactin has been shown to be involved in many different aspects related to biofilm formation3,55,56.
The final concentrations of antibiotics for B.subtilis bacteria, grown in either LB or MOLP medium, were 150 μg/mL spectinomycin (WT) and 10 μg/mL kanamycin (both ∆tasA). To inspect biofilm growth success inside the glass capillaries, bacteria were induced with 1 mM Isopropyl β-d-1-thiogalactopyranoside (IPTG) added to the MOLP medium to produce GFP.
Single-cell-in-capillary workflow
Before seeding the wild-type and ΔtasA bacteria for biofilm assay, we collected approximately 2 × 10⁶ bacteria/mL of each culture in an Eppendorf tube, which was spun down at 100 × g for 3 min and resuspended in 20 μL of LB medium. The bacteria suspension was injected into thin-walled glass capillaries with an open tip of 9–10 μm width and cryopreserved as described below.
Biofilm-in-capillary growth workflow
To promote biofilm formation into glass capillaries (32 × 1.5 × 1.05 mm, OD 1 ± 0.05, Hilgenberg GmbH), we prepared the following setup (Supplementary Fig 1): a 6-well plate with the middle cavity walls wrapped in decontaminated parafilm and two spacers taped at the side of the plate. When the bacterial culture reached the optimal cell density, the wild-type and ΔtasA were seeded in the 6-well plate with 1:100 concentration in the MOLP, supplemented with antibiotics and IPTG. For the rescue experiment, TasA28-261 protein in 20 mM NaH2PO4 /Na2HPO4 buffer pH 7,0 with 150 mM NaCl, was added to a final concentration of 200 µg/ml (8 µM) to MOLP. Bacteria were allowed to cultivate in biofilm formation setup for 2 h at 30°C, and then, 20 μL of the bacteria-in-MOLP suspension was injected into 6 glass capillaries, with an open tip of 9–10 μm, per condition. Each capillary, after being filled up with bacteria in MOLP, was supported to stand by middle cavity walls wrapped with parafilm, and the spacers kept a safe distance between the capillary tips and the plate lid. To sustain the humidity levels desirable for the B.subtilis biofilm formation, we wrapped the 6-well plate with wet towels in a sealable plastic bag and incubated for 22–44 h at 30°C.
In the course of the rescue experiments, it was noted that different recombinant TasA preparations support biofilm formation to a different extent. Older preparations, frozen or stored at higher concentrations support biofilm formation better than freshly prepared monomeric TasA. Overall, we have performed 3 independent experiments, with 2–3 replicas of biofilms per experiment and about 58 SXT tomograms taken.
Light microscopy
Before proceeding with cryo-SXT, we inspected the quality of the plates and capillaries containing biofilms. For the inspection of the biofilm grown into the 6-well plates, we imaged the plates at a Fusion FX device (Vilber) with 120 ms exposure time. To examine the biofilm growth into the capillaries, we acquired a time-lapse of bacteria forming biofilm close to the tip, at 320 s exposure time for 500 ms with a 488 nm laser and a 20x objective, by an inverted (Carl Zeiss AxioVision CD25) epi-fluorescence microscope. The in vivo imaging occurred in the National Laboratory for X-ray Tomography (NCXT) at Lawrence Berkeley National Laboratory, USA.
Cryo soft X-ray tomography
The capillaries containing biofilms were rapidly frozen by immersion in liquid propane cooled with liquid nitrogen (~ −90°C). Soft X-ray tomographic data were acquired through full-rotation imaging using the soft X-ray microscope, XM-2, at the National Center for X-ray Tomography, housed at the Advanced Light Source of Lawrence Berkeley National Laboratory in Berkeley, CA (https://ncxt.org/). To prevent radiation damage, cells were exposed to a stream of liquid-nitrogen-cooled helium gas during the data collection process. Each dataset involved the collection of 184° rotation tomographs57, with one projection image captured per 2° angle26,33. The automatic reconstruction software was employed for the automatic reconstruction of projection images into 3D volume58. This process combined the information from 92 slices over 184o around the capillary, followed by segmentation and 3D rendering, to visualize bacteria and biofilm in 3D.
Image analysis
The light microscopy images of biofilms grown into plates and capillaries were analyzed with the open-source Fiji software59. For the automatic segmentation of single bacteria, the reconstructed SXT datasets were submitted to the 2.5D UNet model, supported by DragonFly (version 2022.2)34. The ECM was segmented manually based on the pixel intensity threshold with Amira 2020.3.1 software. The 3D renderings of segmented single bacteria, ECM, and capillary walls were prepared with Amira. Bacteria and ECM detected close to the tip (FOV 1 in Fig. 2b, e) are excluded from the 3D quantitative analysis because this area is compacted with bacteria and there is a lack of contrast important for the ECM precise segmentation.
Statistical analysis
Statistical analysis and plots on 3D analyzed SXT datasets were prepared with Jupyter notebook, using the statannot package (https://github.com/webermarcolivier/statannot) to compute statistical tests (Student’s t-test) and add statistical annotations60. Figures were assembled with Inkscape 1.3 software.

Responses