Soil Radon Time Series from the Italian Radon Monitoring Network (IRON)
")
Background & Summary
Radon is considered an important marker of the physical phenomena taking place in the Earth’s crust involving dynamic transients and eventually fluid migration. Scientists have investigated crustal radon dynamics in light of seismic preparation processes and volcanic activity for decades1,2,3,4. Recently, laboratory experiments confirmed the evidence of a relation between the state of stress of a rock sample and the variations in its radon emanation properties, allowing to assess radon variability under controlled conditions5,6. Another important reason for studying radon is its potentially significant impact on human health: radon is classified as a class 1 carcinogenic agent and is regarded as the second leading cause of lung cancer after smoking7,8. Consequently, radon control and mitigation in residential buildings and workplaces is a primary safety issue9,10.
Radon measurement is based on alpha and gamma counting11. Radioactive detectors employed in IRON network currently represent the best efficiency and convenience fluid monitoring method with respect to other non-radioactive gas detecting apparatus. IRON network12 started in 2009 with the installation at Campoli Appennino of the first operating station (CMPL) and it consists at the end of 2021 of 62 stations (see Table 1). Afterwards it has been mainly developed and implemented in synergy with Italian National Seismic Network13, as wells as EPOS TABOO14 and LabCas15 near fault natural laboratories. Since 2018, the network extended to the Neapolitan volcanic area, where 7 stations have been implemented so far. Currently, IRON can be considered a rare example of a monitoring network recording long term continuous soil radon emanations on a regional-scale (Fig. 1).
")
Layout of IRON network, as of December 2021.
Methods
This section is dedicated to provide basic information on detectors and installation sites, for a direct use of IRON data16. Further details on the nationwide permanent network containing descriptions of installation types, employed instrumentation and first analysis of performance can be found in literature12,17, along with the calibration features, and the test and correction procedures.
In the following, the spatial distribution and the type of installation, the employed instruments, and the sensitivity and accuracy of each detector are specified.
The spatial distribution of the different types of IRON network instruments installed until 2021 is shown in Fig. 2a). The network includes five main installation typologies, whose distribution and percentage is shown in Fig. 2b), in all of which soil gases reach the instrument passively:
-
Borehole: the instrument is installed in a small (<2 m deep) borehole. In some cases there is a proper deep well and generally in this configuration the instrument is located at the head well;
-
Cavity: the instrument is placed inside a tunnel or underground cavity, such as aqueducts, tunnels or mines, if possible just after the entrance;
-
Indoor: the instrument is located in the basement of a building, typically in a closed technical room not usually accessed by people;
-
Shelter: the instrument is co-located in a small shelter with a seismic and/or geodetic station belonging to another monitoring network;
-
Soil: the instrument is installed in environments where soil gas reaches it passively from a probe partly deepened into the soil; generally this type of installation is placed alongside one of the other types described for comparison purposes.
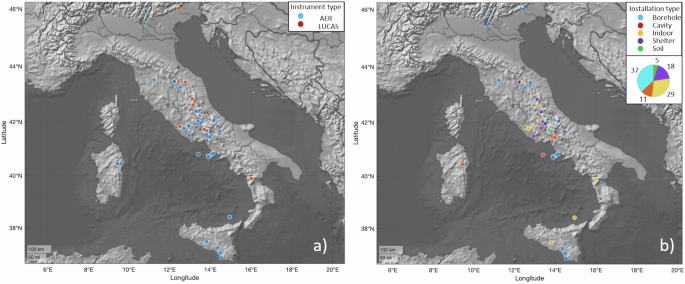
Layout of IRON network, as of December 2021. Each colored dot represents a station. (a) The blue and red dots correspond respectively to the AER and LUCAS instruments installed in the 62 stations. (b) Different color dots correspond to different typologies of installation (in the inset percentage of different types of installation used in the network).
The instruments are often co-located with seismic, geochemical, geomagnetic or tiltmeter sensors belonging to other monitoring networks.
As previously mentioned, until the end of 2021 the two types of instruments installed were AER and LUCAS detectors. AER-Plus and AER-C, two small sized commercial solid-state radon detectors by Algade© (http://www.algade.com/), provide measurements and local data storage for time, radon, temperature and relative humidity. The radon gas enters the detector by diffusion through a membrane that blocks short-lived radon decay products or atmospheric particulate matter, avoiding contamination and permitting to track relatively rapid changes in radon concentration. The AER-C version may transmit data by Internet of Things (IoT) Sigfox protocol (https://www.sigfox.com/en) to the Algade© server, that can be accessed via a client. Otherwise, AER has been assembled in a in-house developed unit (called MIRAD), properly designed to recover and transmit data by means of the LAN-internet gateway18. There are two versions of AER instruments that can be battery-supplied with autonomy of up to one year or, alternatively, AC powered. A GEWISS box and silica gel are employed to protect the instrument from water or humidity excess. The sensitivity of the instrument is approximately 15 Bq/m3 for each pulse/h. The acquisition time can be set to 15, 30, 60, 120 or 240 minutes. The instrument is recommended to operate at a temperature range of 0°C–40°C, and at relative humidity <80%; however, even at humidity values close to 100%, its correct performance has been tested and verified17.
Concurrently, an INGV proprietary instrument has been realized; based on an alpha scintillation detector (a Lucas Cell), it integrates a front-end electronics for pulse shaping. Radon enters the detector by diffusion through an inlet filter that traps radon daughters. For 500 mL scintillating flanks, sensitivity is typically in the range 0.24-0.28 Bq/m3 × Imp/h, while minimum detectable concentration is 3-6 Bq/m3 depending on electronics and variations in deposition of the scintillating material (ZnS) in the Lucas Cell. The acquisition time can be set in the range 15 – 240 min, the minimum time being solely suggested for counting statistics reasons; data can be recorded locally and uploaded to a PC by a RS232 port (stand alone mode) or the instrument can be equipped with a MIRAD unit, so data can be stored remotely and accessed via a client. The electronics is enclosed in a Polybutylene Terephthalate (PBT) waterproof equipment case. In stand alone mode, due to an average consumption of 2VA, it is powered by a 220VAC/12VDC transformer, but an optional lead battery used as a buffer allows for an autonomy of approximately one day. No restrictions on operating at relative humidity of 100%.
Owing to the rapid evolution of IRON network in terms of instrumentation and different types of installation, an increasingly large number of continuous measurements started to be available soon after the first installation. In 2016, a database allowing access to all the collected data and to keep track of the network evolution was implemented on a MySQL platform19, further developed in PostgreSQL20 (see section in “Data Records” section).
Data Records
Data and auxiliary metadata can be found in the Figshare repository16.
Data16 are organized into CSV files: more specifically there are two .csv files for each station: one for radon data and the other one for meteorological data. The first one includes the following columns:
-
“Date”: containing date and time of radon acquisition;
-
“Rn (Bq/m3)”: containing radon concentration values;
-
“Rn corrected (Bq/m3)”: containing corrected radon values after calibration for instrument humidity effects, as described below;
-
“Rn Instrument”: containing the type and the serial code of the instrument;
-
“Source”: specifying if such value has been downloaded from the instrument or from the web.
The second file includes the columns “Date” and “Source” with the same meaning of the first one but including also the following three columns.
-
“Temperature (° C)”: containing temperature values;
-
“Relative Humidity (%)”: containing humidity values;
-
“Meteo Instrument”: containing the type and the serial code of meteorological instrument.
Technical Validation
As explained above, adopted instruments are tested in a radon chamber before being installed in sites to be monitored. The radon chamber is a device implementing a closed system, where a known quantity of radon can be introduced and in which the environmental conditions can be controlled and regulated. This allows to characterize the response of Algade©) AER instruments with respect to environmental parameters (mainly temperature and relative humidity) by providing correction factors as a function of the absolute humidity to be applied to the measured radon concentration, as well as to assess the sensitivity of Lucas based instruments in terms of (Bq/m3) per Counts per Minute (CPM).
Figure 3 shows the histograms with the percentage of data availability, broken down by source (instrument/website, as described in previous section). In particular, in the histogram on the left (instrument) the percentage was calculated as the number of counts acquired directly by the instrument divided by the maximum number of potentially acquirable counts for each station from the date of installation to December 2021. In the histogram on the right (website) the data availability is given as the number of counts transmitted from the instrument to the reference server divided by the maximum number of potentially transmittable counts for each station from the date of installation to December 2021. The two different types of instrument adopted until December 2021 (AER and LUCAS) are indicated with different colours. It has already been underlined that not all stations are equipped with remote transmitting instruments. In particular, stations with LUCAS instruments employed until December 2021 are not equipped with remote transmission (as is evident from the histogram on the right).
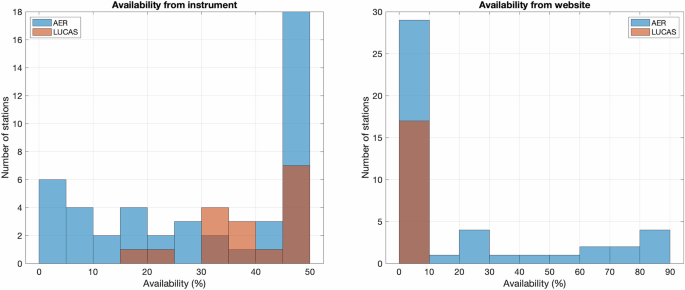
Data availability as a percentage of the number of acquisitions for each station from the installation date to December 2021, broken down by data source (instrument on the left and website on the right). Different colors stand for the two different types of instruments installed in the stations of IRON network.
Usage Notes
Further details regarding the database structure and data managing procedures can be found in20. However, there are two important aspects that need to be mentioned:
-
1.
One of the key database tables is designed to improve data quality by correcting for instrument humidity effects. As described in20, the correction model applicable to each instrument is not unique, rather it varies depending on the individual instrument and it is also influenced by a critical humidity threshold. This threshold delineates ranges of humidity levels, before and after which the correction model may differ. Typically, before deployment at a new IRON station, the instrument undergoes a calibration procedure in a laboratory facility to ascertain this threshold. During calibration, appropriate correction models and their associated coefficients are determined for data corresponding to humidity levels above or below this critical humidity17.
-
2.
IRON operators may download radon data directly from the instruments or from a website. In fact, some of the network instruments are capable of not only acquiring data but also transmitting them in real-time to the instrument producer’s website, where radon and meteorological parameter data are stored. Even if virtually website data should be identical to the ones collected in the instrument, there are occasional issues related to the instruments clocks, causing some data to lack the correct time reference. The online data, on the other hand, undergo correction during their publication through cross-checking with the server’s time, ensuring their accuracy. To address this, and to simplify the procedures for end users, we have implemented a procedure for verifying the date and time of instrument-downloaded data and, when necessary, automatically correcting them using the data from the website. Unfortunately, data publication is not continuous, and not all stored data are sent to the website. Therefore, we cannot solely rely on website data neither to tool’s data; instead, we need to merge data from both sources. As a result of this merging, sometimes data can be duplicated in the database or, due to web sites/tools imperfect synchronization, it is possible to have some data having the same radon values but measured in different date times. As a consequence, there is no way to refer to a single and unique time series data and additional actions are required to fix this issue. Unfortunately this fix is not always univocal and it can depend on user choices. For example, it’s possible to interpolate all data on a regular date time series or avoid one of the two sources when date time differ less than a specific chosen threshold. To allow users performing any kind of elaboration, we associated each single data row to the information about the source used to get that piece of data.
Provided data format can be easily opened using any standard software. To analyze the amount of provided data, both specific codes for time series analysis and more general software (for example an electronic spreadsheet) can be used.


Responses