Soluble receptors for advanced glycation endproducts are predictors of insulin sensitivity and affected by weight loss

Introduction
Advanced glycation endproducts (AGEs) are naturally produced during regular metabolic processes and aging. However, their levels are significantly elevated in conditions of obesity and hyperglycemia. AGEs play a pivotal role in triggering numerous proinflammatory cellular pathways by binding to their primary cell surface receptor, the receptor for advanced glycation endproducts (RAGE). This interaction leads to the disruption of adipose tissue physiology and exacerbates obesity-related metabolic dysfunctions and insulin resistance. Consequently, it heightens the susceptibility to developing type 2 diabetes [1,2,3].
In murine models, the pharmacological inhibition of the ligand/RAGE axis through soluble RAGE (sRAGE) has shown significant beneficial effects in preventing obesity, dysfunction of adipose tissue, and insulin resistance [1]. In humans, numerous studies have consistently demonstrated decreased circulating levels of sRAGE in individuals with obesity [2,3,4,5]. However, conflicting findings regarding insulin resistance and glucose tolerance have emerged [6,7,8]. While some investigations have indicated a negative correlation between circulating sRAGE and parameters such as HOMA-IR or glycemia [2,3,4,5], others have either found no association or even a positive correlation [6,7,8]. For instance, one study observed that in individuals with overweight and mild obesity, circulating sRAGE levels in those with newly diagnosed type 2 diabetes and prediabetes were comparable to those of controls and were not correlated with HOMA-IR [6]. In contrast, another study focusing on a lifestyle intervention (comprising supervised aerobic exercise and low-fat dietary counseling) in eight adults with morbid obesity, altered glucose tolerance, and chronic kidney disease, found that plasma sRAGE decreased concurrently with glycemia and exhibited an inverse association with insulin sensitivity [7]. Furthermore, in a study exclusively involving subjects with type 2 diabetes, serum sRAGE was positively correlated with fasting insulin and HOMA-IR [8].
Continuous glucose monitors (CGM) are wearable devices that record glucose levels in the interstitial fluid by measuring at regular and frequent intervals throughout the day and night [9]. These measurements generate dynamic information on the glycemic profile of the patients throughout some days, which is especially useful to assess glycemic variability in subjects with type 1 diabetes, and even in subjects with prediabetes and obesity-associated metabolic disturbances [10].
It is worth noting that previous studies have not explored the relationship between circulating sRAGE and systemic insulin sensitivity, assessed via the gold-standard hyperinsulinemic-euglycemic clamp [11], nor have they investigated the correlation between sRAGE and continuous glucose measurements. Given these gaps in the literature, our study aimed to fill this void by examining the association between sRAGE, insulin sensitivity, and continuous glycemia using hyperinsulinemic-euglycemic clamp and CGM, respectively.
Materials/subjects and methods
Participants’ recruitment
Cohort 1
From January 2016 to October 2017, a cross-sectional case-control study was undertaken in the Department of Diabetes, Endocrinology, and Nutrition (UDEN) Dr. Josep Trueta University Hospital (Girona, Spain). We included 180 consecutive subjects, 102 with obesity (BMI ≥ 30 kg/m2) participants, and 78 without obesity (BMI < 30 kg/m2), similar in age (age range of 28–66 years) and sex distribution (as detailed in Table 1). Participants exclusion criteria and insulin action measurement by hyperinsulinemic-euglycemic clamp technique were described elsewhere [12].
Cohort 2
Participants (N = 124, Table 1) were recruited in the UDEN between March 2019 and July 2022 as part of a prospective, non-interventional, case-control pilot study named “IRONMET + CGM” (C). Participants inclusion and exclusion criteria and continuous glucose measurements using Dexcom G6 CGM System were described elsewhere [10]. The low blood glucose index (LBGI) and high blood glucose index (HBGI) represent the frequency and extent of low and high blood glucose measurements, respectively [13]. J-value is a measure of the quality of glycemic control based on the combination of mean and standard deviation information, which is calculated as 0.001 × (mean + standard deviation) [14]. Longitudinally, a subgroup of forty-two participants with obesity was followed for twelve months. General counseling about a healthy diet was provided to all subjects, and in subjects with obesity, a diet providing a daily energy deficit of 500–800 kcal/d was explained. These subjects were followed every 4 months to monitor dietary compliance. In fourteen of these participants, weight loss was achieved through bariatric surgery intervention (4 vertical sleeve gastrectomy and 10 Roux-en-Y gastric bypass).
Samples and data from patients included in this study were provided by the IDIBGI Biobank (Biobanc IDIBGI, B.0000872), integrated into the Spanish National Biobanks Network, and they were processed following standard operating procedures with the appropriate approval of the Ethics Committee of Clinical Research (CEIm Girona) of the Dr. Josep Trueta University Hospital (Girona, Spain). To ensure blinding in outcome analyses, all samples were codified. The institutional review board–CEIm Girona–approved the study protocol, and verbal and written informed consent were obtained from all participants.
Anthropometric measurements and analytical methods
BMI, body composition, fasting glucose, insulin, lipid profiles, glycated hemoglobin (HbA1c), high-sensitivity C-reactive protein (hsCRP), and vitamin D, were described elsewhere [10, 12]. Plasma sRAGE concentrations were measured using HUMAN sRAGE ELISA kit (RD191116200R, Biovendor-Laboratorní medicína a.s., Brno, Czech Republic). This assay has been shown to be highly sensitive to human sRAGE with a sensitivity of 19.2 pg/ml. Intra- and inter-assay variations were both less than 10%.
Statistical analyses
Statistical analyses were performed using SPSS 12.0 software. Unless otherwise stated, descriptive results of continuous variables are expressed as mean and SD for Gaussian variables or median and interquartile range. Normality analysis was conducted using the Kolmogorov-Smirnov test. Unpaired t test was used to compare plasma sRAGE concentration according to obesity. The correlation between variables was analyzed using simple bivariate correlation analyses (Pearson’s and Spearman’s test) and multiple regression analysis. Receiver operating characteristic (ROC) curve analysis was used to determine the diagnostic potential. Levels of statistical significance were set at p < 0.05. Measures of glycemic variability were computed using MATLAB R2018a software (MathWorks).
Results
Cross-sectional analysis
In both cohort 1 and cohort 2, plasma sRAGE levels were significantly decreased in subjects with obesity (Table 1), negatively correlated with obesity measures (BMI, waist circumference, fat mass), fasting insulin, glucose, HbA1c, triglycerides and inflammatory markers (total WBC, hsCRP) and positively correlated with HDL-cholesterol and vitamin D (Table 2). In addition, plasma sRAGE was positively correlated with systemic insulin sensitivity (cohort 1, Fig. 1A), and with the percent time in glucose range less 100 mg/dl (TIR 1) and LGBI, but negatively with the percent time in glucose range between 126-140 (TIR 3) and 140-200 mg/dl (TIR 4), HGBI, J-value, glycemia median and IQR during CGM (cohort 2, Table 2 and Fig. 1B). Multiple linear regression analysis indicated that most of these associations were lost after adjusting by age, sex, and BMI. In cohort 1, plasma sRAGE was significantly associated with insulin sensitivity (p = 0.02) and fasting glucose (p = 0.01) after adjusting by age, sex, and BMI. In cohort 2, plasma sRAGE were significantly associated with fasting glucose (p = 0.006), TIR 3 (p = 0.04), glycemia median (p = 0.03) and HDL cholesterol (p = 0.001) after adjusting by age, sex, and BMI (Table 2).

A, B Bivariate correlation between plasma sRAGE and insulin sensitivity in cohort 1 (A), and between plasma sRAGE and % Time in TIR 1 and TIR 3 in cohort 2 (B). C ROC curve for plasma sRAGE in the prediction of insulin sensitivity in all participants from cohort 1. D Impact of weight loss on BMI, fasting glucose, HbA1c, plasma sRAGE and vitamin D levels.
ROC curve analysis for relevant parameters in the prediction of insulin sensitivity revealed that the area under the curve (AUC) for circulating sRAGE was 0.768 (0.696–0.841) (p < 0.0001, Fig. 1C). Interestingly, this was higher than AUC for HbA1c, fasting triglycerides or HDL cholesterol, but lower than BMI or hsCRP (Table 3).
Longitudinal analysis
In cohort 2, 42 subjects with obesity were evaluated longitudinally for 12 months, and baseline vs. follow-up parameters were compared (Table 4). At follow-up, a significant reduction in adiposity (BMI, waist circumference and fat mass) in association with fasting glucose and HbA1c was observed in all subjects. Interestingly, weight loss was also associated with increased plasma sRAGE and vitamin D levels (Table 4 and Fig. 1D).
Discussion
The present study reveals a noteworthy correlation between plasma sRAGE levels and insulin sensitivity, persisting even after adjustments for age, sex, and BMI. This association is further underscored by the robust link between plasma sRAGE and adequate glycemic control, as evidenced by correlations observed between sRAGE and fasting glucose levels in both cohort 1 and cohort 2, as well as CGM-related parameters in cohort 2. A previous study in mice [1] and current findings collectively suggest a possible role of sRAGE in maintaining glucose tolerance and insulin sensitivity (Fig. 2). Moreover, ROC curve analysis demonstrates that circulating sRAGE levels serve as a significant predictor of insulin sensitivity.
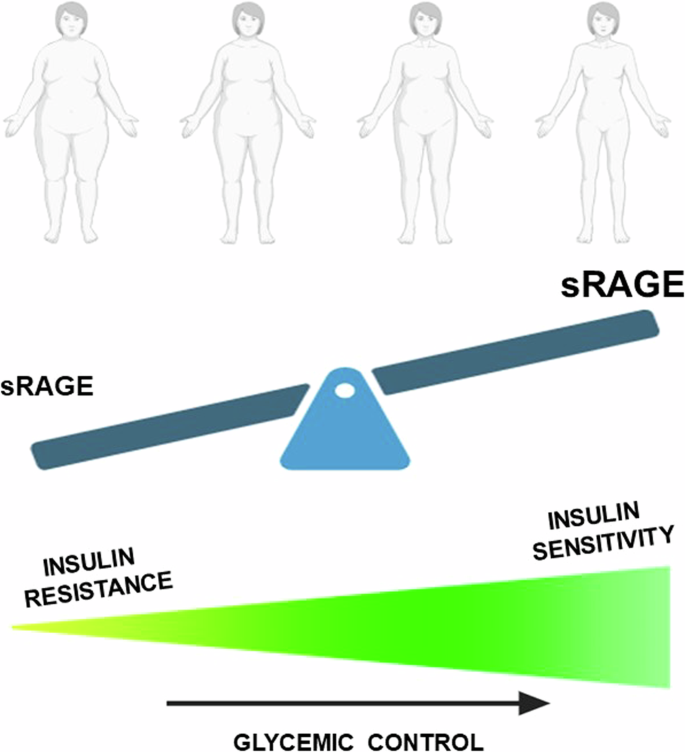
Increased plasma sRAGE levels are linked to insulin sensitivity, glycemic control, and attenuated obesity.
Consistent with our current results, previous experimental and observational studies have highlighted the protective effects of sRAGE against obesity-associated metabolic disruptions by mitigating inflammatory pathways in various tissues, including leucocytes, tissue macrophages, and insulin-dependent tissues such as adipose tissue, liver, and skeletal muscle [1, 2]. Given the pro-inflammatory and pro-oxidant actions of AGEs, it is plausible to posit that the inhibition of AGEs by sRAGEs may indeed contribute to the preservation of insulin sensitivity.
The current study further bolsters the robust association between circulating sRAGEs and vitamin D. Experimental investigations have elucidated that administration of vitamin D leads to a decrease in RAGE mRNA and protein levels by suppressing NF-κB transcriptional activity. Interestingly, vitamin D also enhances sRAGE levels through two distinct molecular mechanisms: first, by augmenting ADAM10 enzymatic activity, thereby facilitating the proteolytic cleavage of full-length membrane-bound RAGE, and second, by increasing alternative splicing of RAGE pre-mRNA levels [15, 16]. These effects of vitamin D on the sRAGE/RAGE ratio potentially contribute to its protective role against pro-inflammatory pathways induced by AGEs [17, 18].
Furthermore, clinical observational studies have corroborated the positive correlation between circulating sRAGE and vitamin D levels [16]. This intricate interplay between vitamin D and sRAGE underscores the potential mechanisms through which vitamin D may mitigate AGEs-induced inflammatory responses.
Collectively, the current data suggest that the decrease in plasma sRAGE levels associated with obesity could potentially exert detrimental effects on both insulin sensitivity and glycemic control (Fig. 2). However, it is essential to acknowledge a limitation of this study, which primarily relied on observational cross-sectional and longitudinal data. To enhance our understanding and further establish the clinical significance of sRAGE in improving insulin sensitivity, additional observations in longitudinal studies modulating sRAGE levels independent of weight changes, and in pre-clinical in vivo experiments in animal models evolutionarily closer to humans (such as minipigs or non-human primates) should be conducted.
In summary, the findings of this study point to a possible role of vitamin D-mediated sRAGE in preserving insulin sensitivity. Further research endeavors are needed to validate these observations and explore potential therapeutic implications in managing insulin resistance and glycemic control.
Responses