Space-time dynamics in hazard exposure analysis: smartphone locations show pedestrian routes are inflexible to extreme heat events

Introduction
Spatio-temporal analysis of environmental hazards and their associated consequences for affected communities is an integral part of emergency response and mitigation planning1,2. Extreme heat, for example, has the highest mortality rate of any weather-related hazard in the U.S3. and the conditions are projected to exacerbate globally4. One of the most effective ways to cool people outdoors when it is hot outside in arid environments is to provide shade. All else equal, a person standing in the sun will feel up to 30°C hotter than someone standing in the shade just a few feet away5. That is because shade reduces a person’s direct exposure to the sun’s longwave energy and prevents the sun from heating up nearby surfaces and radiating heat back at their bodies6. Neighborhoods that lack sufficient shade to protect people from the sun, or “shade deserts”6, create excess heat stress for cities and their residents that reduces quality of life and increases risk of morbidity and mortality. Moreover, disparities in tree canopy provisioning and features of the built environment mean that certain residents are disproportionately exposed to sunlight during extreme heat events and oftentimes also have the least resources to adapt and mitigate the ill effects7.
The way that people experience heat at a hyper-local level is controlled by a different set of thermal dynamics than regional/city-scale heat islands. Heat at the hyper-local scale is measured by ambient air and mean radiant temperature (MRT) and is driven by factors such as built form morphology, shade availability, and wind dynamics8. Distribution of urban heat is inequitable as is the capacity to cope and adapt9. Thermal inequity patterns in cities mirror those of other environmental hazards such as air pollution10. In a similar fashion, vulnerable populations live in neighborhoods that lack built form, and vegetation conducive to appropriate cooling. Thermally comfortable public spaces are vital to overall public health in dense urban environments across all demographics and prolonged heat exposure is physiologically unsafe11,12.
Cities have used a variety of techniques in mitigation efforts from heat and resulting heat impacts including increasing greenspace, tree canopy, increasing albedo of surfaces, buildings, and roofs, and implementation of cooling centers. While each strategy has its advantages and disadvantages, all are costly and require significant cooperation between public and private jurisdictions. Additionally, the cost of mitigation techniques is not only costly financially but also high in resource cost especially in arid and semi-arid climates like the American southwest. Yet, important nuances in the spatio-temporal dynamics of heat risk are not fully captured in existing methods of assessment. Studies show that policies prioritize hotter areas and more socially vulnerable regions that are sometimes, but not always, co-located13. Moreover, vulnerability metrics frequently use census data, which ties assessment of demographic risk factors to home addresses2. However, people are exposed to hot conditions when they travel for work, school, or leisure; activities that static assessments miss14. Moreover, the underlying biophysical conditions that shape exposure to heat outdoors follow diurnal patterns: temperature and sun exposure generally peak midday to late afternoon depending on characteristics of the built environment.
Advanced methods of assessing spatio-temporal dynamics demonstrate the importance of human movement in assessing a wide variety of social issues. For instance, the use of mobility data can aid in assessing heat risk across exposure settings because it can capture spatio-temporal dynamics of human movement15,16. Scholarship has demonstrated that low-income populations live and travel in areas that share disproportionate impacts of environmental hazards including heat17 and air pollution18. Research has traditionally focused on fixed location data such as social data from local census, however this leads to an unrealistic representation and low accuracy in the description of thermal burden. Mobility data providing individual movement patterns have begun to be used in the literature, first through surveys19, and public transit ridership data20,21, aggregated mobility data14, walking volume and climate conditions22,23 and thermal comfort24.Other studies have simulated pedestrian movement based on extreme heat and built form within neighborhoods25, however this model could not be catered to every individual and thus the accuracy suffers. Mobile phone location data can track individuals beyond use of public transit and facilities, showing a more complete representation of a person’s day and where they could be vulnerable to the ill effects of extreme heat. Knowing true pedestrian travel activity is pertinent to distribution of limited resources for adaptation and mitigation.
Research question and hypothesis
We assess the role of mobility in environmental hazard risk with a focus on extreme heat. Specifically, we question the relationship between the dynamic distribution of biophysical risk factors (e.g., shade)5,26, and the equally dynamic distribution of a sensitive group (e.g., pedestrians). We characterized spatial and diurnal patterns in shade production and pedestrian’s mobility during typical summer days and extreme heat events to create a spatio-temporal analysis of individual heat exposure variability. We implemented this approach for the joint analysis of shade and mobility, and to test whether pedestrians gravitate toward shade during extreme heat events when both shade and sunlight are available in a vulnerable neighborhood in Los Angeles, California with low vegetation (Fig. 1A).

A Shade cast in Pacoima at 2:30 pm including shade from buildings and trees, with an inset of magnified view (created in ArcGIS Pro using TIGER/Line shapefiles from the U.S. Census); B Average percent shade available by land use and shade type; and C Percent shade available by land use and time of the day in hourly intervals from 1:00 pm to 5:00 pm (Error bars indicate standard error of the means; plotted in Microsoft Excel). (Note: Land use codes are provided in Supplementary Table 1).
Study area
Our study area is Pacoima (Fig. 1A), as one of the most vulnerable and most impacted regions in Los Angeles County. Pacoima is one of the oldest neighborhoods in the San Fernando Valley region of the City of Los Angeles. It has >73,000 population (about 16,600 households) with a diverse community that is majority Latino (85.6%) and African American (7%)27. About 56% of Pacoima is residential, 19% is industrial, 4% is commercial, and 4% is open spaces and parks [calculated from SCAG 2019]. The walkability score of Pacoima is 61 (on a scale of 25–100) which is a little lower than Los Angeles’ score of 6928.
The average tree canopy coverage is 20% of land area in Pacoima26. More than half of the neighborhood’s area has high potential for tree canopy cover improvements, as the existing percent is low and possible percent is high29. According to FEMA’s National Risk Index, the Risk Index for Pacoima is Very High to Relatively High, the Social Vulnerability varies between Relatively High to Very High, and the Community Resilience is Very Low30. Additionally, the Pacoima/Sunland area has experienced a 25–39% reduction in green cover on all single-family lots31, and the average annual days exceeding 95 degrees Fahrenheit is projected to increase five times more than present time32, in other words, there will be less shade and more heat exposure.
Results
Pedestrians’ daily activities are a defining factor in their intersection with shaded areas. Shade area expands after local noon, and the proportion of pedestrians in shade corresponds with this pattern. At two scales (point and hexagon-grid polygons) pedestrian use of shade was similar and was inelastic in relation to shade coverage. On weekends, however, fewer individuals used outdoor spaces during heat events in comparison with control days (significant in a difference of means t-test, p < 0.001) regardless of the amount of shade, while on weekdays the patterns did not change (not significant in a difference of means t-test, p = 0.446), which could be a function of relatively higher agency of individuals on weekends.
Outdoor space use by land use
Incorporation of land use indicated a relatively higher use of open space during weekends in comparison to weekdays; however, this space usage only slightly increased in the heat event days without any change during weekdays. As expected, outdoor space use in industrial and institutional areas decreased on the weekends and decreased during heat event days. Conversely, outdoor spaces classified as commercial and residential were used more during weekends, which had an increase for commercial and high density residential during heat event days but slightly decreased in low density residential areas and public parking facilities. To control for pedestrian travel behavior based on their residence in Pacoima, assumed residents of Pacoima (unique users with a constant resting location from 2:00 am to 5:00 am across all nights), were also matched with pedestrians during daytime.
The results showed that 99% of the sample of residents used the outdoor areas during daytime. However, 6.2% of the percentage of recorded pedestrians using outdoor space were Pacoima residents, and the remaining 93.8% were likely non-residents. The percentage of residents who stayed in outdoor areas continuously from 1:00 pm to 5:00 pm was 58.7% on average, and about 15% of residents use outdoor areas continuously across all days. Integrating the mobility patterns with shade coverage indicates a slightly different pattern in shade use for these groups (Fig. 2). However, there were more people outdoors during heat events on weekdays, but not on the weekends, and this applied to both shaded and non-shaded areas (Fig. 2A, B). By looking at the percentage of people who used shaded areas, residents stayed in shade longer than non-residents, and residents stayed in shaded areas more during heat events on weekdays.
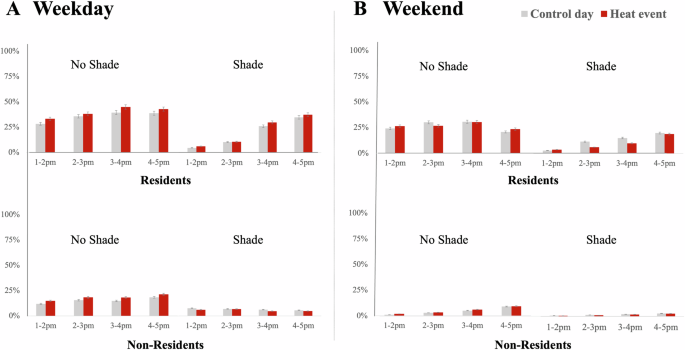
Percent of residents and percent of non-residents of Pacoima using shaded areas and non-shaded areas, by hourly intervals from 1:00 pm to 5:00 pm on (A) Weekdays, and (B) Weekends (Error bars indicate standard error of the mean; plotted in Microsoft Excel).
Unhoused residents
By overlaying building footprints on users’ resting locations at night, we discovered that about 10.5% of the potential resident population were not within buildings and may represent the unhoused population (an underrepresented group vulnerable to extreme heat), from which 10% were continuously in outdoor areas in weekdays (5% in weekends) in Pacoima during daytime as well, without a major difference between control and heat event days (36% of the unhoused residents were in Pacoima’s outdoor areas for at least half of sampled days). For the unhoused residents of Pacoima, the patterns of outdoor space use in relation to shade coverage appeared to follow the same trend of reduced use of outdoor areas during heat event days, but during weekends, use of shade is 5 times higher in heat-events versus control days (mostly associated with shade from retail land-use). This sample of unhoused populations does not show an indication of shade seeking on weekdays, as the percentage of people in shaded areas are about the same on hot days.
Use of shade in heat event days vs. control days
The t-test for equality of means for paired unique IDs use of shade in heat event days vs. control days showed a significant difference in the outdoor space use for non-residents (weekday or weekend) and for residents during weekdays but did not show a significant difference in shade seeking behavior (Table 1). The use of outdoor space during weekends showed a significant decrease (p < 0.001) during heat events, but the trend is inverse during weekdays. The use of shaded areas was not significant for residents during weekdays, but non-residents used shaded areas more when it was hot during weekdays. However, the trend is the opposite during weekends, which shows higher use of shaded areas when it was not hot either for residents or non-residents, which could reflect higher indoor space use during hot weekend days (Table 1). The paired samples from non-residents had a significant difference (p < 0.001) for use of space in both shaded and non-shaded areas (Table 1), which is only showing the variability in the non-residents’ visits. Difference of means tests using gridded data did not show a significant result for the shade seeking behavior during hot days either.
Discussion
How are we adapting to the changing climate and the increase in the duration and extent of heat events? This question has been studied from several perspectives. In this study, we looked at the outdoors space used during heat events in comparison with control days to test the shade seeking behavior of individuals, which was filtered by whether they are residents of the neighborhood or non-residents, or from the unhoused population. In this spatio-temporal risk analysis the spatial and diurnal patterns in shade coverage serves as a dynamic measure of biophysical risk variation5, while mobility data provides the dynamic distribution of pedestrians who are a sensitive group to heat exposure12. Our findings suggest three main behavioral patterns and policy implications.
First, we found evidence that location of high heat exposure sites within the neighborhood include areas heavily trafficked by pedestrians. Despite being active in high heat zones, pedestrians in our study area did not seek shade proactively. One possible explanation is that some individuals may exhibit heat avoiding behaviors such as staying indoors. Another is that individuals do not alter routines or routes due to daily life obligations, or do not perceive extreme heat as life-threatening. Therefore, shade provisions in areas of high concentrations of outdoor space users can potentially mitigate the heat-risk for individuals who are not willing or able to change their paths.
Second, differences between patterns of pedestrians’ travel behaviors during weekends versus weekdays supports the hypothesis that pedestrians are not able to change their paths when faced with extreme heat conditions. More individuals used outdoors during heat events on weekdays than on weekends, in either shaded or non-shaded areas. There was lower percentage of pedestrians in industrial and institutional areas on weekends and only a little lower during heat event days. On the other hand, the percentage of pedestrians in commercial and residential areas was higher during weekends, which was also higher during heat event days for commercial and high-density residential areas. A slight decrease was only seen near low density residential areas and public parking facilities during hot days. These results imply potential usage of indoor spaces versus outdoor spaces when temperatures are higher, and when individuals can choose so, that can explain the increase in pedestrian activity near commercial areas as well.
Third, the behavioral patterns observed for residents and non-residents also applies to the unhoused populations in Pacoima, which did not show shade seeking behavior. However, the unhoused residents of Pacoima used shaded areas 5 times higher in heat-events versus control days during weekends, but not during weekdays. The outdoor space used during weekends by this sample was mostly associated with shade from retail land-use, which can explain the higher usage only during weekends and not weekdays. A policy consideration for this observation is to provide shaded areas in places that unhoused residents usually cluster, since they make up a disproportionate share of heat deaths.
The policy implication of our findings for cities is that shade and cooling interventions will have greater effect on higher numbers of people if placed in highly trafficked areas and where outdoor space is used more often. These may be commercial areas where people are spending more time outdoors and getting exposed to more sunlight due to a lack of shade coverage. We focused on a vulnerable study area of majority single-story homes and future research should investigate these patterns in a wider variety of socio-economic compositions and built environment types.
Methods
Shade modeling
We used Light Detection and Ranging (LiDAR) data to model urban form, mapping shade annual and diurnal cycle and estimate average cumulative solar exposure33. While substantial advances have been made in the use of LiDAR data to model shade, methods for determining which features cast shade and the urban context influence are less developed34. We obtained LiDAR data from the LARIAC (Los Angeles Region Imagery Acquisition Consortium) captured in early 2020. The LiDAR data has a point density between 2–3 points per square meter creating DEM, DSM and CHM with 1-meter resolution. We used Cloudcompare software and ArcGIS Pro 2.9 software to classify and process LiDAR data into Digital Surface Models and shadow raster for both trees and built form separately (Fig. 1). Cloudcompare software was used to filter LiDAR points to vegetation (high, medium, and low) as one layer of lidar points, and filtered buildings as a second layer35. Both layers were then used with Lastools toolbox on ArcGIS Pro to generate digital surface and canopy height models to then be used to model shadow using solar parameters of zenith and altitude. The output of the tools yielded a raster with extent of shade and unshaded spaces identified and the spatial resolution was the same as the digital surface models. This raster was reclassified to binary values of shade and solar exposed. For each hour we applied new solar zenith and altitude values into the calculation. The shade extent and composition varied and expanded throughout the afternoon as the sun’s angle became more oblique. Vegetation shade was assumed to be complete shade with high leaf area index assumed. In cases where shade from buildings and tree shade overlapped, the higher elevated shade casting feature was given credit as source of shade. Figure 3 shows the steps of modeling and analysis.
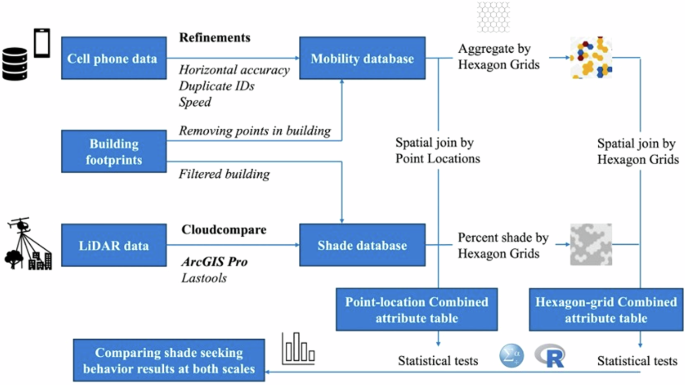
(Created by authors in Microsoft PowerPoint).
Mobility modeling
The mobile phone data was acquired from Outlogic — a private location data provider — for July and August of 2017 (data received was >24 million recorded locations of mobile device users in Los Angeles County). The dataset was refined using a Python program for horizontal accuracy (removed records with accuracy values above 10 meters), duplicate IDs (removed duplicates at the same location) and speed of users to only capture pedestrians (removed missing values or speeds >3.34 miles per hour (~1.5 meters per second) as a threshold for walking speed)36,37,38. The users within building features39 were also removed for the shade analysis, by intersecting the data points with building footprints in ArcGIS Pro 2.9. The refined dataset was later divided by hourly intervals to prepare for comparison with shade modeling results. Mobility datasets were used for two levels of analysis, (1) at point locations, and (2) at hexagon-grid units that are described in section 4.3. (Fig. 3).
To compare the behavior pattern changes during heat events, we selected six pairs of extreme heat versus control days (paired hot-control days are from the same day of the week). These paired control-hot days are July 1st -July 8th, July 2nd -July 9th, July 26th -August 2nd, July 27th -August 3rd, August 23rd -August 30th, and August 24th -August 31st (Table 2). The samples were selected from summer of 2017 because it had several record-breaking heat waves with highest fatalities in the past decade40 and was before the COVID-19 pandemic, thus not influenced by the COVID-19 mitigation policies and ordinances. The pedestrian travel behavior during control days is considered as the baseline to compare with heat event days, for identifying possible changes.
The statistical tests for differences in mean using two sample t-tests were performed in SPSS (Statistical Package for the Social Sciences).
Unit of analysis
We chose two different scales for our analysis: point location of mobile phone users, and hexagon-grid polygons (1000 square meters) to keep the confidentiality of users’ locations and account for spatial uncertainties (Fig. 3). The purpose for running the analysis at the point scale was to check if we are missing an association between pedestrian locations and shade due to aggregation at the hexagon-grid scale. The grid data includes aggregated unique identifiers in 1-hour intervals (1:00 pm–5:00 pm), average area of shade coverage by grid in 1-hour intervals, and dominant land use coverage in the grid. The number of aggregated identifiers in each grid is standardized by total number of users per 1000, by day and hour, to have comparable samples.
Land use codes
The shade coverage and outdoor space use are analyzed in the context of different land uses. The data source for land use classification is Southern California Association of Governments (SCAG) 2019 Annual Land use parcel level data updated in February 202142, which is re-classified for the purpose of this study and these codes are provided in the Appendix.
Limitations
There are some limitations in the data visualization and analysis. Regarding data visualization, since mobility data have a high spatial resolution, the mapping of patterns is not advised or allowed under the terms of our license agreement because it would disclose individuals’ locations in the studied neighborhood. Secondly, even though we refined the data for horizontal accuracy, there are still uncertainties in the modeling of shade and mobility, and in the intersection of mobility and shade layers, as individuals could have been very close to shade but not included. Other factors could lead to inaccurate attribution of devices to unhoused residents, such as phones that are left in vehicles overnight rather than taken into residences such that the appear within building footprints. Lastly, our study area had unique characteristics (mostly residential and single-family homes, with low vegetation cover), thus results could show different patterns in another neighborhood.
Responses