Spatial proximity of CD8+ T cells to tumor cells predicts neoadjuvant therapy efficacy in breast cancer

Introduction
Breast cancer (BC) remains a significant healthcare challenge, though advancements in the detection and continually evolving treatment strategies have improved patient outcomes1,2,3,4. Neoadjuvant therapies (NAT), administered before surgical intervention, have become a key component of treatment, aiming to reduce tumor size and eliminate micrometastatic disease. The effectiveness of these treatments is often gauged by whether patients achieve a pathological complete response (pCR), which is influenced by various factors including tumor ER/HER-2 status, molecular subtypes, and genomic markers5,6,7,8,9,10.
Recently, the presence and spatial distribution of tumor-infiltrating lymphocytes (TILs) have emerged as pivotal predictors of treatment outcomes11,12,13,14,15,16,17. Immune cells recruited to tumor areas display distinct dispersion patterns, exhibiting differential localization in both the stromal and intraepithelial regions of the tumor18,19. The density and location of these immune effector cells in specific regions has been found to influence therapeutic outcomes11,20,21, particularly in treatments using immune checkpoint inhibitors22. Prior research has consistently demonstrated the predictive or prognostic implications of the proximity of immune cells within the intraepithelial cell domain13,23,24,25,26. Notably, in a study of 25 cases of triple-negative breast cancer (TNBC), CD103+CD8+ T cells in close proximity to cancer cells were associated with improved recurrence-free survival24. Among the diverse array of immune cells in the BC TME, CD8+ T cells are crucial cytotoxic agents against cancer cells, and their presence correlates with improved clinical outcomes17,27,28. The distinction between stromal and intraepithelial immune cell infiltration, especially CD8+ cells, is particularly prognostic in TNBC, a subtype known for its aggressive nature and poor prognosis14,21,25,29,30,31.
Despite these insights, the specific clinical implications of the spatial distribution of immune cells, including CD8+ T cells, as predictors of NAT outcomes in BC have not been comprehensively examined with consideration of other immune cell components and across multiple breast cancer subtypes29. In addition, the functional interplay and proximity metrics between immune cells, particularly CD8+ T cells, and cancer cells have not been comprehensively investigated in breast cancer. Understanding these spatial relationships may provide novel and significantly predictive or prognostic biomarkers. Elucidating these dynamics is crucial for improving targeted therapeutic strategies and patient outcomes.
Our study utilized multiplex fluorescence (mIF) to elucidate the spatial dynamics and density of immune cells within BC tumors, focusing on their correlation with clinical outcomes post-NAT. Additionally, we aimed to identify the chemokines that drive T cell infiltration into tumors, shedding light on the immune-tumor interactions that could impact personalized medicine approaches in breast cancer therapy. By analyzing these factors, we provide a deeper understanding of the role of immune cells in predicting and enhancing the efficacy of NAT in breast cancer patients.
Methods
Patient cohort and tumor specimens
We selected a cohort of 104 patients with non-metastatic BC who underwent neoadjuvant treatment (NAT) between January 2014 and November 2018 at the Affiliated Cancer Hospital & Institute of Guangzhou Medical University. Inclusion criteria were stage IIB to IIIC BC in female patients aged 20–80 years who received neoadjuvant treatment (NAT) with informed consent for biomarker testing. The selected NAT regimens were chemotherapy alone or in combination with trastuzumab. The exclusion criteria were metastatic breast cancer and early stage breast cancer without neoadjuvant therapy. This study was approved by the ethics review committee of the Affiliated Cancer Hospital & Institute of Guangzhou Medical University, No: 2022-S04. Written informed consent was obtained from each patient prior to clinical treatment and biomarker assessment. Tissue samples, both pre- and post-NAT, were acquired and preserved as formalin-fixed and paraffin-embedded (FFPE) samples. Initial pre-NAT samples were obtained via core needle biopsy of the breast, whereas post-NAT specimens were surgically resected. Self-paired pre-NAT and post-NAT samples were used to assess changes in immune cell infiltration. Clinical data, including age, menopausal status, histology, genotype, and clinical outcomes, were collected and recorded.
Clinical molecular typing and pathological assessment
Molecular subtypes were determined through a review of immunohistochemistry (IHC) results for the estrogen receptor (ER), progesterone receptor (PR), and Ki-67 according to the criteria of the American Society of Clinical Oncology (ASCO)/College of American Pathologist (CAP) guidelines. HER-2+ tumors with IHC scores of 2+ were further evaluated using fluorescence in situ hybridization (FISH). Ki-67 expression levels were dichotomized as high or low using 20% staining as a cutoff. ypTN stage classification followed the guidelines set by the American Joint Committee on Cancer. Our study stipulated the pCR criteria as the absence of residual invasive cancer in the breast and axillary nodes, irrespective in situ cancer (ypT0/isypN0 or ypT0ypN0)32. Major pathological responses (MPR) were defined as residual tumor tissue of 10% or less in resected breast and lymph node tissues. The objective response rate (ORR), which includes complete response (CR) and partial response (PR), was evaluated according to RECIST 1.1 criteria.
Histopathologic analysis
For histopathological analysis, surgical specimens were dissected, and selected tissues (0.5 cm thick) were used to prepare FFPE blocks. We collected 696 FFPE blocks, as each patient provided between two to seven biopsies for both pre- and post-NAT evaluations. Tumor sections sliced from FFPE blocks were subjected to hematoxylin and eosin (H&E) staining. Sections exhibiting maximum cancer cell content were further processed for CD3 staining and multiplex IHC. On average, each patient had 5.4 sections evaluated, with a range of 3 to 30 sections. The percentage of viable tumor cells (averaged across all sections) has been previously reported for each patient17. We adopted strict definitions for intratumoral T cells or immune cells, which were identified based on direct interactions with carcinoma cells without intervening stromal cells33,34.
Multiplex immunofluorescence staining
We processed 104 pairs of matched pre-NAT and post-NAT tumor samples using the PANO 7-plex IHC kit (Cat. #0004100100, Panovue, Beijing, China). This method enables simultaneous visualization of six markers in the same section. Briefly, antigen retrieval was performed by boiling the antigen retrieval solution AR9 (pH 9.0). Blocking was performed using an antibody-blocking solution (Panovue, Cat. #0018001120) for 15 min, followed by incubation with the following primary antibodies: TIM3 (CST45208, Cell Signaling Technology, Inc., MA, USA; diluted at 200×), CD8A (CST70306, CST; diluted at 200×), PD1 (CST43248, CST; diluted at 100×), CD4 (BX22300130; diluted at 2000×), FoxP3 (BLG320202; diluted at 200×), PD-L1 (CST13684; diluted at 100×), CD68 (BX50031; diluted at 4000×), LAG3 (CST15372; diluted at 100×), and PanCK (CST4545; diluted at 400×). The sections were then incubated with the primary antibodies for 30 min at room temperature. Subsequently, sections were incubated with anti-mouse or anti-rabbit HRP-conjugated polymers (Panovue, Cat. #0013001010) at room temperature for 15 min, and then incubated with TSA Opal fluorophores (PPD 520, PPD 540, PPD 570, PPD 620, PPD 650, and PPD 690, Panovue Biological Technology (Beijing) Co., Ltd., Supplementary Table 1) for 10 min. After each cycle of staining, the antibody-TSA complex was removed using an AR solution (pH 9) and boiled. After staining, all slides were counterstained with DAPI for 5 min and mounted in ProLong Diamond Antifade Mountant (Thermo Fisher Scientific).
To obtain multispectral images, stained slides were scanned using a PerkinElmer Mantra System (Polaris System, Waltham, Massachusetts, USA). A spectral library required for multispectral unmixing was established using inForm image software (inForm 2.4.0 PerkinElmer, Waltham, Massachusetts, USA). The reconstructed images of each section were obtained using a spectral library. AI-assisted analyses using InForm software were performed to determine the recognition and calculate the infiltration percentages of CD4+, CD8A+, PD1+, TIM3+, PD1+CD8+, TIM3+CD8+, PD1+CD4+, TIM3+CD4+, PANCK+PD1+, PANCK+TIM3+, and PD1+TIM3+ cells (panel 1 staining), and CD68+, FOXP3+, LAG3+, PD-L1+, CD68+LAG3+, CD68+PD-L1+, FOXP3+LAG3+, FOXP3+PD-L1+, LAG3+PD-L1+, LAG3+PANCK+, and PD-L1+PANCK+ cells (panel 2 staining). Throughout the data collection phase, the clinical endpoints were concealed from the data collector and statistician. Two experienced pathologists independently assessed the pCR or non-pCR status of post-NAT tissue samples. For specimens where pCR was achieved, and no invasive tumor cells were present, we conducted a comprehensive examination of the entire residual tumor bed area. Ten high-power fields (HPFs) were then randomly selected from this area as regions of interest (ROIs) for TIL assessment. This standardized approach aimed to reduce subjectivity and inter-observer variability in the evaluation of TILs. Any discrepancies between the pathologists were resolved through consensus discussion.
Selection of immune cell metrics
Due to variability in tissue sample sizes and cellularity among biopsy specimens, we utilized percentages of immune cells—defined as the proportion of specific immune cells relative to the total number of nucleated cells—rather than absolute cell densities. This approach allowed for normalization across samples of differing sizes and enabled direct comparison of immune cell prevalence between samples. Additionally, we observed strong correlations between percentages and absolute densities of immune cells (Supplementary Fig. 11), supporting the use of percentages as a representative and reliable metric in our analyses.
Spatial distance calculation and analysis
From each tissue sample, we selected a minimum of ten representative fields. Using InForm image analysis software, we extracted the cell signal strength data across multiple channels via the Cell_Seg_Data function. Immune marker positivity was determined by setting thresholds based on staining conditions. We aimed to count the number of immune cells situated within specific radii (5, 10, 20, 30, 40, and 50 μm) of a tumor cell. Cancer cells were identified and counted using Cell_Seg_Data thresholds. Their spatial locations were pinpointed by recording the x- and y-coordinates, and this count was designated as from_Count (representing the central cells). In a similar manner, immune cells were identified, and their spatial count was termed to_Count (indicating peripheral cells). The Euclidean distances between each cancer cell and every immune cell were calculated, forming a distance matrix defined from_Count x to_Count. If a cancer cell contained immune cells within distances of ≤5, 10, 20, 30, 40, or 50 μm, it was incorporated into the from_With tally. Within this matrix, each row represents the distance from a single cancer cell to all the identified immune cells. For example, if one row recorded 10 distances falling within the predetermined radii, it suggested the closeness of a cancer cell to 10 individual immune cells. By aggregating these values for all cancer cells, we derived the within_Sum for each visual field. This method was systematically applied across all ten fields, generating aggregate values for from_Count, to_Count, from_With, and within_Sum. Finally, we consolidated the data from all visual fields to calculate within_Mean, which represents the average number of immune cells proximate to each tumor cell.
CD3, CXCL9, CXCR3
IHC staining for CD3, CXCL9, and CXCR3 was performed using a Dako Omnis Autostainer. Tissue sections of 4 µm thickness were boiled and then subjected to dewaxing, rehydrating, and antigen retrieval, followed by incubation with anti-CD3, CXCL9, and CXCR3 primary antibodies (Dako Omnis, polyclonal rabbit anti-human, Santa Clara, CA, USA). Signal visualization was performed using the EnVision FLEX+ High pH (Link) system following the manufacturer’s instructions. Sections were manually mounted in neutral resin for observation under a light microscope. The acquired images were analyzed to quantify the CD3, CXCL9, and CXCR3 signals, and the cell marker levels were calculated using the inForm automated image analysis software (PerkinElmer, Waltham, Massachusetts, USA). The software’s machine-learning algorithm classified CD3+ cells, and the relative presence of each marker based on their staining intensity was calculated as a percentage.
Statistical analyses
All statistical analyses were performed using SPSS 22.0 software. Continuous data are presented as the mean ± standard deviation. Optimal cutoff points for immune biomarker divisions and their association with clinical outcomes were visualized using X-tile software35. Survival differences among subgroups were calculated using the Kaplan–Meier method, and the significance of differences was ascertained using the log-rank test. Time-to-event outcomes, including any recurrence in the treated breast (LR), time from randomization to death from any cause (OS), time to LR, local-regional recurrence (LRR), or distant metastases (DFS), were assessed using Cox proportional hazards for both univariate and multivariate analyses. All associated graphs were generated using GraphPad Prism 9 software. Differences in immune cell abundance between pre-NAT and post-NAT samples were evaluated using the Wilcoxon test, whereas the Mann-Whitney test and Kruskal-Wallis test were used for independent samples. Spearman’s correlation analysis was used to determine correlations between variables. P < 0.05. Because these studies were viewed as hypothesis-generating, multiple testing corrections were not applied.
Results
Patient characteristics and clinical outcomes in breast cancer neoadjuvant therapy
We enrolled 104 patients with breast cancer (BC) who underwent neoadjuvant treatment (NAT) between January 2014 and November 2018. Clinical data and survival were tracked until October 1, 2021, with a median follow-up of 69.2 months. The median age at the time of diagnosis was 49.7 years, ranging from 23 to 76 years, and included diverse tumor subtypes: 11 Luminal A (10.60%), 56 Luminal B (53.80%), 19 HER-2 positive (18.30%), and 18 TNBC (17.30%). In addition, 79 patients exhibited high Ki-67 expression (>20%) (Supplementary Table 2 and Fig. 1C). Patients received various NAT regimens, and treatment responses were monitored through imaging. Clinicopathological parameters, including age, menopausal status, histologic grade, and recurrence, were obtained from the clinical records. The median Disease-Free Survival (DFS) was 54.2 months, and the median OS (Overall Survival) was 61.8 months. For this study, DFS was defined as the time from randomization to either disease recurrence or death due to disease progression, OS was defined as the time from randomization to death from any cause, and pCR (pathological complete response) was defined as no residual invasive cancer post-treatment32. All participants provided written informed consent for both the clinical treatment and biomarker analyses. This demographic and clinical profile provides a basis for evaluating the effect of immune cell distribution on diverse cancer types and treatment outcomes.

A Sample preparation and staining: Formalin-fixed and paraffin-embedded (FFPE) paired samples were collected from cancer tissues at both diagnosis and surgical intervention stages. B Imaging and analysis: Samples were scanned and subjected to AI-assisted analysis to quantify immune marker infiltration percentages within different tissue compartments. C Patient cohort: The study enrolled 104 breast cancer (BC) cases undergoing neoadjuvant treatment (NAT). Clinical parameters tracked included age, menopausal status, TNM stage, molecular typing, number of NAT cycles, treatment response, pathological complete response (pCR) status, histopathological grade, and survival outcomes. IHC immunohistochemistry, mIHC multiplex immunofluorescence, NAT neoadjuvant treatment, pCR pathological complete response.
Prognostic role of immune cell distribution in breast cancer
Employing multiplex immunofluorescence (mIF), we analyzed the distribution of CD4, CD8, PD1, TIM3, CD68, LAG3, PD-L1, and FOXP3-expressing cells in 104 patient samples, focusing on their spatial relation to cytokeratin-marked tumor cells (Fig. 1A–C). AI-assisted analysis determined the number of immune cells. Logistic and Cox regression analyses assessed the predictive value of the spatial distribution of immune cells in the intratumoral, stromal, and overall areas. The percentage values of total CD8+ T cells, stromal CD8+ T cells, and intratumoral CD8+PD1+ T cells emerged as significant predictors of pCR in both univariate and multivariate regression models (Table 1). Additionally, the percentages of total PD1+TIM3+, stromal PD1+TIM3+, and intratumoral CD8+TIM3+ T cells were significantly associated with pCR in both univariate and multivariate models. Total CD8+ T cells, total FOXP3+ cells, and stage were significant predictors of DFS and OS in both univariate and multivariate regression models. Specific stromal cells, such as PD-L1+, CD68+LAG3+, and CD68+PD-L1+ cells, showed a significant relationship with DFS but not OS (Supplementary Tables 3, 4).
Kaplan–Meier survival analyses demonstrated that higher infiltration of CD8+ T cells, both total and stromal, and a reduced presence of FOXP3+ cells were associated with extended DFS and OS (Supplementary Figs. 1–6, B and G). In contrast, patients with elevated levels of PD-L1+ and PD−L1+PANCK+ cells in the stroma showed significant negative associations with DFS (Supplementary Fig. 3H, R) and CD68+PD-L1+ cells showed significant positive associations with both DFS and OS (Supplementary Figs. 3P, 4P). The survival analysis results of other immune markers are shown in Supplementary Figs. 1–6.
Analysis of the distribution of immune cells in the stromal and the intratumoral regions revealed that patients achieving pCR exhibited higher percentages of CD8+, CD4+, TIM3+, and PD1+CD8+ T cells, particularly in the intratumoral areas, compared to non-pCR patients (Supplementary Fig. 7) (Supplementary Tables 5–7). This pattern was evident in both stromal and intratumoral regions, although some T-cell subtypes did not show significant differences in distribution. These observations highlight the crucial role of CD8+ T cell distribution in predicting the effectiveness of different neoadjuvant chemotherapy regimens and highlight its potential as a prognostic marker for treatment outcomes in breast cancer.
Pivotal role of CD8+ T-Cell proximity in breast cancer prognosis post-NAT
To define the impact of immune cell interactions with individual tumor cells on treatment outcomes, AI-assisted analyses were used to assess the number of immune cells within the proximity ranges of 5, 10, 20, 30, 40, and 50 μm to tumor cells. The 20-μm distance of CD8+ T-cells emerged as crucial and significantly correlated with pCR, DFS, and OS outcomes, as substantiated by both univariate and multivariate regression models (Table 2, Supplementary Tables 8, 9, and Fig. 2A). A higher percentage of CD8+ T cells within this range was associated with better clinical outcomes, significantly affecting pCR, DFS, and OS (Fig. 2A–C). While a higher percentage of CD4+ T cells in this range was also associated with optimal pCR (Tables 4–6 and Fig. 2A) the association with CD8+ T cells was more pronounced. Conversely, a lower concentration of CD68+ cells within the 20-μm range correlated with longer OS and a trend towards longer DFS (Fig. 2D, E), as did lower FOXP3+ cell proximity (Fig. 2F, G). The survival analysis and univariate and multivariate logistic regression results of all immune cells within proximity (5, 10, 20, 30, 40, 50 μm) to tumor cells are shown in Supplementary Figs. 8, 9 and Supplementary Tables 8–10. These findings reveal that the spatial distribution and proximity of specific immune cells, particularly CD8+ T cells, are critical for determining the effectiveness of NAT in breast cancer patients across multiple treatment regimens and cancer types.
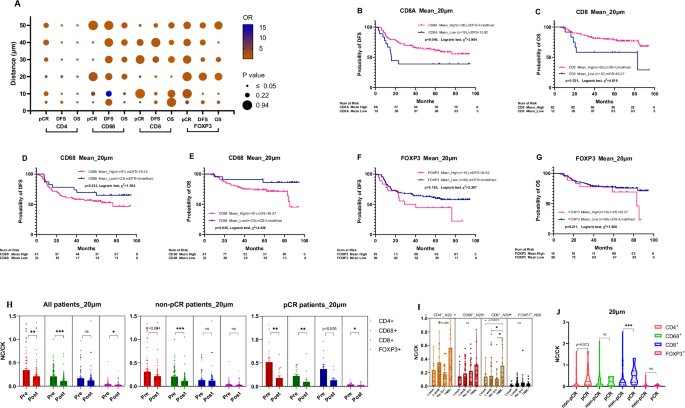
A The bubble chart of CD4+, CD8+, CD68+, and FOXP3+ immune cells within proximity (5, 10, 20, 30, 40, 50 μm) to tumor cells predictive pCR, DFS, and OS. B, C CD8+ cells and survival outcomes: Kaplan–Meier survival curves revealed a significant association between the mean N20 values of CD8+ cells and both DFS and OS. Higher spatial distribution of CD8+ cells corresponded to longer DFS (Undefined vs 15.90 months, P = 0.046) and OS (Undefined vs 83.10 months, P = 0.031). D, E CD68+ cells and OS: Lower spatial distribution of N20-CD68+ cells was significantly associated with longer OS (Undefined vs 76.43 months, P = 0.035) and showed a tendency for longer DFS (Undefined vs 76.43 months, P = 0.213). F, G No prognostic significance for FOXP3+ cells: The mean N20 values for FOXP3+ cells did not exhibit prognostic significance for DFS or OS. H Post-neoadjuvant therapy changes: Dynamic N20 values for CD4+ and CD68+ cells decreased significantly post-neoadjuvant therapy (0.343 vs 0.211, P = 0.003; 0.211 vs 0.109, P = 0.000). I Molecular typing: Immune cells were more densely distributed in triple-negative breast cancer (TNBC) compared to other molecular subtypes. J pCR vs non-pCR differences: N20 values for CD8+ immune cells differed significantly between pCR and non-pCR patients (0.371 vs 0.130, P = 0.001). N20 values for CD4+ cells were numerically higher in pCR patients than in non-pCR patients, although not statistically significant (0.517 vs 0.309, P = 0.073). DFS disease-free survival; OS overall survival; pCR pathological complete response; N20 average number of immune cells within 20 µm radius surrounding tumor cells in the tumor core. NC/CK the ratio of number of immune cells within 20 μm adjacent to epithelial cells over the number of tumor cells.
Immune cell changes pre and post-neoadjuvant therapies
Following NAT, we observed significant alterations in the proximity of immune cells to tumor cells. Most notably, in patients who achieved pCR, there was a notable decrease in CD8+ T cell density in the 20 µm spatial range post-NAT (Fig. 2H and Supplementary Fig. S10F). This distribution of immune cells varied distinctly among patient responses and tumor subtypes; in TNBC patients, immune cells were more densely distributed than in the other subtypes (Fig. 2I). Post-NAT, all patient groups experienced a decline in the percentages of CD4+, CD68+, and FOXP3+ immune cells within a 20 µm spatial range (Fig. 2H). In contrast, patients without pCR showed an increase in certain immune cells post-treatment, highlighting a mixed immune response.
Post-treatment analyses revealed significant reductions in the percentage of PD1+, TIM3+, CD68+ and FoxP3+ cells (Supplementary Fig. 10A–D). Patients without pCR displayed increased percentages of CD8+ T cells post-NAT (Supplementary Fig. 10C, F) (Supplementary Tables 5–7). These findings emphasize the dynamic nature of the immune environment in breast cancer following NAT, with specific changes in immune cell distribution offering potential insights into treatment outcomes.
Immune cell distribution varies among breast cancer subtypes
In this patient set, no significant differences in OS or DFS across the four tumor subtypes were observed (Fig. 3A). Examining the differential distribution of immune cells by molecular subtype prior to NAT, we observed a notably higher infiltration of immune cells, particularly T cells, in triple-negative breast cancer (TNBC) compared to Luminal A, Luminal B, and HER-2 positive subtypes. FOXP3+ regulatory T cells were more prevalent in HER-2 positive and TNBC subtypes (Fig. 3B). This study also identified significant increases in CD68+LAG3+ and CD68+PD-L1+ in TNBC, with other cell types showing trending patterns of increase in TNBC (Fig. 3D, E). These findings suggest an immunosuppressive landscape in TNBC, emphasizing the importance of tailored immunotherapeutic strategies based on these differences.
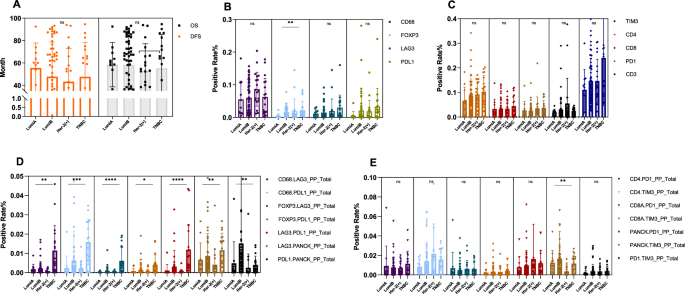
A No significant difference in the prognosis was observed among the four molecular subtypes of BC. B Foxp3+ regulatory T cells are more prevalent in Her-2 positive and TNBC than in other subtypes (LumA vs LumB, P = 0.001; LumA vs TNBC, P = 0.009). D TNBC shows a significantly different distribution for several immune cell combinations compared to other subtypes: CD68+LAG3+ (TNBC vs LumB, P = 0.012; TNBC vs Her-2, P = 0.0007), CD68+PD-L1+ (TNBC vs LumA, P = 0.001; TNBC vs LumB, P = 0.001; TNBC vs Her-2, P = 0.002), FOXP3+LAG3+ (TNBC vs LumA, P = 0.002; TNBC vs LumB, P = 0.001; TNBC vs Her-2, P = 0.000), FOXP3+PD-L1+ (TNBC vs LumA, P = 0.042; TNBC vs Her-2, P = 0.034), LAG3+PD-L1+ (LumA vs TNBC, P = 0.000; TNBC vs LumB, P = 0.000; TNBC vs Her-2, P = 0.000), LAG3+PANCK+ (TNBC vs Her-2, P = 0.006). PD-L1+PANCK+ (TNBC vs LumB, P = 0.0008). C, E The distribution of CD68+, LAG3+, PD-L1+, TIM3+, CD4+, CD8+, PD1+, CD3+, CD4+PD1+, CD4+TIM3+, CD8+PD1+, CD8+TIM3+, TIM3+PANCK+, and PD1+TIM3+ immune cells was not significantly different across the four molecular subtypes of BC. TNBC triple-negative breast cancer, LumA luminal A, LumB luminal B, Her-2 human epidermal growth factor receptor 2.
CXCL9 and CXCR3 was positively correlated with N20-CD8+T and the intraepithelial percentage of CD3+T as well
To decipher how effector T cells were recruited into the tumor core in our patient samples, we examined the expression of CXCL9 and CXCR3 in tumor samples prior to NAT using single-plex IHC in 39 cases. We observed significant positive correlations between the expression levels of CXCL9 and CXCR3 and the proximity and infiltration of T cells within the tumor microenvironment. Specifically, higher CXCL9 expression correlated with increased percentages of N20-CD8+ T cells (Fig. 4A) and intraepithelial CD3+ T cells (Fig. 4C). Similarly, higher CXCR3 expression correlated with increased percentages of N20-CD8 + T cells (Fig. 4B) and intraepithelial CD3+ T cells (Fig. 4D). Additionally, there was a significant positive correlation between CXCL9 and CXCR3 expression levels themselves (Fig. 4E), suggesting a synergistic role in T cell recruitment. Despite this notable association, neither CXCL9 nor CXCR3 expression demonstrated significant prognostic value in our analysis. (Fig. 4). These findings suggest a potential role for CXCL9 and CXCR3 in the migration of T cells into the tumor environment, although their impact on the overall treatment outcomes remains unclear.
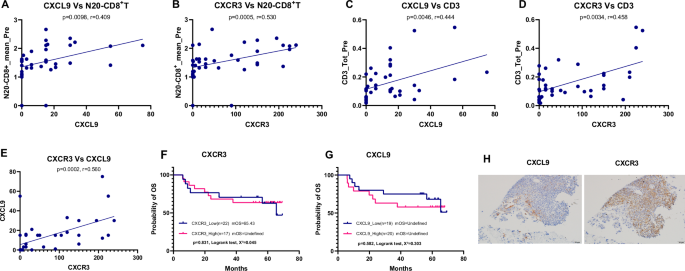
A Positive correlation between CXCL9 expression and the percentage of CD8 + T cells within 20 μm of tumor cells (N20-CD8 + T cells). B Positive correlation between CXCR3 expression and the percentage of N20-CD8 + T cells. C Positive correlation between CXCL9 expression and the percentage of intraepithelial CD3 + T cells. D Positive correlation between CXCR3 expression and intraepithelial CD3 + T cells. E Positive correlation between CXCL9 and CXCR3 expression levels. Pearson correlation coefficients and p values are indicated in each panel. F, G Neither CXCL9 nor CXCR3 showed prognostic significance for disease outcomes. H Representative immunohistochemical (IHC) staining image for CXCL9 and CXCR3. In continuously sliced sections, CXCL9 was expressed in cancer cells and the interface area between cancer cells and immune cells, and CXCR3 was expressed mainly in immune cells in the area neighboring to cancer cells. IHC Immunohistochemistry, N20-CD8+T the average number of CD8+ T cells within a 20 µm radius of tumor cells; CD3+T CD3 positive T cells.
Discussion
While previous studies have demonstrated that immune cells in the tumor microenvironment are associated with clinical outcomes in breast cancer, the detailed spatial dynamics—specifically the proximity of immune effector cells to malignant cells within the tumor core—remain underexplored. We hypothesized that the proximity of tumor-infiltrating lymphocytes (TILs), especially CD8+ T cells, to cancer cells could serve as a predictive biomarker for the efficacy of neoadjuvant therapy (NAT) in breast cancer. This is based on the premise that the anti-tumor function of effector T cells requires close proximity to cancer cells for antigen recognition. Therefore, we investigated whether proximity metrics within 50 μm between immune cells and cancer cells can be predictive or prognostic in breast cancer patients undergoing NAT.
In the present study, we aimed to provide a comprehensive analysis of immune cell spatial distribution in patients with breast cancer treated with NAT. Our findings revealed that the proximity of CD8+ T cells within 20 μm of tumor cells (N20-CD8+ T cells) was significantly associated with improved pathological complete response (pCR), disease-free survival (DFS), and overall survival (OS). This association was observed across different breast cancer subtypes and NAT regimens, suggesting that N20-CD8+ T cells could serve as a robust predictive biomarker for NAT efficacy.
We quantified the average number of immune cells within distances ranging from 5 to 50 μm from epithelial cancer cells (Supplementary Figs. 11,12). Our data highlighted that the 20 μm proximity range for CD8+ T cells was most significantly correlated with clinical outcomes. In contrast, CD4+ T cells within the same proximity showed a marginal correlation with pCR but no significant link with DFS and OS. Regulatory T cells (Tregs) and macrophages (CD68+ cells) within this range were not significantly correlated with the clinical endpoints. Our results underscore the potential prognostic value of CD8+ T cell proximity in relation to clinical outcome. Further subgroup analysis revealed that N20-CD8+ T cells were significantly associated with improved outcomes in patients with Luminal B breast cancer. In HER-2-positive and TNBC subtypes, we observed a positive trend suggesting that higher percentages of N20-CD8+ T cells may correlate with better outcomes; however, these findings did not reach statistical significance, possibly due to limited sample sizes (Supplementary Fig. 13). These results suggest that the 20 μm proximity metric of CD8+ T cells to tumor cells could be a consistent predictive biomarker across various breast cancer subtypes, although further validation with larger cohorts is necessary.
Our study also provides new insights into the role of CXCL9 and CXCR3 in breast cancer. These chemokines and their receptors, particularly CXCR3, appear to play a significant role in recruiting T cells within the tumor core36,37. We observed significant positive correlations between the expression levels of CXCL9/CXCR3 and both the proximity of CD8+ T cells to tumor cells and the infiltration of CD3+ T cells into the tumor epithelium. This suggests that the CXCL9/CXCR3 axis plays a pivotal role in recruiting effector T cells into the tumor microenvironment, enhancing their capacity to recognize and eliminate cancer cells. Notably, the chemokines CXCL9 and CXCL10 are produced not only by immune cells, but also by the tumor cells themselves38,39. These results corroborate those of earlier studies that highlighted the role of CXCL9 in the recruitment of TILs into tumors40. Although neither CXCL9 nor CXCR3 expression demonstrated independent prognostic value for DFS or OS, their association with T cell localization underscores their contribution to the initial steps of anti-tumor immunity. The lack of direct prognostic significance implies that additional factors such as immune cell functionality, the presence of immunosuppressive cells, and other tumor-intrinsic mechanisms affect treatment outcomes. Further research is necessary to elucidate the molecular mechanisms regulating CXCL9 and CXCR3 expression and to understand how they interact with other components of the immune response to influence clinical outcomes.
While we focused on CD8+ T cells, we also observed variations in other immune cell populations among different breast cancer subtypes. For instance, TNBC patients exhibited higher overall immune cell infiltration, particularly of T cells, compared to other subtypes. However, the concentrations of CD8+ and CD4+ T cells remained statistically consistent across subtypes. These observations align with prior findings that highlight the potentially enhanced immunogenicity of TNBC compared to other breast cancer subtypes14,41. Despite these insights, whether the presence of these cells can reliably predict the response to NAT requires further investigation, especially given the limited sample size for TNBC in our study.
Analyzing the dynamic shifts of immune cells before and after NAT can provide insights into how treatment alters the immune landscape of tumors. We observed that within the tumor core area, the average number of CD8+ T cells situated within 20 µm of cancer cells decreased after undergoing NAT in patients who achieved pCR. This reduction could signify the effective elimination of tumor cells, resulting in fewer targets for CD8+ T cells42. In contrast, patients without pCR showed an increase in certain immune cells post-treatment, highlighting a mixed immune response. These findings emphasize the dynamic nature of the immune environment following NAT and suggest that monitoring changes in CD8+ T cell proximity could serve as a practical clinical approach to gauge the effectiveness of NAT and its impact on the tumor immune landscape43.
Our study has several limitations. The retrospective design and single-institution setting may affect the diversity and generalizability of the findings. The sample size, particularly for TNBC cases, was relatively small, which may affect the robustness of our findings specific to this subgroup. Future studies involving larger, independent TNBC cohorts are necessary to validate these results and confirm the predictive value of CD8+ T cell proximity metrics in TNBC patients undergoing NAT. Additionally, the optimal cutpoints for immune cell densities and proximity metrics were determined based on our cohort and have not been validated in an independent cohort, raising the possibility that the prognostic roles observed may be cohort-specific. Future studies involving larger, independent cohorts are warranted to validate these cutpoints and confirm the consistency of the prognostic significance across different patient populations. An additional weakness is that we used CD68 as a general marker for macrophages, which does not distinguish between M1 and M2 macrophage subtypes. The functional heterogeneity of TAMs is significant, with M1 macrophages generally exhibiting anti-tumor activity and M2 macrophages promoting tumor progression and immunosuppression. Future studies should incorporate additional markers to differentiate these subtypes, providing more precise insights into their respective roles in the tumor microenvironment and their impact on NAT outcomes.
The strength of our study lies in the identification of a potentially novel predictive biomarker related to the proximity of CD8+ T cells to cancer cells. The insights provided about chemokines, such as CXCL9 and CXCL10, pave the way for further therapeutic research. Furthermore, our comprehensive approach to analyzing the tumor microenvironment offers a valuable basis for subsequent studies. In future studies, we will validate our findings using a more robust prospective study design. We also plan to employ advanced techniques such as single-cell RNA sequencing or spatial transcriptomics, with an emphasis on emerging cell types such as TEM or TRM, which will provide a deeper understanding of the functional roles and differentiation status of specific immune cells that are responsible for therapeutic efficacy.
In summary, our findings underscore the significance of the proximity of immune cells to 20 μm of cancer cells as a reliable biomarker for predicting the efficacy of NAT in breast cancer. Key players in the TME, including CD8, CD4, CD68, and Treg cells, have emerged as effector immune cells closely tied to clinical tumor phenotypes and therapeutic outcomes. The roles of chemokines, particularly CXCL9 and CXCL10, in guiding T-cell infiltration into the tumor core are potential therapeutic targets that can be leveraged. The inherent variability of TME among patients underscores the importance of personalized therapy tailored to an individual’s unique TME dynamics. As the balance and interplay between various immune cells within the TME becomes clearer, it emphasizes the need for a holistic approach when strategizing treatments. The advent of artificial intelligence and machine-learning technologies could further revolutionize our understanding of TME, potentially unveiling new biomarkers and therapeutic opportunities. As we move forward, the intricacies within the TME necessitate deeper exploration to understand the nuanced roles these cells play and their collaborative or antagonistic interactions that shape therapeutic responses in breast cancer.

 and the impact of repeat biopsies")
Responses