Sporadic radio pulses from a white dwarf binary at the orbital period

Main
ILT J110160.52 + 552119.62 (ILT J1101 + 5521 hereafter) was discovered in a commensal transient search of Low-Frequency Array (LOFAR) all-sky survey data (LOFAR Two-Metre Sky Survey, LoTSS1), to detect radio transients on timescales of seconds to hours using radio images2. A single bright radio pulse from International LOFAR Telescope (ILT) J1101 + 5521 was detected in data from 8 February 2015, using 8-s snapshot images. We detected six additional pulses in other archival LOFAR data. ILT J1101 + 5521 is localized to a right ascension (RA) (J2000) of 11 h 1 min 50.5 s ± 1.9 s and declination (dec.) (J2000) of +55° 21′ 19.6″ ± 0.39″, equivalently (l, b) = (150.4551° ± 0.0004°, 55.5200° ± 0.0001°) in Galactic coordinates. In total, we discovered seven radio pulses lasting between 30 s and 90 s, with peak flux densities ranging from 41 ± 6 to 256 ± 10 mJy per beam in five LoTSS observations spanning 2015 to 2020, each 8 h in duration. A new 16-h LOFAR monitoring campaign at the end of 2023 yielded no additional detections. A summary of all LOFAR observations and detected pulses is given in Extended Data Table 1.
Figure 1a shows the light curves from the five observations in which we detected radio pulses (Extended Data Table 1 and Extended Data Fig. 1). We use the times of arrival (ToAs) of the pulses to determine a phase-connected timing solution with a period of 125.52978 ± 0.00002 min. Furthermore, we are able to obtain a 3σ upper limit on the period derivative of 1.711 × 10⁻¹¹ s s−1 (see the Methods for more details and Extended Data Fig. 2 for the timing residuals). Figure 1a shows both the pulses and the non-detections at times when we expect to find pulses based on the periodicity. The pulses have a 2% duty cycle, and the intermittency of the pulses combined with the non-detections in the 2023 follow-up observations (not shown in Fig. 1a) indicates that the source is intrinsically highly variable in nature: we detect a pulse in 7 out of 26 observed periods.

a, Light curves (flux density versus time) of the LOFAR-detected pulses (blue) and the non-detections (grey) at times when we expect to find pulses based on their 125.52978-min periodicity. The y axis shows the flux density in arbitrary units, and the x axis shows time in seconds (bottom) and duty cycle (top). The error bars on the flux indicate 1σ errors. The pulses are aligned according to the measured period, with period derivative assumed to be zero. The orange-shaded region indicates a 2% duty cycle window. The pulses have been observed from 2015 to 2020, and the relative flux scaling between pulses is consistent. b, The temporal profile (top) and dynamic spectrum (bottom) of the brightest pulse in our sample, shown in dark blue in a. The time resolution is 1 s. Note that this dynamic spectrum is not dedispersed.
The pulses are visible across the observed range of radio frequencies (120–168 MHz). For the brightest pulse in our sample, we find that the spectral index of the pulse is extraordinarily steep and we determine the spectral index to be α = −4.1 ± 1.1 (Methods), with Sν ∝ να, where Sν is the flux density and ν the observing frequency. In addition, for the brightest pulse in our sample, we determine the linear polarization fraction to be 51 ± 6% for a Faraday rotation measure (RM) of 4.72 ± 0.14 rad m−2. No circularly polarized emission is detected in the pulses, with an upper limit of <1.6% on the circular polarization fraction for the brightest pulse. For the brightest pulse we reprocessed the raw imaging data with a 1-s time resolution (Fig. 1b), which reveals multiple subcomponents in the pulse. Furthermore, the high-time-resolution data allow us to constrain the dispersion measure (DM) to 16 ± 6 pc cm−3.
The Very Large Array (VLA) Low-Band Ionosphere and Transient Experiment (VLITE) archive was also searched for pulses from ILT J1101 + 5521 (Methods and Extended Data Fig. 3), but no additional pulses were found. Simultaneous Swift X-Ray Telescope (XRT) observations were carried out during the 2023 LOFAR observations, yielding an upper limit on the quiescent X-ray luminosity of (L < 1.6times 1{0}^{30}times {left[scriptstylefrac{d}{504,{rm{pc}}}right]}^{2},{rm{erg}},{{rm{s}}}^{-1}) (Methods).
A search in archival multiwavelength datasets on the coordinates of ILT J1101 + 5521 resulted in a match with a star catalogued in the Sloan Digital Sky Survey (SDSS) J110150.52 + 552119.9 (ref. 3), with an r-band magnitude r = 20.86 ± 0.05, whose Gaia Data Release 3 (DR3) position4 is 0.44″ offset from ILT J1101 + 5521, but within the astrometric uncertainty of the radio-derived position of ILT J1101 + 5521 (error in (RA, dec.) = ±(1.9″, 0.39″)). The probability of the optical source aligning with ILT J1101 + 5521 by chance is extremely small (~1 in 10,000; Methods) owing to the low stellar density at high Galactic latitudes. The geometric distance to this star based on Gaia Early Data Release 3 (EDR3) data is (50{4}_{-109}^{+148},rm{pc}) (ref. 5).
Spectroscopic follow-up (Extended Data Fig. 4) determined the spectral type of the star to be M4.5V and showed that the star has a substantial radial velocity variation of ~200 km s−1. The radial velocity as a function of time is shown in Fig. 2. A simple sinusoid describes the data well, indicating a close-to-circular binary orbit. We fit two sinusoids to the data, one where all fit parameters are unbound and one where we fix the period to the 125.5-min period of the radio pulses, with reduced chi-squared values of 0.62 and 0.79, respectively. There is no significant difference in goodness of fit between the two fits (Bayesian information criterion (BIC) of −107.0 versus BIC of −107.2), clearly showing that the period of the radio pulses is tied to the binary period. Figure 2 also shows the predicted radio pulse arrival time, according to the phase-connected timing solution (see the Methods for a detailed discussion). Assuming a stable orbital period that is equal to the period of the radio pulses, we find that the radio pulses are all emitted when the M dwarf is at superior conjunction with respect to its companion; that is, the M dwarf is seen to be behind and in line with the companion star from the perspective of an observer on Earth. Given the small chance alignment probability, the agreement between the DM of the radio pulses and the distance to the star (Methods), and the periodicity of the radio pulses being equal to the orbital period of this star, we conclude that ILT J1101 + 5521 is a binary system where one of the components is an M4.5V star.
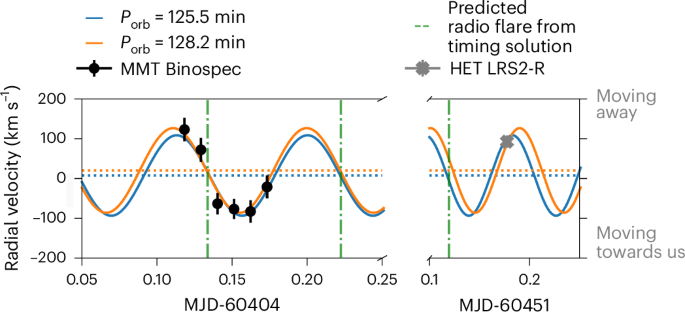
Calculated using MMT-Binospec (black points) and HET LRS2-R (grey point) observations, including 1σ errorbars. The orange line shows the best fit to the data, leaving all parameters free (BIC of −107.0). The blue line shows the best fit to the data if we fix the period to be the 125.5-min period of the radio pulses (BIC of −107.2). The dashed–dotted vertical green lines show the predicted pulse arrival time, according to the phase-connected timing solution. The horizontal dotted lines show the systemic velocities for each fit.
The SDSS ugriz3 and Pan-STARSS PS1 griz magnitudes6 yield colour–colour diagrams in which the candidate optical counterpart is consistently offset towards the blue with respect to the main locus of stars, suggesting that the binary companion to the optical star could be a white dwarf. Extended Data Fig. 5 compares ILT J1101 + 5521 with a sample of SDSS objects3 classified as stars with colour uncertainties <0.1 mag and within 30′ of ILT J1101 + 5521. This figure shows the blue excess, and additionally, it shows that ILT J1101 + 5521 fits the selection criteria used in ref. 7 to select white dwarf–M dwarf binaries.
We note that the blue excess could, in principle, alternatively originate from a star that is highly irradiated by a companion neutron star, as seen in some neutron star–M dwarf binary systems8. However, the maximum neutron star (spin-down) luminosity (4{uppi }^{2}Idot{P}/P), where P is the spin period and assuming I ≈ 1045 g cm2, is 1.6 × 1024 erg s−1. This is not sufficient to notably contribute to the u-band luminosity of 5.7 × 1024 erg s−1 Å−1 (Fλ = 2 × 10¹⁸ erg cm−2 s−1 Å−1 at 504 pc), after considering the distance between the stars and radiation efficiency. Figure 3 shows a simple least-squares fit to the broadband photometry with a model that allows a main-sequence star only (top) and a model that allows a main-sequence star and a white dwarf (bottom). The difference in BIC for both fits, BIC of 73 and BIC of 57, respectively, is very strong evidence that the latter model, including a main-sequence star and a white dwarf, is preferred. We constrain the M dwarf mass, white dwarf mass, temperature and distance through a Markov-chain Monte-Carlo likelihood analysis9 (Extended Data Fig. 6). We search for photometric and stochastic variability in the zi, zr and zg photometry from the Zwicky Transient Facility (ZTF10), but find no evidence for either (Extended Data Fig. 7). The lack of photometric variability excludes an alternative scenario in which the binary consists of two M dwarfs, and we conclude that the M dwarf companion is a white dwarf.
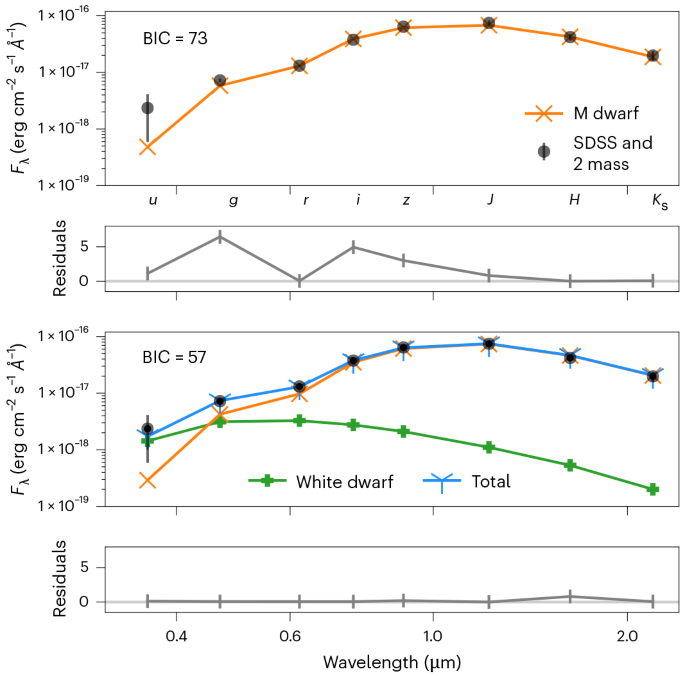
SDSS ugriz and 2MASS JHKs magnitudes with 1σ errors fit to a single M dwarf model and a combination of an M dwarf and a white dwarf model. Top: an M dwarf with a mass of M = 0.22 M⊙ at a distance of d = 410 pc produces the fit. Bottom: an M dwarf with a a mass of M = 0.18 M⊙ and a white dwarf with a mass of M = 0.63 M⊙ and effective temperature of Teff = 5,156 K at a distance of d = 322 pc produces the fit. The BIC for both fits is shown in the top left of the plot. The residuals are defined as ({left({O}_{i}-{C}_{i}right)}^{2}/{sigma }_{i}^{2}), where Oi is the observed value, Ci is the model value and σi is the error on the observed value. In these normalized residuals, the error bars take a value of 1.
Using the radial velocity amplitude measurement shown in Fig. 2, we apply the binary mass function to constrain the mass of the white dwarf as a function of orbital inclination, as shown in Fig. 4. The binary mass function is defined as
where MWD is the mass of the white dwarf, MMD is the mass of the M dwarf, i is the inclination of the binary orbit, Porb is the orbital period, KMD is the observed radial velocity of the M dwarf and G is the gravitational constant. Here, we assume a mass of 0.188 M⊙ for the M dwarf (which is a result of the broadband photometry fit, 0.188 ± 0.01 M⊙; Fig. 3), a period of 125.5 min and a radial velocity amplitude of 98 ± 14 km s−1. We find that, even for a white dwarf companion as light as 0.2 M⊙, the inclination of the system has to be smaller than 40°. In the known sample of interacting white dwarf–M dwarf binaries, the white dwarf typically has a mass larger than 0.6 M⊙(ref. 11). Extended Data Fig. 8 shows that, for white dwarf masses above ~0.25 M⊙, the point of gravitational equipotential between the two stars (Roche–Lobe radius) would equal the stellar radius of the M dwarf.
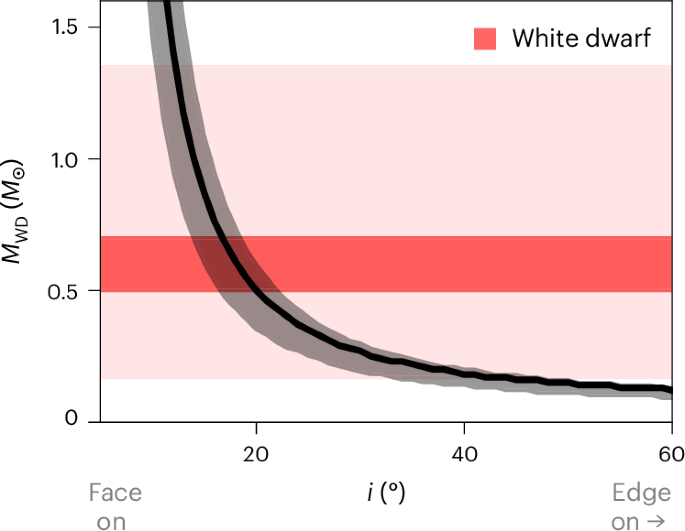
The black line shows the allowed companion mass for each inclination (the shaded region around the black line indicates the 1σ error around the mean). A radial velocity amplitude of 98 ± 14 km s−1 and an M dwarf mass of 0.188 M⊙ are assumed. In the background we show typical mass ranges of isolated white dwarfs in dark red (0.5–0.7 M⊙(ref. 106)) and the full range of known white dwarf masses (0.17–1.35 M⊙(refs. 107,108)) in the lighter shade of red.
The radio pulses are incompatible with typical low-frequency stellar radio emission from M dwarfs in terms of luminosity (by five orders of magnitude) and polarimetric properties12,13 (Methods). Therefore, we conclude that the radio emission originates from the white dwarf or the interaction between the white dwarf and the M dwarf. The high linear polarization fraction indicates the presence of strongly ordered magnetic fields, often found around white dwarfs14. White dwarf–M dwarf binaries with highly magnetic white dwarf are the only systems next to neutron stars that are confirmed to emit coherent radio pulses. AR Scorpii15 and J1912–4410 (ref. 16) are examples of white dwarf binaries that show periodic radio emission, with pulse periods on the order of minutes and orbital periods of about 4 h.
A promising evolutionary model for magnetic white dwarfs in close binary stars is described in detail in ref. 17. The model relies on the late appearance of a high magnetic field, potentially due to a crystallization- and rotation-driven dynamo. A strong white dwarf magnetic field can connect with the field of the M dwarf and provide a synchronizing torque on the white dwarf spin. AR Scorpii and J1912–4410 are thought to be in the beginning stages of the synchronization process. The shorter orbital period of ILT J1101 + 5521 (compared with AR Sco and J1912) indicates that the binary system is in the polar stage, where the synchronization process is complete and the M dwarf fills its Roche–Lobe again. This implies that for ILT J1101 + 5521 the white dwarf spin period has synchronized to the orbital period. A more detailed comparison of AR Sco, J1912 and ILT J1101 + 5521 is given in the Methods.
For polars, the magnetic field strength of the white dwarf has increased to over ~10 MG (ref. 18). The formation of an accretion disk is suppressed, but accretion does occur directly onto the magnetic pole of the white dwarf. Polars enter states with little to no accretion, and during these times the system appears as a practically detached white dwarf plus M dwarf system11,14. No sustained accretion seems to occur for ILT J1101 + 5521 based on the lack of X-ray emission19. Typical X-ray flux in bright accretion phases of polars is around 5 × 10⁻¹³ erg cm−2 s−1(refs. 20,21), compared with the Swift X-ray upper limit of 5.1 × 10⁻¹⁴ erg cm−2 s−1 for ILT J1101 + 5521 (Methods). We note that the accretion state of polars changes on timescales of months21, and the X-ray observations are from December 2023, 3 years after the observed radio pulses.
In addition, the presence of radio pulses indicates little to no accretion, which would probably disturb the creation of coherent radio emission, similar to state-transitioning millisecond pulsar systems (for example, ref. 22). A 125-min period with a M4.5V spectral type donor as observed for ILT J1101 + 5521 sits well within the population of polars (see fig. 7 in ref. 23). Typical polars have a white dwarf mass (~0.6 M⊙) and white dwarf effective temperatures of less than 11,000 K (ref. 11). The temperature of the white dwarf in ILT J1101 + 5521 is likely to be lower (Teff between 4,500 K and 7,500 K; Extended Data Fig. 6), indicating a more evolved system compared with the known sample from optical surveys, which are observationally biased to find hotter systems.
The exact mechanism that produces the radio emission is unknown, but, given the polar configuration, it seems most natural that we observe pulsed radio emission due to beaming effects. Here, we observe the system in a certain geometry (superior conjunction, when the M dwarf is seen to be in line with and behind the white dwarf) once per orbital cycle, effectively looking down a beam of radio emission. In this case, the highly intermittent nature of ILT J1101 + 5521 (pulses are seen in one-quarter of the observed orbits) could be explained by a strong variation in the brightness of the coherent radio emission, similar to what has been proposed for rotating radio transients24. The steep spectral index of the brightest radio pulses indicates that the spectrum could be similar to the drastic cut-off seen for electron cyclotron maser instability (ECMI) emission25. ECMI emission might explain the radio emission from ILT J1101 + 5521 as magnetic coupling between the M dwarf and white dwarf is confirmed to occur for polar systems14,17. Faint circularly polarized minute-duration radio flares have been observed from polar systems at high frequencies26. These flares are thought to occur due to ECMI emission caused by the M dwarf moving through the white dwarf magnetosphere. The radio emission from ILT J1101 + 5521 is clearly distinct, as it is observed at much lower frequencies, and the pulses are much brighter and highly linearly polarized. Some of these differences might be explained by invoking a relativistic version of ECMI emission27.
Although the energy budget is such that the observed radio luminosity could originate from the rotation of the white dwarf (Methods), we argue that the more likely scenario is that the radio emission comes from the interaction of the M dwarf with the white dwarf magnetic field. Alternatively, the radio emission could be triggered by the reconfiguration of the magnetic field (see, for example, refs. 28,29,30,31,32) or, in a more exotic scenario, the radio emission could come from accretion of material onto the magnetic pole of the white dwarf (at very low accretion rates), in a similar fashion to ref. 33 or ref. 34. The high Galactic latitude of ILT J1101 + 5521 makes it easier to study via multiwavelength observations. This will allow us to further study the exact geometry of this binary system, the properties of the two stars and the detailed emission mechanisms at play.
We know of a small population of long-period transient radio sources (periods longer than 10 min)35,36,37,38. None of the previously detected long-period radio sources has a known binary companion, and the periodicity of the pulses is argued to originate from the spin period of either a neutron star or a white dwarf. ILT J1101 + 5521 is the first long-period radio source that is confirmed to be a binary and the only one with a confirmed white dwarf companion. Furthermore, the radio pulses from ILT J1101 + 5521 have been shown to occur at the orbital period, and at the time of stellar conjunction. We provide a more detailed comparison of ILT J1101 + 5521 with the other long-period radio sources in the Methods. ILT J1101 + 5521 reveals that there are probably multiple progenitors that can produce long-period radio pulses. More speculatively, the existence of ILT J1101 + 5521 may provide an analogy for understanding periodically active fast radio burst sources39, which could originate from highly magnetized neutron stars interacting with a massive stellar companion40.
Methods
LOFAR observations and pulse search analysis
The LOFAR41 is a radio telescope that is composed of many thousands of dipole antennas grouped into stations. The LoTSS1 aims to image the whole northern sky using 3,168 pointings. The survey has had two major data releases so far: Data Release 1 (DR1)42 covering 58 pointings and Data Release 2 (DR2)43 covering 814 pointings, spanning 5,635 deg2. LoTSS observes between 120 MHz and 168 MHz. The flux densities of detected sources are referenced to a central frequency of 144 MHz.
In ref. 2, a transient detection pipeline is described that looks for transient sources in 8-s to 1-h image snapshots. The transient detection pipeline uses the Live Pulse Finder (LPF)44. Transient candidates are marked for further inspection if their position in the snapshot image does not correspond to the position of a known source from the LoTSS catalogue, indicating that the source is visible for only a small part of the full 8-h integration. This transient detection pipeline was tested on a small subset of 58 LoTSS pointings, corresponding to the DR1 fields2. For each of these pointings, only the most sensitive part of the primary beam is considered (an inner circular region with a radius of 1.5°).
ILT J1101 + 5521 was detected in the P164+55 pointing in two 8-s snapshots and the 2-min snapshot that encompasses this interval. Reference2 lists all the steps that were undertaken to test whether ILT J1101 + 5521 is a genuine astrophysical source or whether the signal is an imaging artefact. Once ILT J1101 + 5521 was firmly established as an astrophysical source, additional imaging steps were undertaken to characterize it. This included reimaging the raw visibility data (without subtracting the sky model) with WSCLEAN45 with increased padding, and deconvolution cycles to obtain snapshot images with the lowest-possible root mean square (RMS) noise. The imaging parameters that were changed from default settings are as follows: the minimum and maximum UV values that are gridded (-minuv-l and -maxuv-l) of 50 and 60,000, respectively, -weight briggs -0.2, -auto-mask 3 and -auto-thresholding 0.3. These parameters are tested in ref. 2 and work well to effectively image point sources. An example of an 8-s image is shown in Supplementary Fig. 1. This is a small cut-out of the full 2.3 × 2.3° image, and shows that the sources are point-like and that there are no imaging artefacts that influence the position and/or flux measurement of ILT J1101 + 5521. In addition, in these new images we use PYSE, a more commonly used source finder that fully captures the properties of point sources in radio images46. Extended Data Fig. 1a shows the light curve corresponding to the pulse detected in the 2015 dataset. The two black crosses show the flux density (top) and signal-to-noise ratio (bottom) of the initial detection in the transient detection pipeline (with LPF). It is clear that the improved imaging settings optimize the signal-to-noise ratio of the pulse.
After discovery of this initial pulse, we searched the LOFAR archive for data where the position of ILT J1101 + 5521 lies within the observed field of view. Four additional observations of the P164+55 field were found in the LOFAR Long Term Archive. Again, these observations had an averaged integration time of 8 s, the total observations were 8 h and the direction-independent calibrated data products were readily available. The same methods as in ref. 2 were applied, and six additional pulses were found. Extended Data Fig. 1 shows the flux and signal-to-noise ratio profiles for these pulses. The two pulses identified in the 2020-12-29 dataset are just slightly above the signal-to-noise ratio threshold of 6 used to identify candidate pulses. This signal-to-noise ratio was chosen to perform a slightly deeper search than following the original method with a signal-to-noise ratio of 6.94 (ref. 2). After the reimaging procedure, one of the pulses turned out to be spurious. For all archival data, we reduced the signal-to-noise ratio to 5 to see whether any additional pulses could be identified. The few candidates that we found turned out to disappear after reimaging (similar to the first pulse detected on 19 December 2020; Extended Data Fig. 1, top right). An overview of the observations and detected pulses is shown in Extended Data Table 1. After establishing that we had robustly identified seven bright pulses from this source, we obtained additional LOFAR observations through Director’s Discretionary Time (project DDT20_005). Here, we conducted simultaneous beamformed and imaging observations, to obtain both high spatial resolution and subsecond time resolution for any new pulses. Unfortunately, during these observations, no additional pulses were identified. The few candidates that were initially identified after dropping the detection threshold to a signal-to-noise ratio of 5 turned out to disappear after properly reimaging (Extended Data Fig. 1, bottom column).
Periodicity search and timing of the radio pulses
Despite the limited number of radio pulses, we performed a search for any potential underlying periodicity in their arrival times. First we computed the ToA of each pulse. We then barycentred the ToAs before doing any further analysis. Typically, a template is used to compute ToAs, but due to the dearth of pulses to create a stable radio profile for template creation, we decided to use every pulse for the ToA calculation individually by fitting a Gaussian to each pulse to compute the ToA on the basis of the estimated peak of the Gaussian. We note that the uncertainty on the ToA is driven purely by the goodness of fit, which is dependent on the signal-to-noise ratio of each pulse. To get a first estimate of the period, we run the barycentered ToAs through a simple folding algorithm (https://github.com/evanocathain/Useful_RRAT_stuff) that is often used for highly intermittent sources, such as rotating radio transients. For ILT J1101 + 521 we have 7 ToAs, implying 21 unique time differences. Supplementary Fig. 2 shows the number of time differences (between pulse ToAs) that are matched given a certain period, trialling periods from 8 s to 360 min with a timestep δt = 0.01 s and maximum 2% tolerance in phase to count as a match. This threshold was chosen as it is similar to the phase tolerance identified for GPM J1839–10 (ref. 37) and GLEAM-X J162759.5–523504.3 (ref. 36). We find that a period of 125.52 min, indicated by the red star, lines up all the pulse ToAs to within 2% of a full cycle, and we find that this period is preferred over its harmonics.
In addition, we used ALTRIS (Morello et al., in preparation) (https://github.com/v-morello/altris) a brute-force search algorithm that fits the integer number of rotations within all the gaps between consecutive ToAs. The algorithm attempts to recursively discover the rotation counts under the assumption that a tentative solution for some n shortest gaps is known. Then, a phase model is fitted to the ToA gaps, from which a range of possibilities for the rotation count n + 1 is calculated. If no integer rotation counts are possible, the solution is discarded; otherwise, the algorithm attempts to further expand the set of new tentative solutions for the first n + 1 gaps. Using this technique, we found the best period of 125.34 min with a Q-factor of 225.6, where the Q-factor is the goodness-of-fit metric for the period (Q(Q=scriptstylefrac{1}{{sigma }_{{mathrm{ph}}}}), where σph is the RMS of the offset of time of the peak of the pulse from the predicted arrival time of the peak). The Q-factor is a measure of the signal-to-noise ratio of the detected period. Hence, one can use this to estimate the uncertainty on the period as (scriptstylefrac{3}{Q}times P) to obtain a 3-σ uncertainty of 1.6 min. We note that, once we use this period as an initial guess for the timing model, the uncertainty on the period is reduced substantialy after the fit to the ToAs as described below. Then, we used TEMPO2 (ref. 47) to fit a simple timing model to the barycentred ToAs. We used only the spin frequency (F0), here also a proxy for the orbital period, as a fitting parameter, keeping the best-known position (RA, dec.) as a fixed parameter. We first phase-connected the six ToAs that were close in time to each other (spanning 10 days) to obtain an RMS of 23.476 s. Projecting that solution back to the first ToA about 4 years before, we obtain a 1σ timing RMS of 26.203 s. Extended Data Fig. 2 shows the timing residuals after subtracting the best-fit timing solution from the ToAs. We note that, if we use the best-fit timing solution obtained from the six ToAs spanning 10 days and extrapolate that to the first ToA 4 years ago, the ToA is offset from the model by only 15–20% of the pulse period. Hence, we infer that, while complete phase connection over the 4 years cannot be guaranteed. The best-fit timing model reasonably predict the ToAs in the future. We provide our best-fit parameters for both timing solutions in Supplementary Table 1. The error quoted in the main text is obtained from the most refined estimate of the period and uncertainty from the timing model as computed by TEMPO2 (ref. 47). The RMS of the residuals can now be used to derive the upper limit on the period derivative. If the timing model does not take into account the period derivative, one would expect a parabolic deviation of the ToA residuals as a function of time. Because we do not see that trend, we assume that the deviation is within the three times the RMS we obtain on the ToA residuals. Thus, the limit on the period derivative
where σToAs is the uncertainty-weighted RMS of the timing residuals, P is the spin period and T is the total observing span. This gives us an upper limit of 1.711 × 10⁻¹¹ s s−1 for the period derivative regardless of the origin of the period (spin or orbital origins).
Figure 1a shows the light curves of the LOFAR detections folded with a period of 125.52978 min. The smallest time window that fully captures all pulses implies a duty cycle of ~2%, as well as a jitter in the pulse arrive times of ~1% of the pulse period.
Astrometry of the radio pulses
Based on the five pulses that were identified with peak flux densities of >68 mJy per beam, we perform an astrometric correction on the images to get the most accurate position possible. Using three bright (>200 mJy) point sources close to ILT J1101 + 5521 (within 10′), we define the astrometric offset as the distance between the position of these bright point sources in the snapshot images and their LoTSS catalogue position. Subsequently, we shift ILT J1101 + 5521 in each snapshot according to this systematic offset. The position is then determined again in each snapshot, and the final position is determined by averaging the positions weighted by the signal-to-noise ratio of ILT J1101 + 5521 in the specific snapshot. This yields (RA, dec.) (J2000) = 165.4605° ± 1.9″, 55.35545° ± 0.39″, or RA (J2000) = 11 h 1 min 50.5 s ± 1.9 s and dec. (J2000) = +55° 21′ 19.6″ ± 0.39″. In addition, we check our procedure by applying FITSWARP48 to our images. This software is also designed to dedistort ionospheric effects in the image plane. We find a similar correction, that (within errors) matches the result from the aforementioned procedure, but with larger error bars (±10″) on the position.
Pulse polarization and Faraday RM
We estimate the Faraday RM using RM-TOOLS49 from the Canadian Initiative for Radio Astronomy Data Analysis. For the three brightest pulses, we take the 8-s time slices with the highest total intensity and create full Stokes images with 12 frequency channels. Performing a fit to the Stokes Q and U images, we find RMs of 4.503 ± 0.015 rad m−2 for the L801324 pulse, 4.72 ± 0.14 rad m−2 for the L801366 pulse and 4.457 ± 0.033 rad m−2 for the L801380 pulse. We note that a large polarization position angle swing over the duration of the pulse would distort this result. The apparent variability in RM can be ascribed to the time-variable ionospheric RM contribution, 0.32 ± 0.1, 0.45 ± 0.1 and 0.28 ± 0.1 for the respective pulses. To estimate the RM contribution from the Ionosphere, we used the IONFR software50 (https://github.com/csobey/ionFR). The code computes the RM expected from the Ionosphere as a function of time for any given day by using the total electron content and the goemagnetic field estimates published by the Global Navigation Satellite System (https://cddis.nasa.gov/). These RMs are consistent with the contribution from the smoothed Galactic foreground51, precluding the presence of significant local RM contribution from the corona or wind of a star in the system. We find peak linear polarization fractions of (5{1}_{-6}^{+6} %) for the L801324 pulse, (1{3}_{-3}^{+5} %) for the L801366 pulse and (4{2}_{-5}^{+7} %) for the L801380 pulse. No significant circular polarization is detected at the position of ILT J1101 + 5521 in the Stokes V images for any of the pulses in our sample. Performing a forced-flux extraction in the Stokes V images, we find circular polarization fractions of <1.6% for the L801324 pulse, <1.6% for the L801366 pulse and <4.2% for the L801380 pulse. These estimates are limited by the local noise in the Stokes V images.
Dynamic spectrum and DM
The average time resolution of 8 s does not allow a sensitive dispersion analysis. We thus extract the original data products for the observations of the brightest pulse from the LOFAR Long Term Archive (project code LT14_004) and reprocess at the highest-possible time resolution of 1 s. Figure 1b shows the temporal profile and the dynamic spectrum of the reprocessed data for the bright L801324 pulse (Extended Data Table 1). The higher time resolution reveals that the pulse consists of at least two components. The temporal profile was obtained by running the LPF source finder on the 1-s Stokes I images with a signal-to-noise ratio threshold of 3. No clear dispersion track is visible in the dynamic spectrum. We used the LORDS (https://gitlab.com/kmrajwade/lordss) software suite to estimate a DM value of 16 ± 6 pc cm−3 (Supplementary Fig. 3). LORDS is an image-plane dedispersion software specifically written to dedisperse transients found in radio imaging surveys (Rajwade et al., in preparation). The Galactic DM in the direction of ILT J1101 + 5521 to a distance of 504 pc (estimated distance to the M dwarf star) is ~10 pc cm−3 based on the NE2001 electron density model52,53. Within errors, the DM is consistent with the distance to the star. We note that the electron density models in directions well off of the Galactic plane (b = 55.5200° ± 0.0001° for ILT J1101 + 5521) are not constrained as well as directions closer to the Galactic plane.
The best estimate for the spectral index is obtained from the in-band spectrum of the brightest pulse in L801324, as shown in Fig. 1b. The best fit for the first component is α = −4.5 ± 1.0, and α = −4.8 ± 1.0 for the second component, assuming S ∝ να, where Sν is the flux density and ν is the observing frequency. Averaging over the full pulse, we obtain a very steep spectral index of α = −4.1 ± 1.1. However, we caution that the spectrum is not necessarily well described as a power law.
VLITE observations and analysis
The VLITE (vlite.nrao.edu)54,55 is a commensal system capable of continuously accessing 64 MHz of bandwidth (centred on 352 MHz) from the 236–492 MHz Low-Band system deployed on the National Radio Astronomy Observatory’s Karl G. Jansky Very Large Array. VLITE has been operational since November 2014 recording data from up to 18 antennas during nearly all regular VLA observations. Because VLITE accumulates a large amount of data, an automated calibration and imaging pipeline has been developed54 that calibrates the visibilities and produces self-calibrated images. The VLITE Database Pipeline56 then takes these images and creates a source database using the PyBDSF57 source finding algorithm.
We searched the VLITE Database at the position of ILT J1101 + 5521, but found no catalogued source. We reprocessed all archival VLITE observations within two degrees of ILT J1101 + 5521 where the VLA was in the high-resolution A or B configuration. The images were broken into 60-s snapshots to match the pulse length of ILT J1101 + 5521 and maximize the VLITE sensitivity given the measured steep spectral index. The 225 resulting images were searched by PyBDSF for any source above 5σ and then visually inspected for emission at lower levels for the target position. In the same manner, we searched all 103 VLITE Commensal Sky Survey (VCSS)58 28-s snapshot images from six separate days between 2017 and 2023 that cover the source position. Emission was not detected in either the VLITE or VCSS snapshots.
ILT J1101 + 5521 falls between 0.9° and 1.9°, with an average offset of 1.3°, from the correlation centre of the archival VLITE data, resulting in substantial sensitivity loss due to the instrumental response. The VCSS snapshots are observed in highly overlapping, continuous dec. scans across the sky. Similar to the targeted images, the average source position is 1.2° from the VCSS correlation centre, although it ranges from 0.5° to 1.7°. Due to the telescope movement during each of the 28-s VCSS frames, there is a slight additional loss of sensitivity. In Extended Data Fig. 3, we plot the 3σ upper limits from VLITE and VCSS snapshots together with the LOFAR detections and predicted 340-MHz flux on the basis of the measured full pulse spectral index and its uncertainty. Finally, we reimaged the VLITE data between November 2017 and September 2023 with snapshot cadences of 8 s and 2 s to search for signatures of very bright pulses. No emission was detected, and we place 5σ upper limits on bright pulses at 350 and 700 mJy per beam for the 8-s and 2-s cadences, respectively. Archival VLITE and VCSS observations are not sensitive to pulses as steep as measured for the brightest ILT J1101 + 5521 burst (α = −4.1 ± 1.1) as indicated by Extended Data Fig. 3 (bottom). VLITE and VCSS would be sensitive to flatter spectrum or brighter pulses, but unfortunately the temporal coverage in the archive is sparse for this position, making it difficult to rule out such possibilities.
Chance alignment probability with optical counterpart
We performed a cone search through the available optical and near-infrared catalogues using VIZIER59 around the position of ILT J1101 + 5521. This search yields an optical source at RA (ICRS) of 11 h 1 min 50.5698 s and dec. (ICRS) of +55° 21′ 19.738″, which is 0.44″ offset from ILT J1101 + 5521 but within the astrometric uncertainty of the radio-derived position of ILT J1101 + 5521 (error in (RA, dec.) is ±(1.9″, 0.39″)). To identify the probability of chance association we extract all the sources that lie within a radius of 3° around the position of ILT J1101 + 5521 in Gaia EDR3 (refs. 60,61). We do not apply any other filters to the Gaia catalogue. Subsequently, 106 random positions within this patch are drawn and we determine the number of times one of these random positions falls within half an arcsecond of a Gaia source. We find that this happens in only 143 cases and therefore conclude that the probability of chance alignment is P < 0.00014. The 3° radius and 106 random trial positions were chosen to obtain large samples to increase the robustness of the chance alignment test.
Spectroscopic observations of the M dwarf
We observed the M dwarf associated with ILT J1101 + 5521 using the Binospec optical spectrograph62 on the 6.5-m Multiple Mirror Telescope (MMT) located at the MMT Observatory on Mt. Hopkins, Arizona. The observation occurred on 4 April 2024 starting at 02:42:49 UTC. We observed the M dwarf with 6 × 900 s exposures, using a 1.0″ long slit and a 270 l mm−1 grating, set to a central wavelength of 6,560 Å, and using the LP3800 blocking filter. This resulted in spectral coverage from ~3,900 to 9,300 Å with an average spectral resolution of R ≈ 1,530. Conditions were near photometric at the time of observation, with an average seeing of 1.2″, and the airmass ranged from ~1.1 to 1.3 throughout the observation.
We reduced all observations using pypeit63, with dome flat and arc lamp calibration files obtained on the same night and instrumental configuration. We used standard pypeit parameters for Binospec, resulting in a signal-to-noise ratio averaged over each optimally extracted spectrum of ~2–3. We then flux calibrated each spectrum with a sensitivity function derived from the standard star G191-B2B obtained in January 2024 and corrected the spectra for telluric absorption using an atmospheric model for the MMT Observatory.
In addition, we observed an optical R = 2, 500 spectrum of the M dwarf associated with ILT J1101 + 5521 using the LRS2 (ref. 64) instrument on the Hobby–Eberly Telescope65,66. We used the LRS2-R unit on the red channel from 6,450 to 8,420 Å. We reduced the LRS2 spectrum using the publicly available Panacea pipeline (https://github.com/grzeimann/Panacea), which performs basic reduction tasks, wavelength calibration, fibre extraction, sky subtraction and flux calibration.
Extended Data Fig. 4 shows the LRS2-R spectrum and a coadded spectrum of the six epochs obtained with Binospec. The absolute flux levels of the ILT J1101 + 5521 optical spectra vary between the two facilities and epochs owing to variations in the sensitivity functions and possible intrinsic variability in the M dwarf (Extended Data Fig. 7 and ref. 67). The highlighted regions in Extended Data Fig. 4 are used for radial velocity fitting below. To determine the spectral type of the M dwarf we fit the obtained spectra to a range of spectral templates, including the ATLAS-T spectra68 obtained with the Large Sky Area Multi-Object Fiber Spectroscopic Telescope, a suite of Keck LRIS spectra of late-M dwarfs69, UVES/VLT high-resolution spectra of late type subdwarfs70 and a complete M spectral type sequence for a sample of confirmed young sources71 (obtained from http://svo2.cab.inta-csic.es/theory/newov2/index.php). We find that an M4.5V spectrum fits our data best, but we cannot confidently rule out an M4.0V star.
Next, we use the individual epochs to look for a radial velocity signature. In the following, we opt to use the ref. 69 M4.5V model, as the resolution of 1.9 Å is similar to the binned resolution of our observations and the wavelength range overlaps our data. To obtain the Doppler shift of the individual epochs, we select a particular wavelength range. We avoid the noisy edges of the LRS2-R spectrum and disregard data below 8,300 Å and above 8,300 Å (Extended Data Fig. 4). For consistency, we therefore also consider only the spectral range between 6,500 Å and 8,300 Å for the Binospec data. In addition, the signal-to-noise ratio (before binning) is below 3 in each spectral bin for Binospec data below 6,500 Å. Therefore, we cannot be confident that the data are a good representation of the intrinsic spectrum, including potential emission and absorption lines. In this wavelength range, the Binospec data have a resolution of 1.3 Å. We bin the data by a factor of 2 and fit the template to the data while applying a Doppler shift.
For AR Scorpii15 and J1912–4410 (ref. 16), the radial velocity profile was extracted separately for the Hα emission line (6,562.8 Å). When compared with the absorption lines in the other parts of the spectrum, it was found that the Hα shows a different radial velocity profile. This is because this line probably originates from the irradiated face of the M dwarf and is not expected to show the same amplitude as the star’s centre of mass. The difference between the two radial velocity profiles can be used to place constraints on the mass ratio of the system, as shown in refs. 15,16. The Hα line in the individual Binospec spectra does not have a sufficient signal-to-noise ratio to perform a useful radial velocity fit. For the LRS2-R spectrum, however, we determine the Hα centre wavelength to be 6,563.77 ± 0.21 nm. This corresponds to a radial velocity of 44.3 ± 10.3 km s−1, which is notably smaller than the radial velocity obtained from fitting the full spectrum to an absorption line spectrum (92.7 ± 15.5 km s−1). This offset is indicative of the aforementioned scenario, where the Hα emission line originates from the irradiated side of the M dwarf. We leave it to future work to fully probe the Hα radial velocity profile and place further constraints on the mass ratio of the system.
We note that excluding the Hα line from the radial velocity analysis does not affect the outcome in a way that would alter our conclusions. The signal-to-noise ratio in the blue part of the Binospec spectra is insufficient to observe the absorption lines we might expect from the white dwarf (for example, ref. 72).
Swift XRT observations and analysis
To search for any flaring activity of ILT J1101 + 5521, we proposed for Swift observations during the L203* observing runs (Extended Data Table 1). We obtained four individual visits using the XRT73 in December 2023 for a total time of 13.3 ks on source. We do not find any flares, as no photons are detected at the position of ILT J1101 + 5521. The 3σ upper limit that we find by stacking all observations is a count-rate limit of 1.43 × 10⁻³ counts s−1 (0.3–10 keV). Based on the position of ILT J1101 + 5521, we predict an absorbing Galactic column density of NH ≈ 8.7 × 1019 cm−2. This estimate was obtained using the web version of the nH tool74 in HEASOFT75. To convert the count rate upper limit to unabsorbed flux limits, we use WEBPIMMS (https://cxc.harvard.edu/toolkit/pimms.jsp) and assume two spectral models for a pulsar or magnetar, following ref. 76. In the first scenario, we assume thermal emission from a young pulsar, implying a blackbody spectrum with kT = 0.3 keV. In the second scenario, we assume non-thermal emission from an energetic pulsar, for which the corresponding spectral scenario is a power law with index Γ = 2. These two scenarios yield unabsorbed flux limits of 3.3 × 10⁻¹⁴ erg cm−2 s−1 and 5.1 × 10⁻¹⁴ erg cm−2 s−1, respectively. This translates to (L < (1-1.6)times 1{0}^{30}times {left[frac{d}{504,{rm{pc}}}right]}^{2},{rm{erg}},{{rm{s}}}^{-1}).
Swift UV/Optical Telescope observations and analysis
During the Swift XRT observations described above, ILT J1101 + 5521 was also simultaneously observed using the Swift UV/Optical Telescope (UVOT77). We use several HEASOFT75 tasks to obtain an upper limit on the UV flux by combining all observations. UVOTSOURCE was used to combine extensions within one visit and extract source and background information, UVOTIMSUM was used to combine the visits and UVOTSOURCE was used to determine the flux upper limit at the ILT J1101 + 5521 position. We use an extraction radius of 15″ on the source location and to determine the background flux. The UVOT flux limit is <1.0 × 10⁻¹⁷ erg s−1 cm−2 Å−1 in the uvm2 filter at 2,246 Å. We note that the data quality of these UVOT observations is low. All point sources show up as double point sources, which is caused by the attitude control problems of the Swift satellite during the period of early August 2023 until the beginning of April 2024 (due to problems with one of the three on-board gyroscopes; for more details, see refs. 78,79). Unfortunately, all our UVOT data (taken in December 2023) are affected by this issue. We take this into account by increasing our source extraction radius to 15″.
M dwarf colour–colour diagram
Extended Data Fig. 5 compares ILT J1101 + 5521 with a sample of SDSS objects3 classified as stars with colour uncertainties <0.1 mag and within 30′ of ILT J1101 + 5521. The dashed red line shows the colour–colour selection of white dwarf–main-sequence binaries from ref. 7. Due to selection effects, the vast majority of SDSS white dwarf-main sequence binaries contain a low-mass M-dwarf companion80. The selection criteria in ref. 7 should include white dwarfs with effective temperatures ranging from 6,000 to 100,000 K and with surface gravities ranging from 6.5 to 9.5 dex, and secondary star M-dwarf spectral types (M0–M9). The uncertainties on the colours of ILT J1101 + 5521 are large, but Extended Data Fig. 5 indicates a blue excess and shows how ILT J1101 + 5521 could be interpreted as a white dwarf–M dwarf binary.
Broadband photometry fits
To constrain the parameters of a possible binary consisting of a white dwarf and a main-sequence star, we compare the observed ugriz magnitudes from the SDSS Data Release 16 (DR16)3 and the Two Micron All-Sky Survey (2MASS) JHKs magnitudes (ref. 81) to absolute magnitude predictions in the same bands from white dwarf cooling models with hydrogen atmospheres (http://www.astro.umontreal.ca/~bergeron/CoolingModels)82,83,84 and stellar evolutionary tracks85,86,87. The models are interpolated over the stellar mass, white dwarf mass and white dwarf effective temperature, and the summed flux is corrected for the distance and absorption using an Eg–r = 0.011 reddening value88 and RV = 3.1 extinction values89.
White dwarf parameters via MCMC fitting
Through a Markov-chain Monte-Carlo likelihood analysis9, the observed magnitudes are well matched for a stellar mass of MMD = 0.188 ± 0.010 M⊙ at a distance of d = 333 ± 25 pc (Extended Data Fig. 6). The white dwarf mass and the white dwarf effective temperature range are degenerate, with Teff ranging from 4,500 to 7,500 K for masses of MWD = 0.2–1.3 M⊙. The UVOT upper limit (<1.0 × 10⁻¹⁷ erg s−1 cm−2 Å−1 at 2,246 Å; Methods) is consistent with white dwarfs in this temperature and mass range. The distance following from the Markov-chain Monte-Carlo likelihood analysis is smaller than the Gaia geometric distance of (50{4}_{-109}^{+148},rm{pc}), but the distance estimates are consistent within 2σ.
Extended Data Fig. 6 shows the one- and two-dimensional projections of the posterior probability distributions of the parameters used to fit the broadband photometry data presented in Fig. 3. We use flat priors Teff ϵ {3,000, 12,000} K, MWD ϵ {0.2, 1.3} M⊙ and MMS ϵ {0.09, 0.5} M⊙ and do not put a prior on the distance. The distance of d = 333 ± 25 pc is offset from the Gaia geometric distance estimate of (50{4}_{-109}^{+148},rm{pc}). We try setting a Gaussian prior on the distance (μ = 504 pc and σ = 109 pc) but find that the model quickly converges to a shorter distance again, with a preferred distance of d = 337 ± 25 pc.
ZTF photometry and analysis
Photometric variability might be expected from a close binary such as ILT J1101 + 5521, either at the orbital period due to irradiation of the M dwarf by the white dwarf90 or at half the orbital period by ellipsoidal variations from the (close to) Roche–Lobe-filling M dwarf91. We analyse the zi, zr and zg photometry from the ZTF10 for ILT J1101 + 5521. Overall there are 592 data points publicly available in the three filters, where we rejected any points that were obtained in non-optimal conditions (non-zero quality flags) following the recommendations in the ZTF pipeline. This left a total of 451 photometric points with 36 in the zg filter, 327 in the zr filter and 88 in the zi filter, which we used for our analysis. From the ZTF photometry, we find no evidence for modulations at the orbital period or half the orbital period in the periodograms of the ZTF photometry (Extended Data Fig. 7). We note that there are hints of two peaks at 70.3 min and 71.4 min seen in the zr and zi bands, respectively (Extended Data Fig. 7, pink cross). However, although these two peaks do not correspond to any peaks in the window functions of the datasets, as the two periods are sufficiently different from each other and correspond to false alarm probabilities around 0.1%, we conclude that the data do not show significant detections of photometric variability.
To probe the sensitivity of the ZTF data to detecting signatures of photometric variability, we performed injection tests where we injected sinusoidal variations with a period of 125.52 min with various amplitudes in the data. Doing so, we place an upper limit of 0.1 mag in the zr data and 0.05 mag in the zi data. The expected ellipsoidal variations using the equations in ref. 92 for a white dwarf–M dwarf system are expected to have ellipsoidal variation amplitudes at or below the detectability threshold of the ZTF filters, in agreement with the non-detections in the ZTF filters.
Assuming an M dwarf radius of RMD = 0.217 R⊙ and an orbital separation of a = 0.76 R⊙ (for an M dwarf with mass 0.188 M⊙ and a white dwarf with mass 0.6 M⊙), we calculate the maximum inclination angle on the basis of the fact that we do not see eclipses in the ZTF data. We find i < 74°. Similarly, we estimate the irradiation luminosity from the white dwarf on the M dwarf. ({L}_{{mathrm{irr}}}={L}_{{mathrm{WD}}}times frac{pi {R}_{{mathrm{MD}}}^{2}}{4uppi {a}^{2}}=0.02{L}_{{mathrm{WD}}}). We thus expect the white dwarf to at most contribute to the luminosity of the M dwarf at a level of ~2%. This is consistent with the ZTF data where we do not find any evidence for photometric variability due to irradiation. Finally, we can rule out an M dwarf–M dwarf binary scenario from the lack of photometric variability in the ZTF data (at twice the orbital period). From the binary mass function, we know that a M4.5V dwarf with a sub-M4.5V dwarf companion (M < 0.188 M⊙) needs to have an inclination i > 50° to create the observed radial velocity amplitude. However, for short-period double M dwarf binaries with such inclinations, strong photometric variability due to ellipsoidal variations from the (close to) Roche–Lobe-filling M dwarfs is expected and observed91. We expect the M dwarf to be close to Roche–Lobe filling for white dwarf masses MWD > 0.25 M⊙ (Extended Data Fig. 8).
In addition to periodic variability, we test for stochastic variability, following the methods outlined in section 3.2 of ref. 93. We compare the distribution of the number of standard deviations from the mean of the photometric measurements with the maximum expected standard deviation given the number of observations and assume that the measurements follow a Gaussian distribution for a non-variable star. For the green band (36 observations), we find that a maximum deviation of 2.55σ should capture all measurements. There is only one measurement outside this threshold, corresponding to 2.8% of the measurements. In an attempt to consider systematics, we impose a variability threshold of 10% of the measurements being above the expected threshold, that is, we assume that up to 10% of measurements can be adversely affected by systematics. For the other bands, the number of measurements outside the expected threshold is even lower (0.6% for 327 zr measurements and 2.3% for 88 zi measurements). We conclude that there is no indication of stochastic variability.
White dwarf spin-down luminosity
Spin-down luminosity is defined as the maximum luminosity that can be derived from the rotation of a magnetized white dwarf or neutron star. We consider whether the radio emission from ILT J1101 + 5521 can be powered by the spin-down of the white dwarf. Assuming that the spin period of the white dwarf has synchronized to the orbital period of the binary (as is the case for polars), we calculate the spin-down luminosity of a pulsar using ({L}_{text{spin-down}}=frac{4{uppi }^{2}Idot{P}}{{P}^{3}}), where P = 7,531.8 s and (dot{P}le 1.7times 1{0}^{-11}). We note that this calculation holds only for a dipolar magnetic field, which is often assumed in the absence of other information14. However, individual case studies have shown that the magnetic field topologies of white dwarfs can be highly non-dipolar (see, for example, ref. 94), which will affect the spin-down luminosity. Assuming I ≈ 1050 g cm2 for a typical white dwarf, we find that Lspin-down < 1.6 × 1029 erg s−1. The peak radio luminosity (256 mJy at 144 MHz) is ({L}_{nu,{mathrm{rad}}}=7.8times 1{0}^{19}{left[scriptstylefrac{d}{504,{rm{pc}}}right]}^{2},{rm{erg}},{{rm{s}}}^{-1},{{rm{Hz}}}^{-1}). Integrating over the LOFAR bandwidth of 48 MHz and assuming a flat spectrum over this bandwidth, we find ({L}_{{mathrm{rad}}}=3.7times 1{0}^{27}{left[frac{d}{504,{rm{pc}}}right]}^{2},{rm{erg}},{{rm{s}}}^{-1}). This implies that, for a radio efficiency of ξ ≈ 10−2, the spin-down luminosity could power the observed radio emission. For neutron stars, radio efficiencies up to 10−2 have been observed95, but typical radio efficiencies for pulsars are much lower (<10−2). We cannot confidently exclude a white dwarf spin-down origin for the radio emission, but extremely high radio efficiencies are required, making this an unlikely scenario.
Chromospheric activity from the M dwarf
We use the X-ray observations to investigate whether the M dwarf is chromospherically active. Usually, the X-ray luminosity of chromospherically active M dwarfs in the range of 0.2–2 keV varies between 2 × 1026 and 3.6 × 1029 erg s−1 (see supplementary material in ref. 13). For ILT J1101 + 5521, assuming a soft X-ray upper limit of ~1 × 10⁻¹⁴ erg cm−2 s−1 and a distance of 504 pc, this translates to L < 3 × 1029 erg s−1. Based on the X-ray limits, we cannot exclude chromospheric activity. Another indicator for chromospheric activity is the chromospheric emission lines Hα and Ca II, which are the result of magnetic heating of the stellar atmosphere. The spectra obtained in this work show a clear Hα emission line (Extended Data Fig. 4). This emission line follows the same radial velocity pattern as the M dwarf; thus, the Hα line originates from the M dwarf. Following ref. 96, we estimate the equivalent width (EW) of the Hα emission line in the HET LRS2-R spectrum, as the signal-to-noise ratio and spectral resolution are higher than for the combined MMT spectrum. We find the EW of Hα to be −9.1, clearly indicating strong chromospheric activity when compared with the sample of ref. 96 (see their fig. 2).
Radio emission from the M dwarf
Coherent radio emission from stellar systems can be produced by two mechanisms: plasma emission that occurs at the ambient plasma frequency and its harmonics, and cyclotron emission that occurs at the ambient cyclotron frequency and its harmonics97. Both plasma and cyclotron emission are expected to be highly circularly polarized98.
We therefore conclude that ILT J1101 + 5521 cannot originate from the M dwarf, as the circular polarization fraction of the radio pulses is less than a few per cent at most. In ref. 13, it was found that even the weakest circularly polarized M dwarf still showed a circular polarization fraction of 38%. Furthermore, the brightest radio luminosity (assuming the distance to the star to be 504 pc) is roughly L = 7.8 × 10¹⁹ erg s−1 Hz−1, which is five orders of magnitude brighter than the population of M dwarfs that has been observed at low radio frequencies13. Stellar flares with moderate linear polarization fractions have been observed12,99,100, but these sources were always highly circularly polarized as well. We do not know of any physical mechanism by which the M dwarf could produce the observed radio emission. Therefore, this radio emission must originate from the interaction between the companion and the M dwarf.
Chromospherically active binaries
Close stellar binaries, such as RS Canum Venaticorum (RS CVn) variables, are the most luminous stellar radio systems and show heightened levels of chromospheric activities. The typical X-ray luminosity of chromospherically active binaries is >1030 erg s−1 (refs. 101,102,103). However, RS CVn systems with X-ray luminosities as low as 1029 erg s−1 have also been found102. For ILT J1101 + 5521, the X-ray limit is (L < (1{hbox{-}}1.6)times 1{0}^{30}times {left[frac{d}{504,{rm{pc}}}right]}^{2},{rm{erg}},{{rm{s}}}^{-1}). A stronger argument against a RS CVn origin for ILT J1101 + 5521 is the relation between the X-ray and radio luminosity of such systems, the Güdel–Benz relation ({L}_{{mathrm{X}}}=9.48times 1{0}^{18}{L}_{nu,rad}^{0.73}) (ref. 104). For the radio luminosities of the detected pulses (({L}_{nu,{mathrm{rad}}}=1.4{hbox{-}}7.8times 1{0}^{19}{left[scriptstylefrac{d}{504,{rm{pc}}}right]}^{2},{rm{erg}},{{rm{s}}}^{-1},{{rm{Hz}}}^{-1})), this implies X-ray luminosities of LX = 0.9–3.2 × 1033 erg s−1, which is three orders of magnitude above our X-ray upper limit. Deviations from the Güdel–Benz relation have been observed102, but no systems with over an order-of-magnitude discrepancy between X-ray and radio luminosities have been found. Moreover, the radio emission from RS CVn systems is thought to be produced by the ECMI, which is expected to yield a circularly polarized radio signature98,101. Finally, the RV signature and optical photometry imply a mass that is consistent with a compact object—not with a similar mass object. Therefore, we conclude that ILT J1101 + 5521 is not a close chromospherically active stellar binary.
Comparison with AR Scorpii, J1912–4410 and other long-period transients
A detailed comparison of ILT J1101 + 5521 with AR Scorpii15, J1912–4410 (ref. 16) and other long-period transient radio sources35,36,37,38 is provided in the Supplementary Information.

Responses