Strong-weak dual interface engineered electrocatalyst for large current density hydrogen evolution reaction
Introduction
Supported nanocatalysts (SNCs) are a class of catalysts which feature active components uniformly distributed across the surface of a support material1. They afford the advantages of reducing the quantity of active components needed while increasing the catalyst’s surface area2. Additionally, they exhibit superior catalytic performance, including high mass activity and ensuring stability3,4. These attributes have facilitated their broad applications in catalytic processes within materials science and chemical engineering disciplines5. In recent years, research in this area has primarily focused on the development of new synthetic technologies and the study of their underlying mechanisms6,7,8. From the perspective of the active components, taking Pt nanocatalysts as an example, their catalytic performance can be enhanced through various strategies, including composition regulation9, alloying10,11, controllable morphology synthesis12,13,14, crystal plane regulation15, and surface modification16,17,18. Most research efforts have been concentrated on these aspects. However, research on support has been relatively limited, primarily focusing on the exploration of different supports, such as carbon materials19,20, zeolites21, Al2O322, SiO223,24, CeO225,26, etc27.
The metal-support interaction (MSI) at the interface of SNCs plays a crucial role in chemical reactions, directly affecting both catalytic activity and stability28,29,30. Studies have demonstrated that tailoring the surface properties of the support31,32, for instance, by forming Mott-Schottky heterojunctions between the active components and supports, can significantly modulate interfacial interactions, thereby enhancing catalytic performance33. Nonetheless, studies in this field remain scare, and there is a lack of understanding of the fundamental mechanisms between MSI and catalytic activity. It is widely known that the interface between actives metal and supports can be classified into a strong interface and a weak interface based on the strength of interfacial interaction forces34. Using the hydrogen evolution reaction (HER) as an example, SNCs with strong interface can constrain the migration and growth of metal nanoparticles on the surface of the support. However, Hads is difficult to transfer and desorb, resulting in low catalytic activity35. On the other hand, SNCs with weak interface exhibit properties that are closer to the active component itself. However, Hads is easily to desorbed and the active component is prone to migration and aggregation, which can also affect its catalytic performance36. Currently, most SNCs are based on homogeneous materials as supports, resulting in constant interfacial interaction forces, either strong or weak. It remains challenging to optimize catalytic performance by regulating and balancing the catalytic reaction process through MSI control.
In SNCs, constructing a strong-weak dual interface theoretically combines the advantages of both, enhancing the activity and stability of catalysts. For example, Liu et al.37 reported a strategy employing the dealuminated beta zeolite with abundant silanol nests as a support. The strong interfacial bonding between silanols and Cu atoms captures migrating active components during the catalytic process, preventing the sintering and growth of Cu nanoparticles and maintaining high conversion rates and selectivity for the hydrogenation of dimethyl oxalate over time. Ideally, selecting heterogeneous materials with distinct compositions or structures as supports and uniformly anchoring the active components on their surfaces before the catalytic reaction could suppress Ostwald ripening and synergistically promote the Tafel step (or Heydrovsky step) in HER38. This approach could lead to the development of SNCs with excellent catalytic activity and stability.
Herein, we designed a high-efficiency Pt@ anatase&rutile TiO2 (Pt@A&R-TiO2) catalyst with a strong-weak dual interface by utilizing a heterogeneous support composed of anatase and rutile TiO2 phases (Fig. 1a). In HER, Pt@ anatase TiO2 (Pt@A) with strong interface can rapidly adsorb hydrogen atoms onto its surface to form Pt-H, accelerating the Volmer reaction step. Meanwhile, the strongly bound Hads on the Pt@A-TiO2 surface is more likely to capture Hads on the Pt@ rutile TiO2 (Pt@R) surface with weak interface and H2O molecules in the electrolyte, accelerating the Tafel and Heydrovsky steps to produce H2. This design significantly enhances the HER catalytic activity, with a mass activity that is 8.8 times higher than that of commercial Pt/C. Additionally, the migration, agglomeration, and Ostwald ripening of the active component Pt atoms during the catalytic reaction process are effectively inhibited, resulting in Pt@A&R-TiO2 with good stability. The attenuation degree is just 0.69 times that of commercial Pt/C. This strong-weak dual interface strategy enables the SNCs to possess both high activity and strong stability, promising to provide a new pathway for the development of better high-performance metal nanocatalysts.
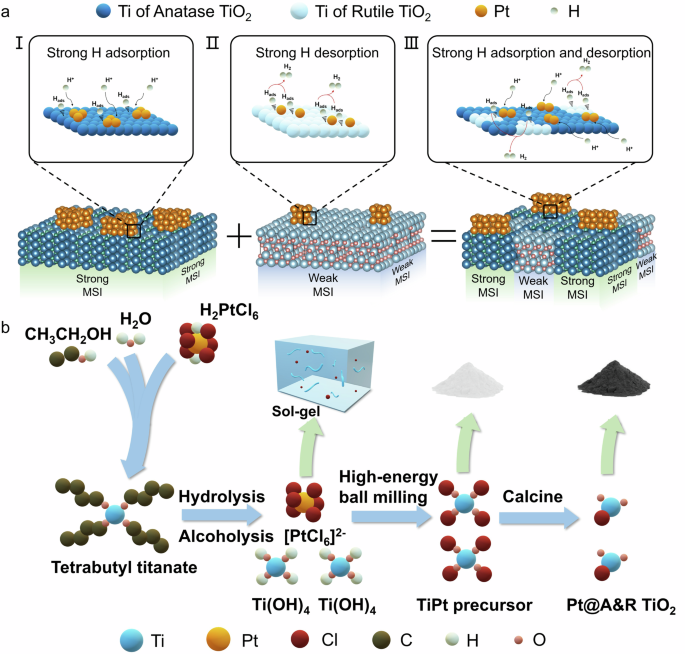
a Schematic diagram of strong-weak interface mechanism. (Inset: (I) Strong H adsorption under strong metal support interactions, (II) Strong H desorption under weak metal support interactions, (III) Strong H adsorption and desorption under strong-weak metal support interactions.) (Dark blue represents Ti in anatase, light blue represents Ti in rutile, orange represents Pt, light green represents H.) b Schematic diagram of the synthesis process of the Pt@ A&R-TiO2. (Blue represents Ti, orange represents Pt, dark red represents Cl, dark brown represents C, lake green represents H, dark pink represents O.).
Results and discussion
Using the above design principles as theoretical support, herein, we chose TiO2 as the support and chloroplatinic acid (H2PtCl6·6H2O) as the precursor solution. The experiment procedure is illustrated in Fig. 1b. We used the sol-gel method to prepare TiO2, selecting tetrabutyl titanate as the titanium source. Firstly, the precursor solution of TiO2 was prepared, and H2PtCl6·6H2O was added to it under acidic conditions. Secondly, the mixture, along with milling balls, was then subjected to high-energy ball milling. Finally, the powder obtained through centrifugation and drying was calcined in an Ar-protected tube furnace to realize in-situ reduction of platinum ions and the generation of TiO2. This process yielded the Pt@A&R-TiO2, featuring both strong (Pt@A)-weak (Pt@R) and demonstrated outstanding catalytic activity and long-term stability for HER. The activation energy of the reaction was calculated, and the anticipated impact of different component supports on catalytic performance were predicted before the experiment (Supplementary Fig. 1).
To fully understand the process that occurred in the reaction, we carefully studied the fourier transform infrared spectrometer (FTIR) of three samples: milling-calcined, unmilling-uncalcined and milling-uncalcined (Fig. 2a). The stretching vibration band at around 3450 cm−1 was ascribed to isolated surface hydroxyl groups (Ti(IV)-OH), presumably due to the hydrophilicity of the generated TiO239. The necessity of calcination for TiO2 formation was further confirmed (Supplementary Fig. 2). The band at 550 cm−1 was assigned to Ti-O40, and the observed red shift indicates variations in the local environment. The presence of Ti-O confirms that the C-O bond is broken during ball milling process (Supplementary Eq. 1). The band around 1620 cm−1 was ascribed to H2O, and the band around 1030 cm−1 was assigned to C-O. A remarkable difference was observed between calcined and uncalcined samples. Due to the presence of uncalcined, alcohol, alkane and halogen presented in the sample (Alcohol phenols (stretching) in the yellow area (~3200 cm−1), C-H alkyl (stretching) in the blackish green area (~2950 cm−1) and C-Cl in the orange area (600–800 cm−1)). This indicates that calcination can effectively remove organic compounds. Besides, the ball milling process does not affect hydrolysis and alcoholysis of titanium sources.
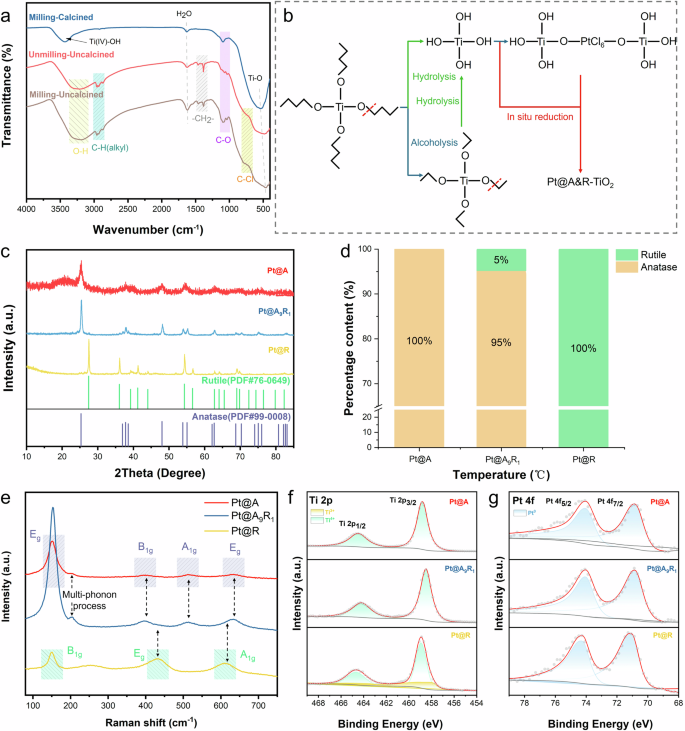
a FTIR spectra obtained from milling-calcined, unmilling-uncalcined and milling-uncalcined. b The process of the reaction. c XRD patterns of Pt@ A&R-TiO2. d Percentage of anatase TiO2 and rutile TiO2 in Pt@ A&R-TiO2. e Raman spectra of Pt@ A&R-TiO2. f XPS spectra of Ti 2p in Pt@ A&R-TiO2. g XPS spectra of Pt 4 f in Pt@ A&R-TiO2.
Additionally, the presence of Pt at around 2080 cm−1 is not observed in the FTIR spectra, possibly due to its low content. The FTIR spectra provided insights into the formation of Pt@A&R-TiO2 (Fig. 2b). The addition of H2PtCl6·6H2O to the TiO2 precursor solution results in a sol-gel containing Ti(OH)4 and long chain, formed through hydrolysis and alcoholysis reaction. Under acidic conditions, tetrabutyl titanate preferentially breaks the C-O bond shown in Supplementary Eq. 1, as the oxygen of the alcohol hydroxyl group is more reactive due to protonation of O and the positive charge on carbon under the acidic conditions. High-energy ball milling provides significant energy to break these long chain and bond [PtCl6]2−, rather than loading Pt41. X-ray photoelectron spectroscopy (XPS) analysis of the uncalcined samples (Supplementary Fig. 3) revealed that Pt exhibited a valence of +2, indicating that [PtCl6]2+ does indeed bond with O in Ti-O, otherwise Pt will exhibit a valence of +4. We believe that the nanocatalysts prepared by high-energy ball milling will exhibit improved catalytic stability, as Pt bonds with the support rather than simply being loaded onto it. During calcination, anatase TiO2 and rutile TiO2 were obtained by controlling the temperature, with high-energy ball milling achieving similar performance at lower temperatures compared to unmilling samples.
We manipulated various preparation conditions to synthesize a range of Pt@A&R-TiO2 samples (Supplementary Fig. 4). X-ray diffraction (XRD) analyses confirmed the presence of both single and multiphase supports in the system, as indicated by the pattern matching JCPDS file NO: 99-0008 and NO: 76-0649 (Fig. 2c). The samples were named according to phase composition. Supports containing only anatase are named Pt@A, those containing only rutile are named Pt@R, and those containing both anatase and rutile are named Pt@A9R1 based on their phase composition. The XRD exhibits exclusively TiO2 reflections, suggesting that Pt particles are too small and evenly dispersed to be detected by XRD. Figure 2d exhibits the phase composition ratio of TiO2 in Pt@A&R-TiO2.
To further elucidate the phase structure and intermolecular interactions, Raman was performed. Similar to XRD, Raman spectra also exhibit the same phase structure. The transition from anatase to rutile TiO2 was further explained. As can be observed in Fig. 2e, the Raman spectra showed distinct vibrational bands characteristic of the crystalline phases42, which were influenced by varying temperatures and ball milling times. Pt@A showed a dominant vibrational peak at 150 cm−1 and three weak peaks at 395, 515, and 635 cm−1, corresponding to Eg, B1g, A1g, and Eg Raman active modes of anatase TiO2, respectively43. In addition, another characteristic broad compound vibrational peak at 200 cm−1 aroused from the multi-phonon process scattering was also observed44. On the other hand, Pt@R exhibited three bands at 150, 432, and 610 cm−1 that were associated to B1g, Eg, and A1g Raman active modes of rutile TiO243. The spectra of Pt@A9R1 displayed vibrational bands from both anatase TiO2 and rutile TiO2, further confirming the accuracy of XRD. Pt@A9R1 presented significant vibration in the active modes of anatase TiO2, along with an increase intensity of the main anatase TiO2 peak (~153 cm−1), aligning with its phase composition content. Combining with Supplementary Fig. 5, it can be concluded that high-energy ball milling can lower the transition temperature of anatase TiO2 to rutile TiO2 (700 °C), which is below the typical phase transition temperature45,46.
The surface chemical composition of Pt@A&R-TiO2 were determined and analyzed by XPS (Fig. 2f, g), confirming the presence of metallic Pt. Minor deviations in the Ti and Pt peaks were attributed to the distinct crystal structures, with no directional differences observed. The deconvolution of the Ti high-resolution scan led to 2 peaks ascribed to Ti 2p3/2 and Ti 2p1/2, respectively, indicating the presence of Ti4+ in all samples. Among them, Pt@R showed two additional peaks at 457.98 eV and 463.57 eV, indicating the generation of Ti3+ during the in-situ coreduction process, implying a small amount of Ti3+ in the system. This could enhance the shielding effect and lower the binding energy38, potentially leading strong metal-support interactions (SMSI). It can also be observed that the Ti4+ in Pt@A9R1 shows a shift toward lower energy levels compared to Pt@A and Pt@R, which can be attributed to the different energies applied during high-energy ball milling. This shift indicates electron transfer around Ti, resulting in increased electron cloud density and stronger Ti–O bonding47. The O 1s XPS spectra (Supplementary Fig. 6) reveal three contributions attributed to different chemical states of oxygen, which are lattice oxygen (OL) in the TiO2 structure, oxygen vacancies (OV) in the oxygen-deficient regions, and chemically adsorbed oxygen (OC) on the surface of TiO248. The increased content of OV and OC in Pt@R further confirms the formation of TiO2-x. Supplementary Fig. 7 demonstrates that in the Pt@R sample, Pt NPs are encapsulated by TiO2-x, providing additional evidence for the SMSI effect. Furthermore, the Ti-to-O ratio derived from XPS analysis (Supplementary Table 1) confirms the presence of suboxides in Pt@R. In contrast, the absence of TiO2-x in other samples is attributed to an insufficient reduction temperature, which likely inhibits suboxide formation. The Pt high-resolution spectra also confirmed the existence of Pt0, with peaks observed at ~70.9 eV and ~74.3 eV49. The binding energies observed at 72.61 eV and 75.81 eV in the uncalcined sample belong to Pt2+ 50 (Supplementary Fig. 3), further confirming that calcination reduces Pt2+ to Pt0. The binding energy of Pt0 in Pt@A&R-TiO2 is lower than that of Pt0 in Platinum table (Binding energy Pt4f7/2 is 71.2 eV), which is consistent with SMSI in the system.
After high-energy ball milling and in-situ co-reduction, TiO2 exhibits a spherical shape (Supplementary Fig. 8). In transmission electron microscope (TEM) images (Fig. 3a, d, g), the Pt@ A&R-TiO2 structure with a unique morphology can be clearly seen. Both anatase TiO2 and rutile TiO2 are coexist in Pt@A9R1 (Fig. 3d). High Resolution Transmission Electron Microscope (HRTEM) analysis confirmed the successful reduction of H2PtCl6 to Pt, corroborating XPS Pt 4f results (Fig. 3b, e, h). All Pt NPs have diameters ranging from 2.32 nm to 3.02 nm (Supplementary Fig. 9a–c). Because of the small particle size of Pt@ A&R-TiO2, Ostwald ripening plays an important role51, minor variations of Pt NPs size can affect catalytic performance. Here, a series of catalysts with varying particles sizes were prepared and it was found that the catalysts with a moderate sized (~2.3 nm) and uniformly distributed (±0.01 nm) Pt NPs exhibit superior HER performance (Supplementary Figs. 9 and 10). Selected area electron diffraction (SAED) was texted to further proof that Pt@ A&R-TiO2 exhibits a polycrystal state (Fig. 3c, f, i). Following Fourier transformation, the distances of the crystal lattice in Pt@A (Fig. 3c) are 0.350 nm (2.86 1/nm), 0.243 nm (4.12 1/nm), 0.167 nm (5.99 1/nm), and 0.136 nm (7.35 1/nm), matching {101} {103}{211}and {116} of anatase TiO2. The crystal lattice in Pt@R (Fig. 3f) with distance of 0.249 nm (4.02 1/nm), 0.205 nm (4.88 1/nm), 0.130 nm (7.69 1/nm), and 0.108 nm (9.26 1/nm) are correspond to {101}{210}{311} and {222} of rutile TiO2. At the same time, Pt@A9R1 exhibits the crystal lattice of both anatase TiO2 and rutile TiO2 (Fig. 3i). Discrepancies between XRD peak characteristics and SAED analysis may arise from different sample incident points; however, both analyses confirm the presence of both phases in the sample.

The TEM image (a), HRTEM image (b), and SAED image (c) of Pt@A. The TEM image (d), HRTEM image (e), and SAED image (f) of Pt@A9R1. The TEM image (g), HRTEM image (h), and SAED image (i) of Pt@R.
We investigated the catalytic performance of Pt@A&R-TiO2 through electrochemical testing, focusing on their HER performance in 0.5 M H2SO4 solution. Each catalyst was pre-treated in Nafion solution and prepared as an electrolyte. Pt@A9R1, prepared with an addition of 5 mmol/L chloroplatinic acid, exhibited the highest catalytic activity (Supplementary Fig. 10 and Supplementary Table 2), with a relative overpotential of 105 mV at a current density of 100 mA cm−2 versus the reversible hydrogen electrode (RHE) (Fig. 4a). This demonstrates that multiphase supports enhance catalytic performance, with strong-weak dual interface favoring HER. The simultaneous presence of strong and weak interfaces is beneficial for accelerating Volmer steps and Tafel steps, increasing the rate determination step. Besides, the Tafel slope for Pt@A&R-TiO2 was approximately 30 mV dec−1 (Fig. 4b), indicating that the reactions follow a Volmer-Tafel mechanism, with the Tafel step being rate determination step. The Tafel slope of Pt@R (21.7 mV dec−1) is lower than that of Pt@A (26.8 mV dec−1), suggesting that the weak interface is more advantageous for the Tafel step. Further detailed analysis revealed that HER is controlled by the diffusion rate of hydrogen ions. The Tafel slope of other Pt@A&R-TiO2 samples are shown in Supplementary Fig. 11. Phase changes in the support do not alter the reaction mechanism. The electrochemical active surface area was measured to compare active site densities across different phases. Multiphase catalysts exhibited a larger double layer capacitance (Cdl) compared to single-phase catalysts (Supplementary Fig. 12). This indicates that the active site of the multiphase catalyst has a larger contact area with the electrolyte, is conducive to improvement the utilization efficiency of Pt. Electrochemical impedance spectroscopy (EIS) was used to probe the charge transfer rate during the Volmer step and to obtain more precise electrode kinetics measurements. The simplified Randle circuit was modeled using software to accurately calculate the charge transfer resistance (Supplementary Table 2), where Rs is the solution resistance, CPE represents the constant phase element, and Rct is known as charge transfer resistance. Impedance data for Pt@A&R-TiO2 were collected at fixed potentials with a 5 mV interval step. Pt@A9R1 showed the lowest Rct (3.31 Ω) (Fig. 4c), indicating the electrode has the fastest charge and the active substance has a small contact resistance and interface resistance with the support, mainly due to the well hydrophilicity of the multiphase under this phase ratio. Notably, the Rct of Pt@A (7.711 Ω) is lower than that of Pt@R (17.35 Ω), further confirming that strong interface is more benefit for the Volmer step. Addition EIS data for Pt@A&R-TiO2 are exhibited in Supplementary Fig. 13. In addition, the mass activity analysis of the Pt@A&R-TiO2 showed that at a potential of 50 mV, Pt@A, Pt@A9R1, Pt@R and commercial Pt/C had mass activities of 2.23 A mg−1, 5.04 A mg−1, 1.24 A mg−1, and 0.57 A mg−1, respectively (Fig. 4d). The acquisition of mass activity is derived from the Inductively Coupled Plasma Optical Emission Spectrometer (ICP-OES) test results for Pt (Supplementary Table 3). Based on the above tests, the relevant performance of Pt@A&R-TiO2 and commercial Pt/C is summarized in Fig. 4e. Among them, Pt@A9R1 exhibited high catalytic activity due to the existence of the strong-weak dual interface. To further validate our findings, we also synthesized catalysts using commercially available anatase and rutile under identical proportions, as depicted in Supplementary Fig. 14. This comparison underscores the enhanced performance of catalysts with dual interface generated in-situ, as opposed to those obtained through conventional mixing methods. Moreover, the electrochemical stability of Pt@A9R1 and commercial Pt/C was evaluated over 1000 cycles of cyclic voltammetry (CV) (Supplementary Fig. 15). The attenuation of Pt@A9R1 ((Delta)19 mV at 50 mA cm−2, (,Delta)25 mV at 100 mA cm−2) was slightly less than that of commercial Pt/C ((Delta)19 mV at 50 mA cm−2, (Delta)36 mV at 100 mA cm−2). To further evaluate stability, a stability test was performed in Fig. 4f after 2000 CV cycles. At the current density of 100 mA cm−2, Pt@A9R1 exhibited superior stability, with a potential decay of ∆45.14 mV compared to ∆53.92 mV for commercial Pt/C. These results confirm that Pt@A9R1 demonstrates enhanced performance under high current conditions relative to commercial Pt/C. Post-cycling TEM analysis reinforces these observations, as shown in Supplementary Fig. 16. After the stability test, Pt@A9R1 exhibits more uniform particle distribution compared to commercial Pt/C, with no significant aggregation or growth of Pt particles (Supplementary Fig. 9), which explains its good HER performance after the stability test. Furthermore, the anatase and rutile phases remain intact, validating the stability of the strong-weak dual interface. The long-term electrochemical testing indicates that multiphase catalysts containing dual interface exhibit good electrochemical stability, attributed to the varied interaction forces between Pt-anatase TiO2 and Pt-rutile TiO2. The sample without ball milling showed greater attenuation ((Delta)58 mV at 50 mA cm−2) after 1000 CV cycles (Supplementary Fig. 17), further supporting the bonding effect of ball milling. To investigate the application of the catalyst under industrial conditions, the overpotentials of Pt@A9R1 and commercial Pt/C at high currents were tested (Fig. 4g). The results showed that Pt@A9R1 exhibited overpotentials of 291.3 mV and 529.3 mV at current densities of 500 mA cm−2 and 1000 mA cm−2, respectively, which are comparable to the commercial Pt/C (with overpotentials of 410.2 mV and 764.1 mV at the same current densities), indicating similar catalytic performance at high currents. Pt@A9R1 was also benchmarked against other recent HER catalysts, showing superior overpotential (10 mA cm−2 and 100 mA cm−2) and Tafel slope performance (Fig. 4h, Supplementary Fig. 18, and Supplementary Table 4).
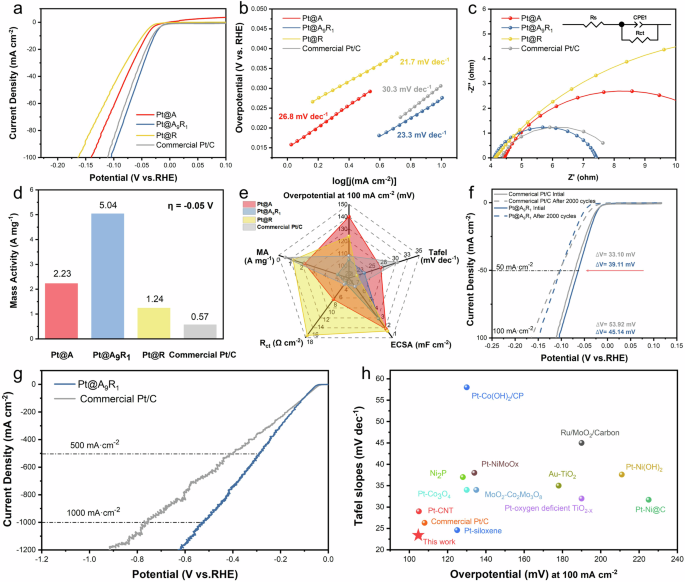
a Polarization curves of various Pt@ A&R-TiO2 samples and commercial Pt/C at a scan rate of 10 mV s−1. b Tafel slopes obtained from the polarization curves in (a). c EIS data. (Inset: Equivalent circuit model for fitting EIS data.) d Comparison of mass activity between Pt@ A&R-TiO2 and commercial Pt/C. e Performance radar chart of Pt@ A&R-TiO2 and commercial Pt/C. f Polarization curves for Pt@A9R1 and commercial Pt/C before and after 2000 CV cycles. g Polarization curve of Pt@A9R1 and commercial Pt/C under high current. h Comparison with recently reported HER catalysts in 0.5 M H2SO4.
Combined with first-principles density functional theory (DFT) calculations, we discuss the excellent electrocatalytic activity of Pt@A&R-TiO2 in the HER and verify our hypothesis. The corresponding theoretical models of Pt@A, Pt@A&R-TiO2 and Pt@R are depicted in Supplementary Fig. 19. Fig. 5a–c depicts the charge density distributions of these systems, with charge accumulation regions in green and charge depletion regions in yellow, using an isosurface level of ±0.004 e bohr−3. Pt@A&R-TiO2 exhibited the highest charge density at the interface. Such a massive electron distribution can optimize the adsorption/desorption of intermediates, and facilitate the adsorption of H2O molecules, significantly speeding up the entire HER process52. Binding energy calculations further revealed the nature of strong and weak interfaces (Fig. 5d). The results demonstrated that Pt@A&R-TiO2 exhibits the maximum binding energy value (107.53 eV) compared to Pt@A (88.79 eV) and Pt@R (84.29 eV). This suggests a strong interface interaction between Pt and anatase TiO2, and a weak interface interaction between Pt and rutile TiO2, further indicating the strong-weak dual interface between Pt and multiphase TiO2. DFT calculations also determined the Gibbs free energy (ΔGH*) for hydrogen adsorption on the catalyst surfaces (Fig. 5e), with Pt@A&R-TiO2 showing a more favorable ΔGH* (−0.34 eV) compared to Pt@A (−0.49 eV) and Pt@R (−0.59 eV), suggesting its potential as a promising HER electrocatalyst. Meanwhile, the lower ΔGH* indicates a stronger Hads adsorption capacity53,54. Thus, the strong interface of Pt@A shows better Hads adsorption than the weak interface of Pt@R, which is consistent with the speculation. The computed electron density of states (DOS) plots for Pt@A&R-TiO2 are shown in Fig. 5f. The Pt@A&R-TiO2 show metallic characteristics, due to the split wave of DOS crossing the Fermi level. The valence band (VB) is mainly filled by O p states and Pt d states, while the conduction band (CB) is mainly filled by Ti d states. Notably, a pronounced orbital overlap is observed between these states, with the grey energy regions showing overlapping peaks among Ti d, O p, and Pt d, suggesting that Pt is bond with Ti and O. These findings highlight the role of high-energy ball milling in facilitating the bond between Pt and TiO2, as confirmed by FTIR results, which indicate strong catalyst stability, further supported by the stability testing results of the catalyst. Moreover, as shown in Fig. 5g, d-band center of Pt in Pt@A&R-TiO2 (−2.302 eV) was higher than that of Pt@A (−2.704 eV) and Pt@R (−3.346 eV), demonstrating hydrogen atoms were easy to adsorb on its active sites.

Calculated charge density distribution for (a) Pt@A, (b) Pt@A&R-TiO2 and (c) Pt@R. d Binding energy of Pt@A, Pt@A&R-TiO2, and Pt@R. e HER free-energy diagram calculated for Pt@A, Pt@A&R-TiO2, and Pt@R. f Calculated densities of states of Pt@A&R-TiO2. g d-band center of Pt@A, Pt@A&R-TiO2, and Pt@R.
As demonstrated by the above experiments, Pt@A9R1, with its unique strong-weak dual interface, exhibits outstanding performance in HER. To assess the practical application potential of Pt@A9R1, overall water splitting (OWS) measurements using a symmetrical electrode system were employed. In these experiments, Pt@A9R1 served as the cathode catalysts while IrO2 acted as the anode catalysts, and this setup was referred to as Pt@A9R1 || IrO2. Polarization curve tests were performed, with commercial Pt/C || IrO2 also tested for comparison. The results are depicted in Fig. 6a (for reference, Supplementary Fig. 20 shows the polarization curve with RuO2 as the anode catalysts). Remarkably, the Pt@A9R1 || IrO2 system reached a current density of 10 mA cm−2 at 1.569 V, matching the performance of commercial Pt/C || IrO2 and surpassing most recently reported catalysts (Fig. 6b and Supplementary Table 5). At a higher current density of 150 mA cm−2, the Pt@A9R1 || IrO2 system required a slightly lower potential (1.943 V) than the commercial Pt/C || IrO2 (1.948 V). More details are provided in Fig. 6c.
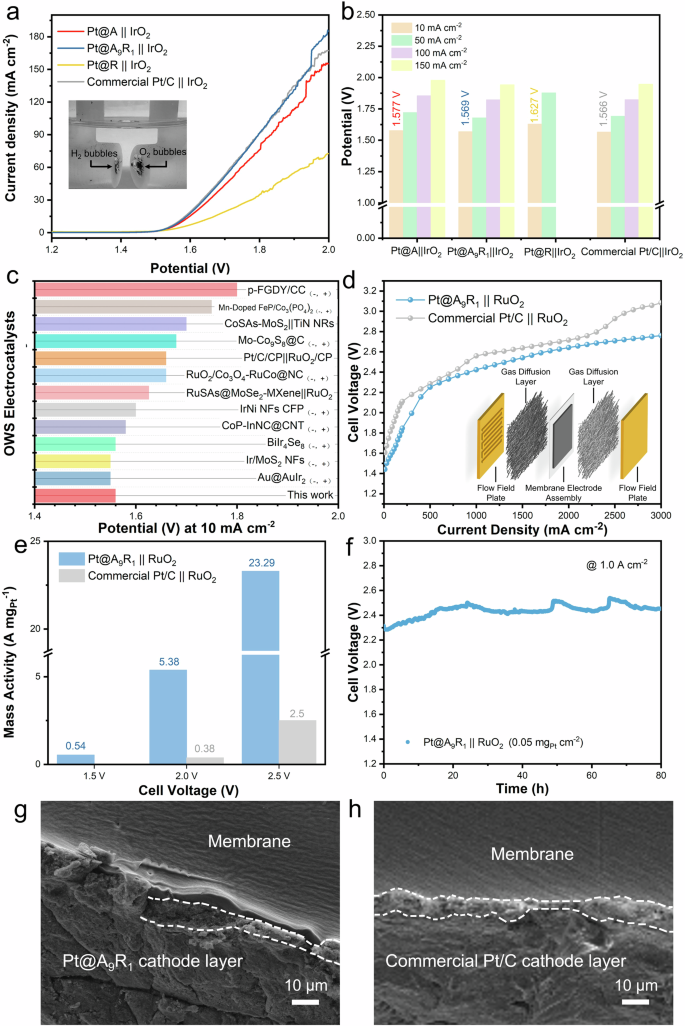
a OWS measurements with a symmetrical electrode system in 0.5 M H2SO4. (Inset: The digital image of a symmetrical electrode system, where the left side features the cathode catalyst releasing H2, and the right side features the anode catalyst releasing O2). b Potential of Pt@A&R-TiO2 || IrO2 and commercial Pt/C || IrO2 at different current densities. c Comparison of the OWS performance of the Pt@A9R1 || IrO2 at 10 mA cm–2 with recent reports. d Polarization curve of Pt@A9R1 || RuO2 and Pt/C || RuO2 in PEMWE. (Inset: Schematic diagram of a PEM electrolyzer). e Comparison of mass activity between Pt@A9R1 || RuO2 and Pt/C || RuO2 in PEMWE. f Chronopotentiometry curves at current density of 1.0 A cm−2 in PEMWE. g, h SEM images of the Pt@A9R1 || RuO2 and Pt/C || RuO2 cathode layers after stability tests.
Due to the high catalytic and excellent durability of Pt@A9R1 demonstrated in HER and OWS, we have integrated Pt@A9R1 into an electrolyzer. As depicted in Fig. 6d, the water electrolyzer, assembled using Pt@A9R1 and RuO2 as the respective cathode and anode (Supplementary Fig. 21) (named Pt@A9R1 || RuO2) only requires an input voltage of 1.44 V to drive a current density of 10.0 mA cm−2 for Pt@A9R1 || RuO2 (0.05 mgPt cm−2) without iR compensation. This value is lower than that of Pt/C || RuO2 (1.6 mgPt cm−2) which requires 1.61 V. Concurrently, within a current density of 3 A cm−2, Pt@A9R1 || RuO2 exhibits superior overall water splitting performance compared to Pt/C || RuO2. At current densities of 1 A cm−2, 2 A cm−2, and 3 A cm−2, Pt@A9R1 || RuO2 shows lower voltages of 2.42 V, 2.64 V, and 2.76 V, respectively, compared to Pt/C || RuO2 which shows 2.56 V at 1 A cm−2, 2.71 V at 2 A cm−2, and 3.08 V at 3 A cm−2.To further elucidate the enhanced activity of Pt@A9R1 || RuO2, overpotential analysis was applied to differentiate between kinetic (({{{{rm{eta }}}}}_{{{{rm{kin}}}}})), ohmic(({{{{rm{eta }}}}}_{Omega })) and mass transport potential loss (({{{{rm{eta }}}}}_{{{{rm{mt}}}}})) (Supplementary Fig. 22). The results indicate a significant mass transport potential, possibly due to the assembly of the proton exchange membrane water electrolyzers (PEMWEs)55. Moreover, Pt@A9R1 || RuO2 displayed one order of magnitude higher mass activity than that of Pt/C || RuO2 across a wide cell voltage (Fig. 6e). The long-term durability of Pt@A9R1 || RuO2, as shown at a high current density of 1 A cm−2, exhibits minimal change in the input voltage (Fig. 6f), and after 100 h of testing at high current density, the input voltage shows a 9.15% degradation (Supplementary Fig. 23). Subsequently, the cathode flatness of Pt@A9R1 || RuO2 after 100 h of stability testing was compared with that of Pt/C || RuO2 after 60 h of stability testing (Supplementary Fig. 24). SEM results indicated that after 100 h, the cathode side of Pt@A9R1 || RuO2 was even flatter than the cathode side of Pt/C || RuO2 after 60 h (Supplementary Figs. 25 and 26), with the discontinuous areas being due to the shearing forces caused during the preparation of the SEM samples (Fig. 6g, h). The cathode side of Pt/C || RuO2 became rough after only 60 h, which was due to structural degradation during the stability testing. This result is consistent with the three-electrode system and the two-electron system for OWS, further confirming the excellent stability of Pt@A9R1.
Conclusions
In summary, we have designed a strong-weak dual interface electrocatalyst using high-energy ball milling. Our results demonstrate that the ratio of strong to weak interfaces could affect HER reaction rates. Optimal catalytic performance was achieved when the ratio was 95:5 for Pt@A&R-TiO2 (105 mA cm−2@100 mV). High-energy ball milling effectively bonded Pt to the support and controlled the active Pt size, even achieving uniform distribution (±0.01 nm). Our results show that the bonding between Pt and support improve the stability of the nanocatalysts ((Delta)V = 25 mV at 100 mA cm−2). In addition, Pt@A9R1 || IrO2 appliance only requires η10 of 1.569 V to drive the OWS, Pt@A9R1 || RuO2 could achieve a current density of 1.0 A cm−2 at a voltage of 2.42 V at a Pt mass loading of 0.05 mgPt cm−2 in PEMWE. At a constant current density of 1.0 A cm−2, it exhibited little performance loss for more than 100 h, representing one of the highest levels in the reported PEMWE with a low Pt mass loading. The construction of strong-weak dual interface and the facile high-energy ball milling technique can be further applied to prepare a variety of catalysts. The hypothesis and strategy open a approach to producing efficient and stable nanocatalysts.
Methods
Materials
Tetrabutyl titanate applied as titanium source to produce support. The noble metal used in this experiment is H2PtCl6·6H2O. Both were bought on Aladdin’s official website.
Experimental
Using tetrabutyl titanate as the titanium source (2, 3, 4, 5, 6, and 8 ml), it was mixed with ethanol under acidic conditions to form the precursor solution. Then, slowly added a hydrolyzing agent (ethanol and water) in the precursor solution, followed by the introduction of H2PtCl6·6H2O at different concentrations (3, 5, 7, and 10 mmol/L). High-energy ball milling was applied to the resulting PtTi mixed solution with varying amounts of milling balls (ball-to-material ratio of 1:3, 1:2, 1:1, and 2:1) for different durations (0, 1, 1.5, 2, 2.5, 3, and 4.5 h). The catalyst precursor powder was then obtained through centrifugation and drying. Subsequently, the precursor powder was calcined at various temperatures (600, 700, 800, 900 °C) in an Ar atmosphere at a rate of 2 °C/min for 2 h, yielding Pt@A&R-TiO2 with varying strong-weak dual interface.
Characterizations
FTIR measurements were conducted on a Thermo Scientific Nicolet iS20 in the wavenumber range of 400 cm−1 to 4000 cm−1 to calculate the sample’s transmittance. XRD studies were performed on a high-power X-ray diffractometer (Bruker, D8 Advance) at a scanning rate of 5°/min. The micro- and nano-morphologies of the electrocatalysts were examined using SEM (Zeiss Supra-55) and TEM on a FEI-Tecnai G2 F30. High-angle annular dark-field STEM images were acquired from a corrected FEI Titan Cubed Themis G2 microscope operating at 300 kV, equipped with an X-FEG gun and a Bruker Super-X EDX detector. Raman spectroscopy (Horiba LabRAM HR Evolution, Japan) was conducted with a 532 nm laser over a wavenumber range of 100 cm−1 to 4000 cm−1. XPS was measured using a Thermo Scientific K-Alpha system. The Pt content in the samples was quantified by ICP-OES (Agilent ICP-OES 5800, USA).
To analyze the phase composition of anatase and rutile at strong and weak interfaces, a quantitative phase composition analysis of the samples was performed using the adiabatic method. The ‘adiabatic method’ treats the sample as an environment isolated from the external environment, without the inclusion of any external standard materials. After conducting XRD tests on the sample and identifying the various phases, the integral intensities of the strongest peak for each phase were measured, denoted as ({I}_{i}), ({I}_{j}), etc. Subsequently, the PDF cards for each phase were consulted to determine the K values (({K}_{i}), ({K}_{j})) for each phase. A certain phase i was then chosen as a reference value (left({K}_{i}^{j}=frac{{K}_{j}}{{K}_{i}}right)), and the K values for each phase are converted (left(frac{{I}_{j}}{{I}_{i}}={K}_{i}^{j}times frac{{w}_{j}}{{w}_{i}}right)). Finally, the mass fractions w of each phase were calculated according to the formula.
Electrocatalytic measurements
The three-electrode test for half-reactions and the two-electrode test for OWS test are obtained through CHE760. A mixture was prepared by combining 5 mg of catalyst with ethanol, ultrapure water, and 5 wt% Nafion solution to create a 1 ml ink. This ink was then sonicated for 30 min. Ten microliters of the ink were drop cast onto a freshly polished glassy carbon electrode (diameter = 5 mm) to uniformly coat the electrode. Additionally, the commercial Pt/C used in this experiment was purchased from Shanghai Hesen Electric Co., Ltd., with a Pt loading of approximately 20 wt%. Linear sweep voltammetry (LSV) and CV used to investigate the HER performance were conducted in a 0.5 M H2SO4 solution with a conventional three-electrode electrochemical setup. An L-type glassy carbon electrode served as the working electrode, while a carbon rod electrode and an Ag/AgCl electrode (with saturated KCl) were used as the counter and reference electrodes, respectively. LSV was carried out at a scan rate of 10 mV s−1 within a potential window of −0.08 mV to 0.44 mV. To calibrate all measured potentials to the RHE, the equation ({E}_{{RHE}}=,{E}_{{Ag}/{AgCl}},+0.197+0.059times {{{rm{pH}}}}) was used. During the HER process, the surface of the working electrode was covered with H2 bubbles. To accelerate the diffusion of H2, all LSV polarization curves were IR-corrected using 80% IR compensation. The correction was calculated using the following equation: ({E}_{({corrected})}=,{E}_{({measured})},-{{{rm{i}}}}{R}_{s}). The OWS is conducted using the same method to prepare and test on the glassy carbon electrode. Place two glassy carbon electrodes coated with cathode and anode catalysts facing each other to investigate the catalytic performance and stability in overall water splitting.
In the investigation of practical applications in PEM, Pt@A9R1 and commercial Pt/C are used as cathode catalysts, and RuO2 is used as the anode catalyst. The ratio of the addition of cathode to anode catalysts is 1 to 2. The prepared cathode and anode catalyst pastes are evenly sprayed on both sides of the pre-treated Nafion 117 membrane using the spray coating method to prepare the Catalyst-Coated Membrane (CCM). Subsequently, it is assembled with the gas diffusion layer (0.25 mm thick titanium fiber and platinum fiber as the gas diffusion layers on the cathode and anode sides, respectively) and the serpentine flow field to obtain the single cell hardware components. The PEM electrolyzer operates at a temperature of 80 °C using distilled water as the electrolyte solution with a flow rate of 40 mL min−1. The performance of the PEM electrolyzer is evaluated by measuring the polarization curve from 0.04 V to 3 V. The stability of the PEM electrolyzer is assessed by measuring the chronopotentiometry at 1.0 A cm−2. It should be noted that during the stability test process, the electrolyte solution gradually evaporates in the heating cycle. When we replenish the electrolyte solution, the curve will fluctuate but will quickly recover. To investigate the differences in the catalytic layers of Pt@A9R1 and commercial Pt/C cathodes after stability testing, the CCM was removed after PEM testing. A slender strip was cut along its edge using scissors, which was subsequently positioned upright on the SEM sample stage for detailed examination.
DFT calculation
The first-principles simulations based on the Kohn-Sham formalism of the DFT as implemented in the Vienna ab initio simulation package, version 6.3.2. The projector augmented wave method of Blöchl was employed to describe the electron-ion interactions. The widely used generalized gradient approximations of Perdew-Burke-Ernzerhof (GGA-PBE) were utilized to consider the exchange correlation potential. The cutoff energy was set to 450 eV for the plane-wave basis with a Gaussian smearing of 0.05 eV in width. Monkhorst–Pack k-point of 2 × 2 × 1 was used to sample the Brillouin zone. The height of the vacuum layer was set to 15 Å to avoid any interaction between the nearby periodic slabs. DFT-D3 with the BJ-damping method developed by Grimme was included to consider the van der Waals interactions (vdWs). The convergence criterion for energy and the force tolerance for ionic relaxation were set as 10−5 eV and 0.02 eV Å−1, respectively.
The hydrogen adsorption energy (ΔE) is represented by the equation:
where E*H, E*, and EH2 are the total energies of catalyst binding with one H atom, isolated catalvst, and H2 molecule, respectively. The hydrogen adsorption free energy (ΔG*H) is considered as an indicator to investigate the catalytic performance of HER, and it can be expressed as:

Responses