Strong wind is one of the important factors that trigger landslides
Introduction
Landslides are one of the important natural disasters, causing numerous casualties and property losses. During rainfall, water infiltrating into the ground causes an increase in pore water pressure between soil particles and rock fractures, leading to a decrease in effective stress and shear strength of the soil mass. When these changes exceed the critical threshold needed to trigger slope failure, slope stability is compromised, resulting in landslides. Over the years, several studies focused on factors, such as geological conditions, soil, slope, and heavy rainfall, to explore the causes of landslides1,2,3,4,5, and build prediction models6. However, the combined impact of strong winds and heavy rainfall caused by typhoons often results in more landslides, particularly in regions where typhoons are prevalent, and the impact of strong winds is often overlooked. Past research rarely discusses the impact of strong winds on landslides, and only a few studies have explored how strong winds increase the kinetic energy of rainfall drops and affect landslides or erosion7,8,9. Currently, the landslide and debris flow warning thresholds set by governments globally mostly consider the rainfall threshold10,11,12,13.
From a physical perspective, tree roots penetrate deeply into the soil and have the potential to loosen the soil when exposed to strong winds during typhoon events14,15; particularly, during typhoons, which often bring sudden maximum gusts that induce the rapid swaying of trees in a short period of time. With sufficient rainfall, this may provide sufficient initial kinetic energy for shallow landslides, becoming an important trigger for landslides. In 2015, Typhoon Soudelor caused multiple severe shallow landslides in the Wulai and Xindian areas of New Taipei City in Taiwan, resulting in severe river water level rise, flooding, and water supply issues16,17. The energy caused by the strong winds of this typhoon was perceived to be one of the strongest in recent years, resulting in the falling of a large number of trees in urban and mountainous areas. Particularly, most of the areas affected by landslides are mainly in the forest. In other words, Typhoon Soudelor was windy and not particularly rainy yet it caused a great number of landslides in forested areas. This leads to the hypothesis that wind-driven disturbance of forests contributes to destabilization of soils and perhaps reduces failure criteria for certain areas. However, owing to past limitations in understanding factors triggering landslide, research has mainly focused on rainfall.
Most of the landslides induced by typhoon Soudelor in the Wulai and Xindian areas of New Taipei City, Taiwan in 2015 occurred in the natural broad-leaved forests. Compared to the coniferous forests with lower leaf area, these broad-leaved forests experience greater force and moment during strong winds15,18,19. In addition, most of the broad-leaved forests in the area grow along the slopes of the mountains, where the soil thickness is shallow and rock formations follow. Moreover, most of the landslide areas caused by Typhoon Soudelor in 2015 were on the windward slope20.
In urban areas, the collapse of street trees owing to typhoons is a common occurrence. When a street tree falls, it often lifts the entire layer of concrete on top, along with the general soil. These roadside trees have their root systems protected by concrete surfaces, and they experience lower wind speeds compared to open, natural hillside terrain. In other words, even the roadside trees in urban areas, covered by concrete pavement and exposed to weaker wind speeds compared to open mountain forests, can still be uprooted. This makes it even more likely for trees in mountain forests to suffer the same fate. When uprooted, the disturbance also loosens the soil, potentially leading to landslides. Previous study has confirmed the influence of high soil saturation on the turning resistance of trees by conducting winching tests on three roadside tree species found in urban areas21. This study has established the physical mechanism relationship between the diameter at breast height of trees and the strength of the strong wind during typhoons. Even the roadside trees protected by concrete surfaces, will be easy to collapse due to strong winds of typhoons and overturn the entire piece of concrete, let alone the trees on natural hillsides lack the protective concrete layer, making them susceptible to uprooting and toppling. In the past, literature has traditionally modeled the physical mechanisms governing the structural behavior of tree collapse15. Some other studies have tried to include the wind effect to landslide with different approach, including the wind-driven precipitation field with topography is an important control of shallow landslides triggered by convective storms22, wind as forest disturbance agent23, and landslide occurrence is positively correlated with exposure to wind disturbance in temperate rainforests24. However, no study has conducted a comprehensive analysis of the combined effects of strong winds and heavy rainfall on landslides using extensive observational data across different times and spatial scales.
Furthermore, the current typhoon intensity classification is mainly based on the center pressure and wind speed, but many regions consider heavy rainfall as one of the hazards caused by tropical cyclones. This indicates that the current typhoon intensity classification is insufficient to fully represent the potential disaster level for disaster prevention25 and understand the interaction with heavy rainfall and strong wind. For example, in 2009, Typhoon Morakot was classified as a moderate typhoon in the Central Weather Bureau’s typhoon intensity classification in Taiwan; however, it broke the record for the highest accumulated rainfall amount in various meteorological and hydrological observations, and the accumulated rainfall in three days exceeded the annual average rainfall of Taiwan (2500 mm) and led to severe landslide events resulting in the death of a large number of residents26. Therefore, introducing a new indicator to understand the joint impact of wind and rain as contributing factors to typhoon disaster prevention has become increasingly crucial, particularly for the prevention of landslides.
This study attempted to find evidence to prove this hypothesis. To this end, the wind and rain characteristics of landslides caused by typhoons between 1996 and 2020 were statistically investigated to verify the hypothesis that “in addition to rainfall, strong wind is also an important factor causing landslides during typhoons.” Figure S1 shows the conceptual illustration of the combined rain–wind-induced landslide with trees. Random Forest machine learning model is constructed to predict the occurrences of landslides based on factors, such as heavy rain, strong winds, traditional geological conditions, and topographical factors. In addition, we also exam the models with wind factors have better performance than models without wind factors or not.
Methods
The meteorological data used in this study were obtained from the Central Weather Administration (CWA) of the Ministry of Transportation and Communications, Taiwan. After excluding 16 stations on outlying islands, 2 radar stations, and 140 automatic rainfall stations without wind speed data, data was obtained hourly from a total of 499 weather observation (wind speed and rainfall) stations (Fig. 1). The historical list of slope disasters and the list of typhoon warnings were obtained from the National Center for Disaster Reduction (NCDR) and the Typhoon Database of the Central Weather Bureau, respectively. These databases contain a total of 8401 landslide records from 83 typhoon events. The typhoon events and periods are defined by the official announcement of warning period from CWA. Figure 2 and Table 1 show the spatial distribution of landslide locations and the correlation between typhoon events and landslide occurrences. 20(,times ,)2 m Digital Elevation Model (DEM) data was obtained from the Ministry of the Interior, Taiwan.
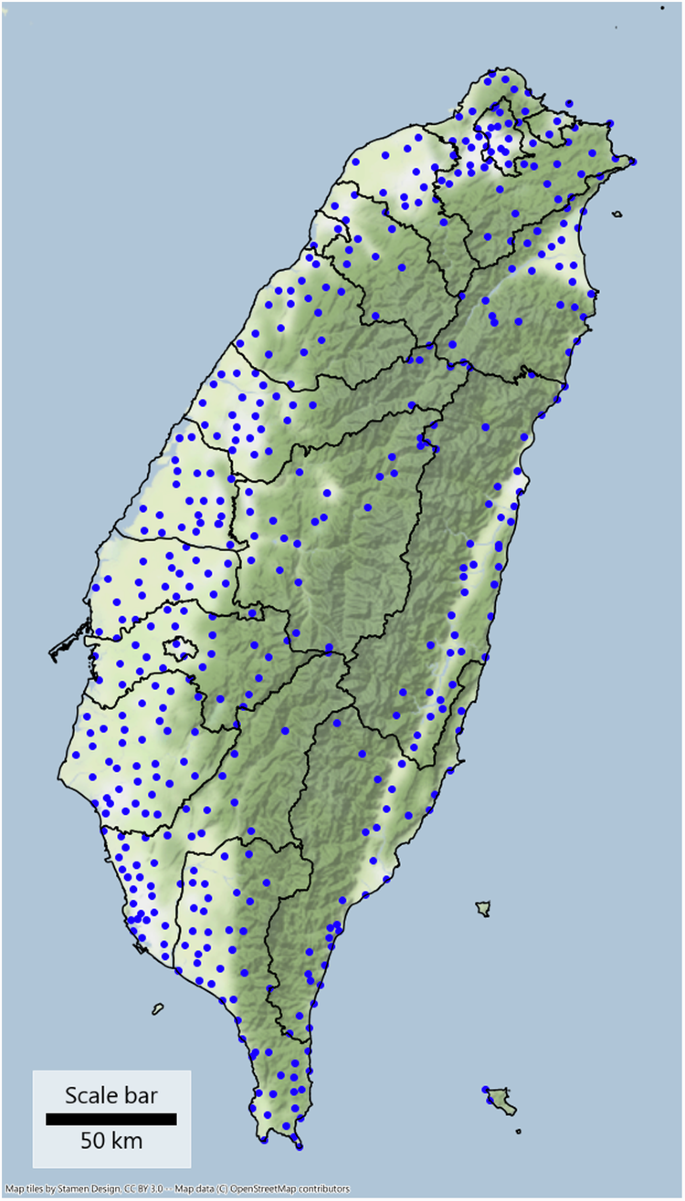
Study area and a total of 499 weather stations (blue dots) considered in this study.
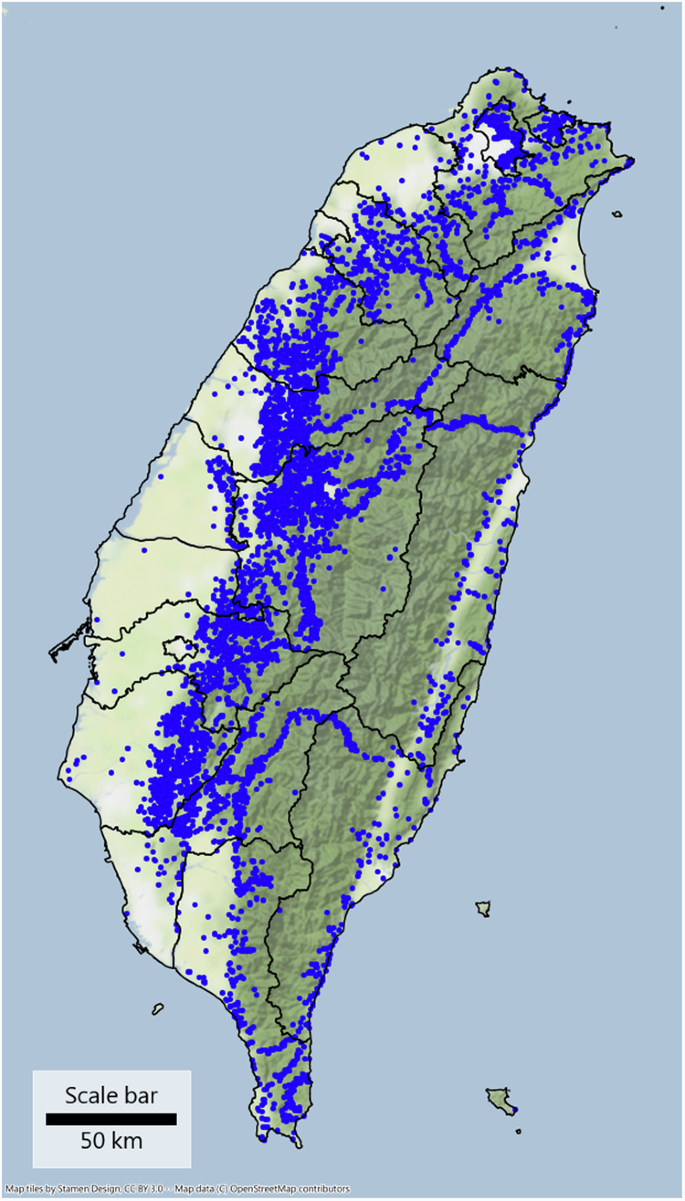
Blue dots are historical landslides points.
Typhoon type index (TTI)
Tropical cyclones are mainly characterized by strong winds and heavy rainfall; however, traditional typhoon intensity classification systems do not consider the hazards associated with rainfall. Therefore, in this study, the “top 25% average wind speed” and “accumulated rainfall” during the typhoon warning period were used as feature variables to construct a statistical regression model for all weather stations in Taiwan. In statistics, 25% is the commonly used threshold representing highest quantile level. It is able to find out the higher condition of wind speed without affected only by extreme values. This model classified typhoons into “wind-type typhoons” or “rain-type typhoons” to evaluate whether the main feature of historical typhoons that hit Taiwan at different weather stations was strong winds or heavy rainfall25. The relevant formula is shown in Equation (1)
Where (Y) is the dependent variable, which is the top 25% average wind speed (m/s) at a certain weather station during the typhoon warning period, and (X) is the independent variable, which is the accumulated rainfall (mm) at that weather station during the typhoon warning period. (beta) is the coefficient of the independent variable, and (alpha) is the constant intercept.
Generally, accumulated rainfall and wind speed during a typhoon are positively correlated. Typhoon events on or near the regression line represent “normal” phenomena, whereas events farther away from the regression line represent special situations that are biased toward a certain feature. For example, a positive residual value indicates that the typhoon feature is biased towards the Y-axis variable, indicating a wind-type typhoon, whereas a negative residual value indicates that the typhoon feature is biased towards the X-axis variable, indicating a rain-type typhoon. The distance between the residual value and the fitted line becomes the ideal indicator for the quantitative classification of “rain-type” and “wind-type” typhoons, which is the typhoon classification index. Therefore, the TTI for each typhoon event (i) and each weather station (j) can be defined as follows:
In Eq. (2), ({x}_{{ij}}) is the accumulated rainfall during the typhoon warning period for each typhoon event (i) and each weather station (j), and ({y}_{{ij}}) is the top 25% average wind speed for each typhoon event (i) and each weather station (j). Figure 3 shows the scatter plot of the accumulated rainfall and front 25% average wind speed for each typhoon event at the Yilan weather station and the typhoon classification model as an example.
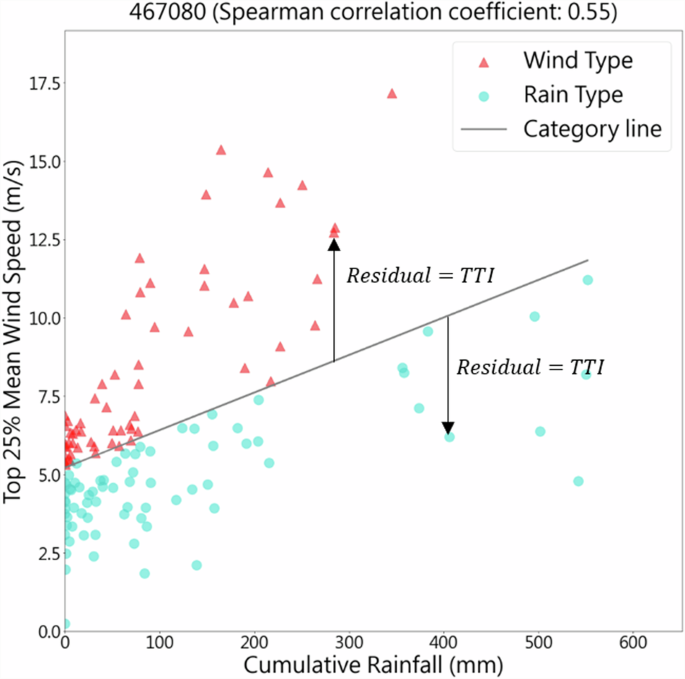
Typhoon classification model for Yilan weather station.
Spatial interpolation
After obtaining the five wind and rain indicators, including cumulative rainfall, hourly average rainfall, maximum hourly rainfall, top 10% average wind speed and the duration that the wind speed is over 10 m/s, from various meteorological stations for each typhoon event, the wind and rain indicators at each landslide point were estimated using the radial basis function (RBF) interpolation27. The RBF interpolation is a complete interpolation method that uses each observation point as the center to establish a symmetrical function. Subsequently, the weights of each function were calculated by varying the distance from the observation point to obtain the interpolation function, as shown in the following equation:
Here, φ is the central symmetric function and ({w}_{n}) is the weight of each function.
Machine learning model – Random Forest
To predict the occurrence of the landslide happened under the condition of each explanatory variables in all 8410 historical landslide points, the Machine Learning (ML) model was constructed using the following steps.
-
1.
Remove the Outlier, for example, three times the standard deviation.
-
2.
Construct the wind–rain index of each station during the typhoon alert period.
-
3.
Estimate the wind–rain index of the landslide point using RBF.
-
4.
Add geological condition.
-
(1)
Consider the different typhoon paths (announced and classified by CWA, Taiwan).
-
(2)
The number of clusters refers to the Landslide Geologically Sensitive Area (announced by Taiwanese government, Central Geological Survey, as shown in Figure S2) and Silhouette coefficient (the index used for evaluating the clustering analysis28).
-
5.
Solve the class imbalance problem.
-
(1)
Separate the occurrence of landslide based on one typhoon event.
-
(2)
Randomly select the non-landslide event, and let the number of non-landslide and landslide events be the same.
-
6.
Construct model using Random Forest algorithm.
Fourteen variables were included in the random forest model, including (1) TTI, (2) Number of hours with a wind speed of over 10 m/s, (3) Cumulative rainfall, (4) Average wind speed of the top 10%, (5) Average hourly rainfall, (6) Maximum cumulative rainfall within 6 h, (7) Maximum hourly Rainfall, (8) Elevation, (9) Slope, (10) Topographic position index (TPI), (11) Terrain ruggedness index (TRI), (12) Aspect, (13) Roughness, (14) Landslide clustering area by K-means.
K-means is one of the most commonly used clustering method, it is able to cluster the spatial points into several groups. Due to the various spatial characteristics of geological conditions and typhoon trajectories in Taiwan, it is necessary to group the landslide points by clustering analysis. Figure 4 shows the K-means clustering analysis of all historical landslide points in Taiwan. The number of the clusters refers to the Landslide Geologically Sensitive Area and Silhouette coefficient.
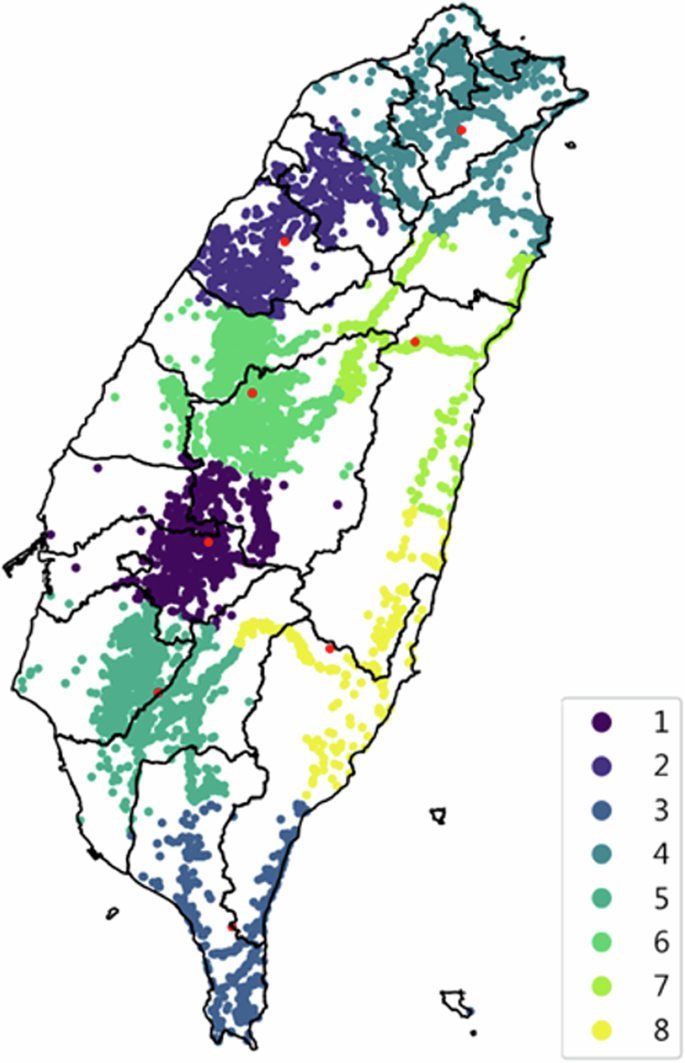
The number of the clusters refers to the Landslide Geologically Sensitive Area and Silhouette coefficient.
The Random Forest algorithm is a machine learning algorithm that integrates multiple decision trees through the ensemble learning concept. Each decision tree is a fundamental unit of the Random Forest algorithm, which belongs to a branch of machine learning known as ensemble learning. Random Forest is a subclass of ensemble learning, and it relies on the voting choices of decision trees to determine the final classification result. In the case of the classification problems, each decision tree in the Random Forest is a classifier. By introducing randomness into the classification methods of each decision tree, for a given input sample, there will be N classification results from N trees. Thereafter, the Random Forest integrates all the classification voting results and designates the class with the highest vote count as the final output. Each tree in the forest is independent, and the predictions made by 99.9% of unrelated trees cover all possible cases, thereby canceling out each other’s predictions. This approach can address some noise issues and produce optimized predictions.
The concept of Random Forest (Fig. 5) originates from the concept of bagging, proposed by Breiman29,30 in 1996 (Bagging is an abbreviation for Bootstrap aggregating). Bagging enabled the model to achieve improved training by leveraging the differences in the data itself. This method randomly selects K samples from the training dataset and trains K classifiers (trees) based on these K samples. At each time, the selected K samples are returned into the population, known as resampling with replacement (Bootstrap method). Therefore, there will be some overlapping data among these K samples. However, as the samples for each tree are different, the trained classifiers (trees) are diverse. The basic steps of the Random Forest operation are as follows.
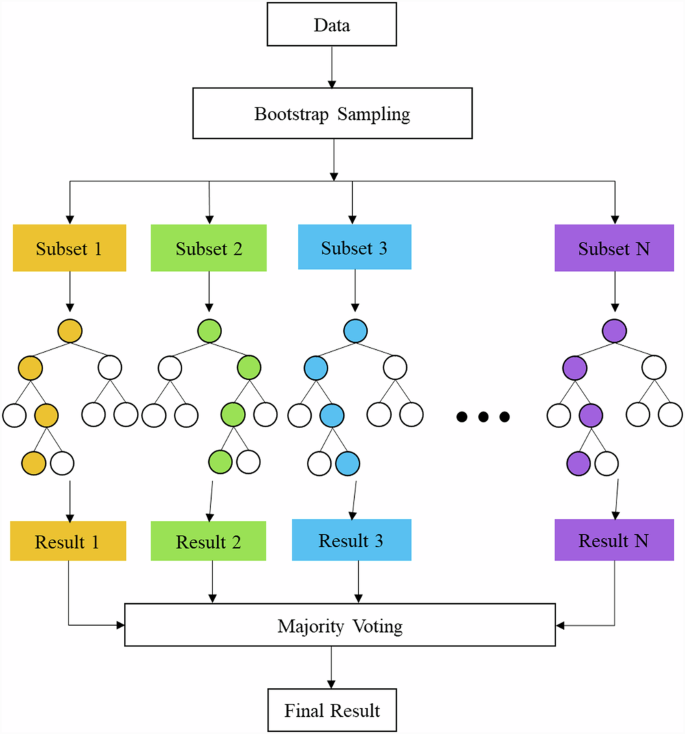
Flowchart of the Random Forest model.
Let S represents the number of training sets, and F represents the number of features (variables) in the training samples:
-
1.
Perform S iterations of resampling with replacement (Bootstrap method) to randomly sample from the training samples, thus creating a training set. The samples not selected for training are used as the testing set to evaluate the error.
-
2.
For each training set generated from the resampling method, a decision tree was created. At each node of the tree:
-
(1)
Randomly and non-repetitively select f features.
-
(2)
Use these f features to calculate the optimal splitting criteria for the decision tree.
-
(3)
Continue splitting until the tree reaches the minimum impurity level, without requiring tree pruning.
-
3.
Repeat the above steps n times to generate n decision trees, forming the ensemble of decision trees in the Random Forest.
-
4.
Use the trained Random Forest model to predict the testing set. The final prediction is determined by the majority vote of the outputs from each tree in the Random Forest.
Results
Figure 6 shows histograms comparing different rainfall and wind indices under normal conditions and landslide events. The results demonstrated that there were significant differences in the distribution, as well as the right shifting of peaks when landslide events occurred compared to under normal conditions. This implies that the wind and rain conditions when a typhoon landslide event occurs are both significantly greater than when no landslide event occurs. In addition, landslides are often accompanied by stronger winds; however, previous studies only considered the impact of rainfall.
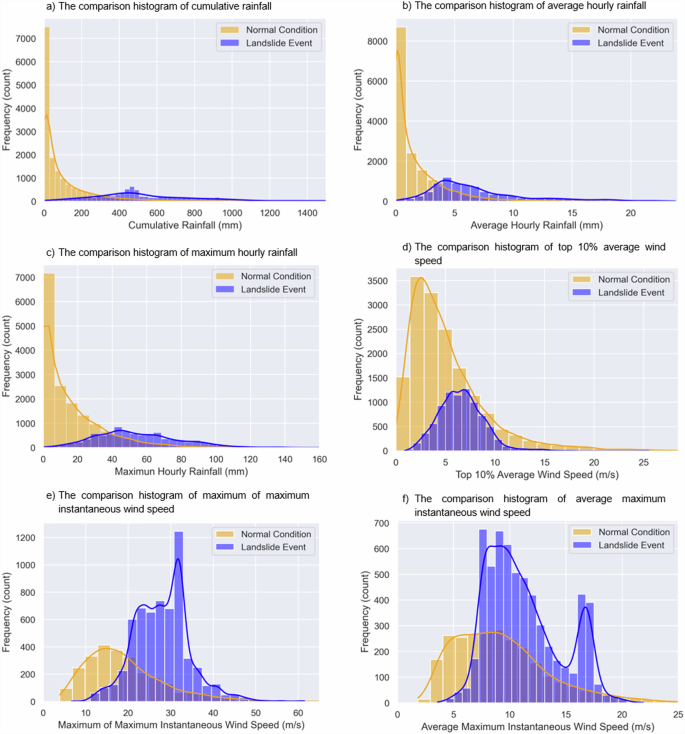
a Cumulative rainfall, b average hourly rainfall, c maximum hourly rainfall, d top 10% average wind speed, e maximum of maximum instantaneous wind speed (during warning periods), and f average maximum instantaneous wind speed (during warning periods).
In Fig. 6d, the “top 10% average wind speed” represents the averaged maximum top 10% hourly wind speeds during the typhoon warning period. In Fig. 6e, “maximum of the maximum instantaneous wind speed” refers to the highest instantaneous wind speed recorded during the typhoon warning period. Figure 6f represents the average of the maximum instantaneous wind speeds occurring during the typhoon warning period. It is evident that these wind speed indicators exhibit significant differences between occurrences of landslides and normal conditions. These differences are substantial, and the shape of the distribution is noticeably distinct from normal conditions, shifting from its original positive skewness tendency to a negative skewness.
The Mann–Whitney U test, also known as the Wilcoxon rank-sum test, is a non-parametric statistical test used to determine whether two independent sample groups originate from the same population or whether the two groups have the same data distribution at the statistical level31,32. Therefore, to quantify the statistical significance of the difference between normal conditions and landslide events, the Mann–Whitney U test results of the average hourly rainfall, maximum hourly rainfall, cumulative rainfall, and average top 10% wind speed under the distribution differences of the normal and landslide event conditions were obtained (Table 2). The corresponding comparison histograms are shown in Figure S3. Figure S3 and Fig. 6 both depict statistical distributions during typhoon warning periods (typhoon events). Although typhoon warnings are issued, they are often influenced by factors such as topography or the storm’s path, which may not result in significant rainfall or strong winds in specific areas. “Normal condition” or “non-landslide event” refers to situations during typhoon events where no landslides occur. The Mann–Whitney U test results revealed that there were highly significant differences with a significant level of P ≤ 0.001.
However, this above statistical analysis results may be influenced by the fact that heavy rainfall events are typically accompanied by strong winds, resulting in significant differences in the distribution of landslide occurrence with or without wind-induced factors. Therefore, we investigated the combined effects of strong winds and heavy rain on landslides. Figure 7a–c shows the frequency distribution of landslide occurrences with different rainfall indicators and the top 10% average wind speed. The distribution includes the: (a) Cumulative rainfall, (b) average hourly rainfall, and (c) maximum hourly rainfall. Traditionally, it is known that the probability of landslides occurring increases with an increase in various rainfall indicators (the tail of the distribution along the rainfall axis). Although most landslides occur under general heavy rainfall conditions rather than under extreme rainfall conditions (positive skewed), it is also because the probability of extreme rainfall events occurring is inherently low. However, there may be other underlying factors, which result in the occurrence of several landslides without reaching very extreme rainfall levels.
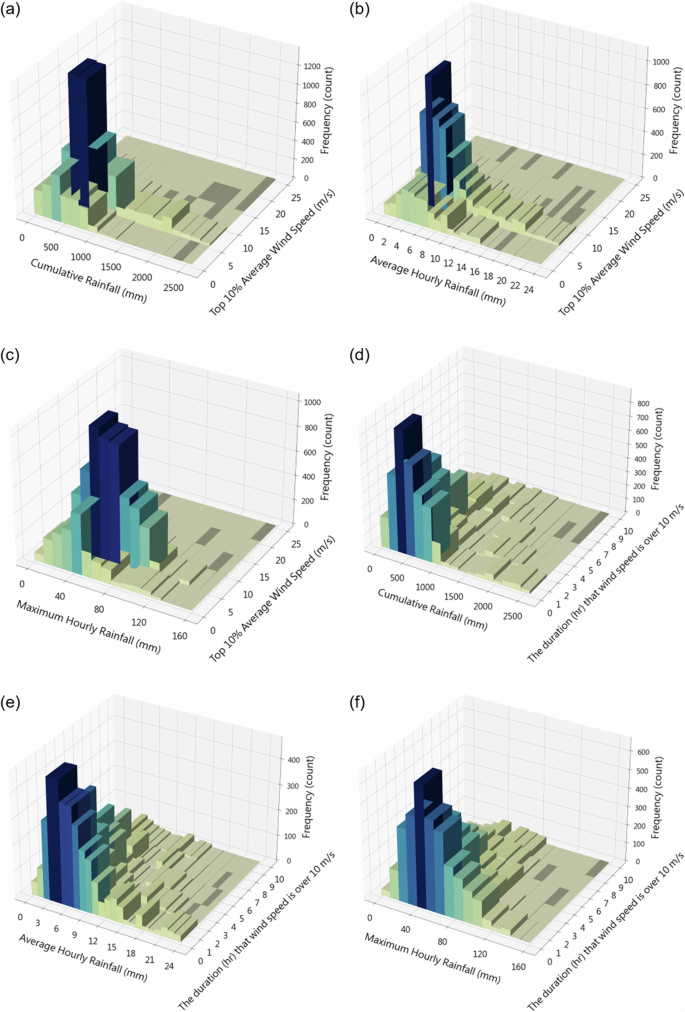
a–c Average wind speed of the top 10% and cumulative rainfall, hourly average rainfall, and maximum hourly rainfall, respectively. d–f The duration (h), in which the wind speed is over 10 m/s and cumulative rainfall, hourly average rainfall, and maximum hourly rainfall, respectively.
In Fig. 7a–c, the wind is characterized by the top 10% average wind speed. Nevertheless, due to the averaging effect and the infrequency of extreme wind events during warning periods, it is challenging to directly depict the impact of strong winds in a straightforward manner. This implies that the top 10% average wind speed mostly falls in lower positions. However, in Fig. 7d–f, we changed the wind indicator to “The duration (h) in which the wind speed is over 10 m/s”, and it exhibits a positive skewed distribution similar to the rainfall direction. This implies that the probability of landslides occurring increased with an increase in the duration of strong wind (the tail of the distribution along the strong wind duration axis).
The key focus of Fig. 7 is to examine whether there is a shift in the distribution of landslides occurring under the combined influence of strong winds and heavy rainfall. Extreme values of both wind and rain are relatively rare, which is why the peak of the distribution is naturally concentrated at lower values and exhibits a positively skewed shape. However, just as heavy rainfall can impact landslides, there is still a tail in the distribution as rainfall increases, signifying a certain probability of occurrence. In Fig. 7a–c, where the wind speed factor is the “top 10% average wind speed,” there is no tail observed for higher wind speed values. Conversely, in Fig. 7d–f, where “the duration that the wind speed is over 10 m/s” is considered, a positively skewed distribution with a tail to extreme values becomes evident, similar to the distribution observed for rainfall. It proves that the factor of “the duration that the wind speed is over 10 m/s” have influence to landslide, just like rainfall.
In summary, our results indicated that landslides are significantly triggered when “The duration (h), in which the wind speed is over 10 m/s” is longer despite the small total accumulated rainfall or short-duration hourly rainfall. Compared to strong wind speed, the lasting duration of strong wind is the most important factor affecting the landslide. When combined with the lasting duration of strong wind and maximum hourly rainfall of ≧40 mm or cumulative rainfall ≧350 mm, landslides are most likely to occur (Fig. 7d, f). In addition, the combination of extreme strong wind lasting duration and hourly-scale rainfall indicators, particularly the average hourly rainfall (Fig. 7d) and maximum hourly rainfall (Fig. 7e) exhibited the most significant statistical distribution phenomena.
Figure 8 categorizes the landslide events into groups based on their rainfall amounts, and examines the distribution of the top 25% average wind speeds under different rainfall amounts. Generally, the wind speed during typhoons is positively correlated with rainfall amounts. However, the results indicated that compared to other rainfall groups, there were more extreme average wind speed values in the low rainfall group (the leftmost boxplot), suggesting that factors other than rainfall, such as wind speed, have influenced the occurrence of landslides in the low rainfall group.
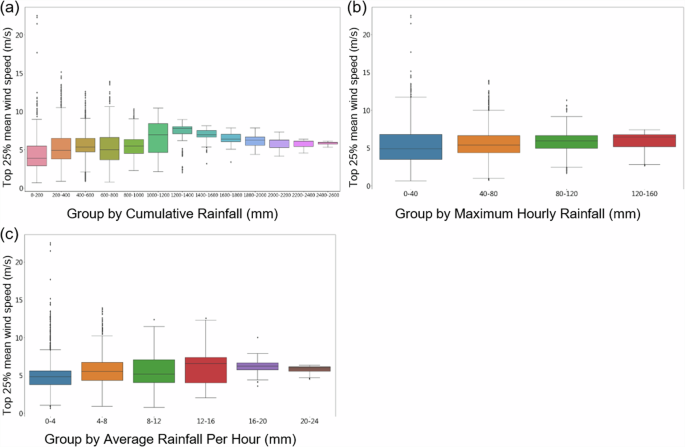
a Cumulative rainfall, b maximum hourly rainfall, and c average hourly rainfall.
Lastly, we constructed a binary machine learning Random Forest prediction model to predict landslide occurrences based on factors, such as heavy rain, strong winds, traditional geological conditions, and topographical factors. Generally, it is very difficult to accurately predict where or when will have landslides. The cross-validation results exhibited an accuracy of 70.82% (without wind factors) and 75.03% (with wind factors), indicating a certain level of predictive ability and improvement with wind factors included. Moreover, according to the results of the Feature Importance (Fig. 9), the rainfall indicators are the most significant feature, which were followed by the TTI index, which is an index describing the rainfall or strong wind characteristics, as well as wind speed, of typhoon. These features were followed by traditional topographical factors, such as topographic position index (TPI), aspect, slope, and terrain ruggedness index (TRI).
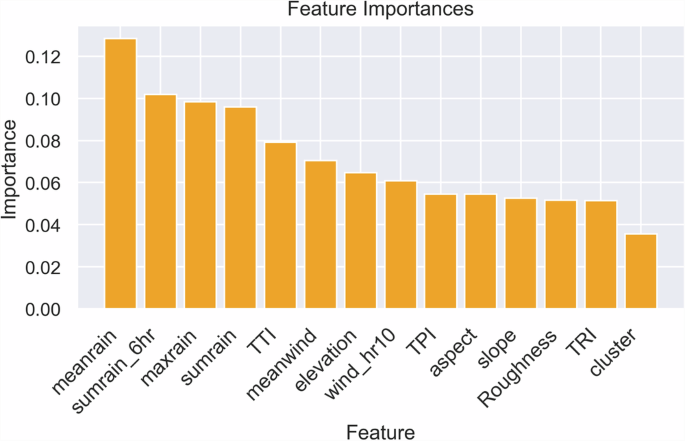
Where, meanrain means averaged hourly rainfall; sumrain_6 h means maximum cumulative rainfall within 6 h; maxrain means maximum hourly rainfall; sumrain means cumulative rainfall. TTI is an index describing the tend to rainfall or strong wind characteristics of typhoon; meanwind means Top 10% average wind speed; wind_hr10 means the duration (h) in which the wind speed is over 10 m/s; TPI means Topographic Position Index; TRI means Terrain Ruggedness index; cluster means landslide clustering area by K-means.
Discussion
Different forest types and tree species may exhibit different types of landslide behavior owing to differences in their root systems (e.g., taproots and fibrous roots)33,34,35. Traditionally, large-scale vegetation planting is the main approach for slope protection and soil conservation36. However, the results of this study indicated that compared to grasslands, trees may offer less protection against shallow landslides under certain strong wind conditions. This is because when combined with trees, strong winds may be a major trigger for shallow landslides. The results of this study also indicated that the long-term effect of strong winds may result in landslides. However, the influence of strong winds on landslides may be mainly observed for shallow landslides, whereas deep-seated landslides or large-scale landslides is less affected by strong winds, which is not considered the differences in this study. Due to the limitation of data, we consider all the landslides event without separating them.
Furthermore, it can be hypothesized that the instantaneous gust strength, the wind-facing leaf surface area of broad-leaved forests, and the back-and-forth movement of trees may cause varying degrees of elastic torque on the roots. These can be further investigated from a physical analysis perspective14. From the point of view of Mohr–Coulomb theory, which is the most commonly used failure criterion to describe the conditions for which an isotropic material will fail37, the back-and-forth movement of trees and roots caused by strong winds may significantly increase the tensile stress on the soil failure surface, causing the section to reach a critical state and become more prone to sliding. Because Mohr–Coulomb theory can be expressed as a function of either the major and minor principal stresses or the normal stress σ and shear stress τ acting on the failure plane38. In this study, we employed the data-driven approach to prove this phenomenon of the combined influence of heavy rain and strong wind on landslide. In addition, the mechanical analysis of the shear stress generated by strong wind and trees on the surface soil can be a good approach in the future, but different locations of landslide events will have different geological conditions and parameters of Mohr–Coulomb theory, it will be the biggest challenge in the future.
The factors affecting the spatial distribution of typhoon wind and rainfall characteristics are complex and intertwined25. Owing to the interaction between Taiwan’s terrain and the southwest airflow and northeast monsoon, typhoons may produce different patterns of heavy rainfall, including the location of the Pacific high-pressure system, the moisture content nearby, and the rainfall and wind speed patterns on the windward and leeward sides of the typhoon26,39. The distribution of rainfall and the strength and movement of the rain bands during typhoon invasion are closely related. Owing to the influence of Taiwan’s terrain, the rain bands accompanying typhoons are often severely disrupted, but in some cases, the rain bands of typhoons may undergo a reconstruction process. A rain band is a cloud and precipitation formation linked to an elongated region of rainfall. For westward-moving typhoons that pass through the Central Mountain Range and undergo a reconstruction of the rain bands, serious rainfall disasters are likely to occur in the western half of the plain areas.
In this study, we characterized landslide-initiating typhoon events and found that strong wind is correlated with landslide occurrence. Two conclusions can be drawn from the results of this study: (1) Landslides can occur even during periods of low rainfall, indicating that landslides during typhoons are not solely caused by heavy rainfall, and (2) The frequency of the occurrence of landslides under the same rainfall conditions have significant tail with an increase in the wind speed compared with normal condition, particularly strong wind lasting for hours. This indicates that both strong winds and heavy rainfall during typhoons may increase the risk of landslides.
Furthermore, the inclusion of TTI solved the issue of the collinearity effect of rainfall and strong wind of typhoon events on landslide, enabling the prediction of the occurrences of landslide by the machine learning model. Although not all the landslides are triggered by wind, some landslide events are triggered by strong wind, particularly the shallow landslides during typhoon events. Different combination of geological conditions and forest types or trees should be considered in the future. In addition, if shallow landslide events could be distinguished first, our proposed analysis may have better results.


Responses