Structural and transcriptional signatures of arithmetic abilities in children

Introduction
Arithmetic ability is not only essential for everyday life, but also for academic achievement1, career development2, future economic success3 and general quality of life4. In addition, those who are functionally innumerate or suffering from dyscalculia have specific and persistent difficulties understanding numbers which can lead to a diverse range of difficulties with mathematics and even have more difficulties and barriers in finding work5. Therefore, it is necessary to study the neural mechanisms underlying arithmetic ability, which can help understand individual differences in arithmetic ability as well as dyscalculia.
In seeking neural mechanisms related to arithmetic ability, brain structural information is widely used to investigate the relationship between region-specific measurements of gray matter volume (GMV) and cognitive measures of interest. Over the last decades, considerable progress has been made in understanding the relationship between brain structure and math skills in typically development children, although findings are mixed. The system of magnitude representation is specifically located in intraparietal sulcus (IPS)6,7. Further, IPS is associated with the execution of procedural strategies in arithmetic tasks, such as counting and decomposition strategies8. Therefore, considering its importance in numerical cognition and arithmetic tasks, IPS receives a lot of attention in ROI analyses. The GMV of the left IPS has been found to be associated with individual differences in non-symbolic number perception9. One study shows that math performance is positively correlated with the GMV of the left IPS, suggesting that IPS is associated with typical math development in 10-year-old schoolchildren10. In addition to IPS, the MTG/STG is involved in storing the representations of arithmetic facts in a verbal code in long-term memory11. For 8–9 years old students, GMV in the right fusiform gyrus is positively correlated with arithmetic fluency12. The angular gyrus, particularly in the left hemisphere, has been associated with automatic arithmetic fact retrieval13,14. Possible reasons for these inconsistent results are differences of the tests used to measure math performance and the different age groups of children included. Suarez-Pelliconi et al. first studied the association between the GMV of bilateral IPS and the GMV of left MTG/STG and different arithmetic tests15. Based on data from students around 11 years old and linear regression models, Suárez-Pellicioni et al. studied the relationship between arithmetic ability and GMV of bilateral IPS and left MTG/STG. Further, in the exclusive mask of these three regions, based on F-tests, Suárez-Pellicioni et al. explored the interaction between arithmetic ability and age in the rest of the whole brain15. Suárez-Pellicioni et al. found that GMV in left MTG/STG was associated with multiplication performance and that GMV in left IPS could predict longitudinal growth in children’s subtraction skills15. It should be noted that, in addition to counting, procedural strategy, and fact retrieval, completing arithmetic calculations also involves a variety of domain-general cognitive processes, including: working memory, decision-making, and attention, which may require the cooperation of widely distributed brain areas16,17. Suarez-Pelliconi et al. examined associations between a set of hypothesis-driven brain regions and arithmetic ability, but it is unclear whether individual differences in arithmetic ability could be embedded in the entire structural pattern of a group of brain regions.
On the other hand, the structural and functional development of the brain is determined by genetic factors18,19. A previous study has shown that gray matter density in left IPS is moderately inherited20. Therefore, it is reasonable to explore genetic mechanisms underlying the inheritance of mathematical ability21. Candidate gene variations have been found to account for tiny effects in mathematics22, or have failed to replicate23. Meanwhile, studies exploring the genetic mechanisms associated with arithmetic ability have mainly focused on hypothesis-driven brain regions, e.g., parietal regions24. Thus, there is little evidence for genetic effects on the GMV of a group of brain regions associated with arithmetic ability. Recent advances in neuroimaging-transcriptome association analysis allow us to explore transcriptional signatures associated with patterns of spatial organization of human structural/functional networks25. Neuroimaging-transcriptome association analysis has been successfully applied to explore genetic information related to multiple structural/functional measures of brain, including: structural network changes in schizophrenia patients26, and changes in functional network modularity in healthy adolescents during development27. Yet, the relationship between structural patterns associated with children’s arithmetic abilities and gene expression profiles is still not fully understood.
In this study, we analyze data originally collected by Suárez-Pellicioni et al. 28, which is openly accessible. This dataset includes comprehensive neuroimaging and behavioral data from childhood and adolescence, providing a valuable resource for examining the neural correlates of arithmetic ability. Using this public dataset (n = 130) allows us to build on previous work and apply new analytical approaches to explore the genetic and structural basis of arithmetic skills. The gene transcription profile data were acquired from post-mortem data in adults29. Common strategies for solving arithmetic problems include fact retrieval and procedural calculation13. There are clear differences between the calculation strategies of subtraction and multiplication16,30,31. Subtraction is more quantity-based and influenced by activation of procedural knowledge based on a mental number line, whereas multiplication is related to retrieval of facts directly from memory without involving a mental number line6. Therefore, in the present study, we focused on subtraction and multiplication to examine the potential neural basis differences in solving different arithmetic problems. To obtain a reliable distributed representation pattern of individual difference in arithmetic ability (subtraction or multiplication performance), inspired by the connectome-based predictive (CPM) framework9,32,33,34,35,36, we constructed a data-driven predictive model based on brain-wide regional GMV information to predict individual differences in arithmetic ability using a leave-one-out cross-validation (LOOCV) procedure. Such a purely data-driven predictive model may avoid result bias caused by theoretical priors. In addition, The CPM-based predictive model employed a cross-validation approach to remove spurious effects, and can be generalized to new samples37, thus ensuring the reliability of the arithmetic predictive models. Working memory (WM) is thought to contribute to arithmetic by storing and processing intermediate steps involved in finding a solution to a problem38. WM is considered to be composed of multiple systems, of which verbal WM and visuospatial WM are two important components39. We also calculated the correlations between the output of the predictive model of arithmetic ability and verbal WM and visuospatial WM abilities to investigate whether there is a shared structural basis between them. Finally, we investigated the association between structural patterns associated with children’s arithmetic abilities and gene transcriptional profiles.
Results
Behavioral performance
This study involved multiple subtests to measure multiple aspects of children’s cognitive function, including arithmetic skills and WM. Arithmetic skills include subtraction and multiplication subtests of Comprehensive Mathematical Abilities Test (CMAT). WM involves verbal working memory and visual-spatial working memory scores from Automated Working Memory Assessment-Short Form (AWMA-S). The performance in these behavioral subtests is shown in Table 1. For all measurements, larger values would imply a better behavioral performance.
The GMV-based predictive model could predict individual difference in arithmetic ability
Inspired by the CPM approach9,32,33,34,35,36, we developed predictive models separately for subtraction and multiplication skills with LOOCV framework (Fig. 1). Taking the subtraction predictive model as an example, we identified brain regions associated with subtraction ability by calculating partial correlations between each ROI’s GMV and subtraction skills, controlling for age, gender, eTIV, and multiplication skills. ROIs with significant correlations (P < 0.01) during each LOO iteration in the training set were included in a feature set. A general linear model (GLM) was then fitted to relate these ROIs’ GMVs to subtraction skills, with age, gender, and eTIV as covariates. This GLM was subsequently used to predict the subtraction skill of the left-out participant in the testing set from his/her GMVs. After repeating the LOO procedure for each participant, we assessed predictive power by calculating the Pearson’s correlation between observed and predicted subtraction skills. A similar procedure was used for the multiplication predictive model.

Step 1: we extracted GMV of each region of interest (ROI) in Destrieux atlas. The Destrieux atlas includes 148 ROI. Based on GMV data from 130 children, a GMV matrix of size 130 by 148 was constructed. Step 2: one participant was left out on each LOO iteration as the testing set, and the remaining participants were regarded as the training set. Partial correlations were calculated between the GMV of each ROI and the arithmetic skills, while controlling for age and estimated total intracranial vol (eTIV). The significantly arithmetic-correlated ROIs (P < 0.01) were included in a spatial profile to build the predictive model. Step 3: a multivariate linear regression model was trained to relate the GMV of each ROI to the arithmetic skills based on selected ROIs. Step 4: The model was applied to novel subjects in left-out participants to assess the generalizability.
For both the subtraction and multiplication predictive model, the correlation between observed and predicted scores was significant (subtraction: r = 0.3506, P = 4.32 × 10⁻⁶; multiplication: r = 0.2824, P = 0.0011, Fig. 2a, b). Further, the reliability of both models was confirmed by two permutation testing approaches9,33. The first approach compared the observed correlations to those between fixed predicted arithmetic scores and randomly shuffled arithmetic observations (subtraction: Pperm = 0.0001; multiplication: Pperm = 0.0006). The second approach assigns randomly shuffled arithmetic observations to each subject and re-constructs the LOOCV predictive model to calculate the null distribution and compares it with the observed correlations (subtraction: Pperm = 0.001; multiplication: Pperm = 0.025). These results suggests that our predictive models could serve as reliable structural neuromarkers to predict the arithmetic performance of novel individuals.
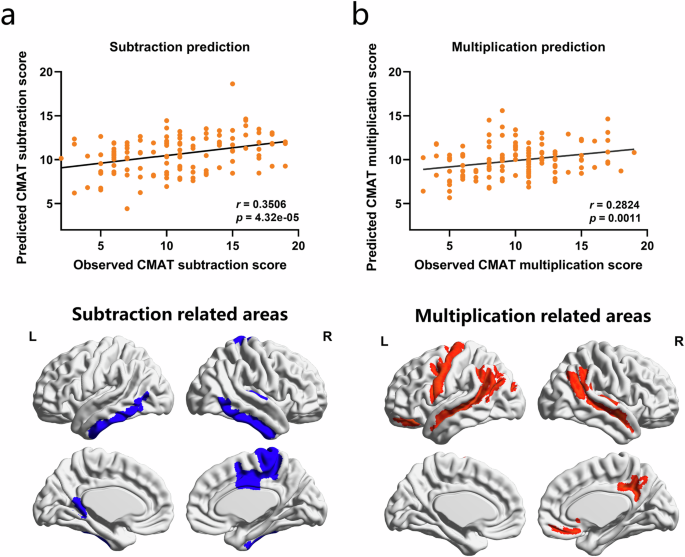
GMV-based predictive model predicted individual difference of subtraction (a) and multiplication (b) scores. Scatter plots show correlations between the observed arithmetic scores and predictions obtained using GMV-based predictive model (top panel). The predictive models were iteratively trained on behavior and MRI data from n–1 participants and tested on the left-out participant. The values r and P on each plot are the Pearson’s correlation coefficient between observed and predicted arithmetic scores and the corresponding significance level, respectively. Bottom panel shows brain areas related to individual difference of subtraction and multiplication. These brain areas were determined according to non-zero weights in the corresponding gray matter volume based predictive model.
In the subtraction predictive model, the brain areas related to individual difference of subtraction involved cingulate cortex (left ventral part of the cingulate gyrus, right posterior part of the cingulate gyrus and sulcus and right marginal branch of the cingulate sulcus), temporal cortex (bilateral inferior temporal gyrus, right anterior transverse collateral sulcus and right transverse temporal sulcus) and motor cortex (right paracentral lobule and sulcus). In the multiplication predictive model, the brain areas related to individual difference of multiplication involved motor cortex (left precentral gyrus and left inferior part of the precentral sulcus), occipital cortex (left superior occipital sulcus and transverse occipital sulcus), frontal cortex (left orbital sulci and right suborbital sulcus), temporal cortex (bilateral superior temporal gyrus and right transverse temporal sulcus) and parietal cortex (right subparietal sulcus). These brain areas were determined according to non-zero weights in the corresponding GMV-based predictive model (Fig. 2 bottom panel).
The IPS and AG have received extensive attention in the study of arithmetic calculations6,7,13,14, but were not included in the predictive models mentioned above. To compare the effects of including multiplication (subtraction) ability as a control variable, we removed the multiplication (subtraction) ability from the control variables and reconstructed the subtraction (multiplication) predictive model. We found that the subtraction predictive model had significant prediction performance (r = 0.3231; the first permutation testing approach: Pperm = 0.0001; the second permutation testing approach: Pperm = 0.007) and involved the left IPS. The multiplication predictive model had significant prediction performance (r = 0.3304; the first permutation testing approach: Pperm = 0.0001; the second permutation testing approach: Pperm = 0.006) and involved the right AG (Supplementary Fig. 2). The subtractive prediction model and the multiplicative prediction model involve a large amount of overlap in the brain areas, including 9 brain regions.
The output of the predictive model correlates with visuospatial WM
We further investigated whether the output of arithmetic-related predictive models constructed above correlates with other cognitive functions, such as WM (Table 2). The results of this analysis revealed that the predicted scores of subtraction predictive models were significantly correlated with the subtests scores in visuospatial WM (Dot Matrix: r = 0.2178, P = 0.0155, Spatial Recall: r = 0.3100, P = 0.0005). However, there was no significant correlation between the predicted scores of the subtraction predictive model and the scores of verbal WM (Table 2). The multiplication predictive model also showed similar correlation relationships. The significantly correlations were found between predicted scores of multiplication predictive models were significantly correlated with the subtests scores in visuospatial WM (Dot Matrix: r = 0.3216, P = 0.0002, Spatial Recall: r = 0.3664, P = 3.067 × 10⁻⁵). There was also no significant correlation between the predicted scores of the multiplication predictive model and the scores of listening recall task. However, the correlation between the predicted scores of the multiplication predictive model and the scores of digit recall task is significant (Digit Recall: r = 0.1932, P = 0.0323).
Considering the correlation of the predictive model output and visuospatial WM, we also constructed a GMV-based predictive model for visuospatial WM ability (measured with the spatial recall subtest of the AWMA-S; see also Supplementary Results and Supplementary Fig. 5). The steps for constructing the visuospatial WM predictive model are the same as those for constructing the arithmetic predictive model, and the covariates in the correlation analysis are age, gender and eTIV. For the visuospatial-WM predictive model, the correlation between observed and predicted scores was significant (r = 0.3435, the first permutation testing approach: Pperm = 0.0001; the second permutation testing approach: Pperm = 0.001; Supplementary Fig. 3a). In addition, the visuospatial WM predictive model also involves widely distributed brain regions (Supplementary Fig. 3b). The multiplication predictive model and the visuospatial WM predictive model involve overlapping brain regions, including bilateral superior temporal sulcus, left superior occipital sulcus and transverse occipital sulcus and right transverse temporal sulcus. The subtraction predictive model and the visuospatial WM predictive model involve overlapping brain regions, including right inferior temporal gyrus, right marginal branch of the cingulate sulcus and right transverse temporal sulcus.
Relationship between the structural pattern of arithmetic ability and gene expressional profile
We then explored the spatial association between gene transcriptional profiles and the structural patterns of arithmetic abilities. For each gene, we estimated the spatial similarity between its transcriptional profile and the arithmetic structural pattern by calculating the Pearson’s correlation coefficient across subtraction-related or multiplication-related ROIs. For subtraction, a total of 570 genes were identified as showing a significant positive correlation (p < 0.05, r > 0). For multiplication, a total of 212 genes were identified as showing a significant positive correlation (p < 0.05, r > 0).
To explore the functional significance of those genes that showed positive correlation, we performed a gene ontology annotation analysis using the ToppGene Suite (https://toppgene.cchmc.org). Significant enrichment of biological processes (FDR-corrected p < 0.05) that were associated with positively correlated genes in the subtraction and multiplication tasks were shown in Fig. 3a, b, respectively. For subtraction, the most significant enrichment of biological processes associated with positively correlated genes primarily involved transmembrane transport (inorganic ion transmembrane transport, inorganic cation transmembrane transport and regulation of transmembrane transport). For multiplication, the most significant enrichment of biological processes associated with positively correlated genes involved synaptic signaling. The details of these biological processes (FDR-corrected p < 0.05) were shown in Supplementary Table 1 (subtraction) and Supplementary Table 2 (multiplication).
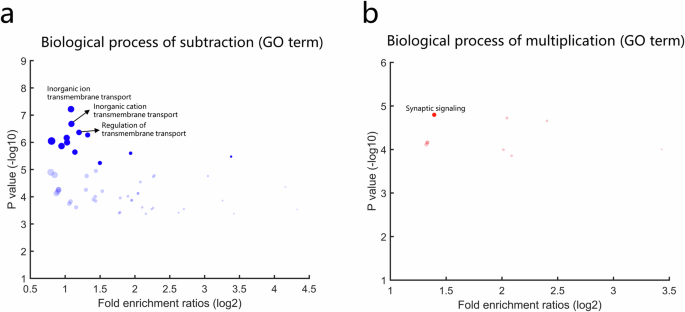
Gene ontology (GO) terms of biological processes associated with genes showing significant positive correlations (P < 0.05) with structural patterns of subtraction (a) and multiplication (b) related ROIs. Solid dots represent GO terms obtained by correction for multiple comparisons (Bonferroni-corrected P < 0.05) and the translucent dots represent GO terms obtained with FDR multiple comparisons (FDR-corrected P < 0.05). Dots marked with text represent GO terms with the top four high significance. The dot size represents the number of genes that overlap with the corresponding GO term.
Further, we used the same procedure to select a set of genes associated with the brain structural pattern of visuospatial WM (measured with the spatial recall subtest of the AWMA-S). A total of 240 genes were identified as showing a significant positive correlation (p < 0.05, r > 0) with the structural pattern of visuospatial WM. The most significant enrichment of biological processes associated with positively correlated genes primarily involved histone modification (histone H4-K16 acetylation and positive regulation of histone methylation, Supplementary Fig. 4). The details of these biological processes (FDR-corrected p < 0.05) were shown in Supplementary Table 3.
Discussion
In the present study, we used subtraction and multiplication performances and structural MRI scans of childhood and adolescence participants to construct a structural predictive model to predict individual differences in arithmetic abilities. This structural predictive model can predict individual arithmetic abilities and also has a significant correlation with visuospatial WM performance. The predictive models of subtraction and multiplication abilities both consisted of widespread cortical regions. The brain regions involved in the predictive models of subtraction and multiplication overlap with those involved in the predictive model of visuospatial WM, suggesting that arithmetic ability may share a neural basis with visuospatial WM. Furthermore, we demonstrated a relationship between structural patterns of arithmetic abilities and gene expression profiles. Specifically, structural patterns of arithmetic ability primarily correlated with transcriptional profiles enriched for genes involved in transmembrane transport and synaptic signaling. Collectively, these findings not only demonstrated the relationship between distributed GMV and arithmetic ability but also enhanced our understanding of the genetic mechanisms underlying individual differences in children’s arithmetic ability.
These predictive model networks were constructed based on a cross-validation framework, which was inspired by the CPM approach, a strategy widely used in recent years to predict individual differences in human cognitive abilities based on brain functional/structural features32,33,34,35,36,40. A previous study used a connectome prediction model to predict children’s math skills using task-based and resting-based functional connectivity41. In present study, we explored the neural structural characteristics related to arithmetic ability. Unlike the traditional statistical methods for establishing brain-behavior relationships (such as correlation or simple regression) that may overfit the data and fail to generalize to new data, our analysis employed a data-driven cross-validation approach to remove spurious effects37. More importantly, unlike classic regional-level studies or whole-brain-level search methods, the predictive models in present study does not search brain regions related to arithmetic ability in isolation, but explores whether individual differences in arithmetic ability can be embedded in the entire set of brain regions. The cross-validation-based predictive model was a promising approach to identify reliable neuroimaging-based biomarkers of arithmetic ability in children and adolescents. The ability of these in-dataset cross-validation results underscored the robustness of these predictive models in predicting individual differences in arithmetic ability.
The predictive models of subtraction and multiplication abilities both consisted of widespread brain regions but overlapped in only one region. In order to obtain the brain areas specific to each arithmetic ability, when constructing the subtraction predictive model, the multiplication scores was added to the set of control variables, and vice versa. Therefore, brain regions that are jointly related to subtraction and multiplication were not included in the predictive model. For comparison, we removed the subtraction (multiplication) ability from the control variables and reconstructed the predictive model. The subtraction predictive model included the left IPS, and the multiplication predictive model included the right AG, which is consistent with the fact that subtraction calculations rely on counting, and multiplication calculations rely on fact retrieval14,16. Most of previous literatures suggest that activation of the left AG during arithmetic processing is associated with the use of fact-retrieval strategies42,43,44. However, several studies have also found that multiplication had greater activation than subtraction in the right AG, but not left AG14,16. This finding suggests there may be heterogeneity in the AG and some ambiguity about the role of the left versus right AG (see also Supplementary Results and Supplementary Fig. 6). The two control models involved a total of 9 shared brain regions, which also indicates that the control variables exclude shared brain regions between subtraction and multiplication from predictive models.
One of the main differences is that the subtraction predictive model involves bilateral inferior temporal gyrus, whereas the multiplication predictive model involves bilateral superior temporal gyrus. The possible reason is that retrieval is the dominant method for multiplication, whereas subtraction rely more on counting16,45. Several researches suggest that the superior temporal gyrus plays a crucial role in memory retrieval46,47, which contributes to the completion of multiplication calculations. Multiplications activated more verbal mechanisms, as compared with subtractions6. The GMV study found that the GMV of the superior temporal gyrus has a positive correlation with reading ability48. Based on fMRI study, the superior temporal gyrus was found to be activated during phonological tasks and is considered to be involved in verbal representation in long-term memory49. In addition, the inferior temporal gyrus, as the last stage of the ventral “what” visual pathway, is primarily involved in visual processing, object recognition, and representation50, which play a key role in number recognition. An intracranial electroencephalography (iEEG) study has confirmed the existence of a region in the inferior temporal gyrus that selectively activates during visual identification of Arabic numerals51. Number recognition ability plays a key role in initial number sense development, including a basic understanding of composition and decomposition, which appears to be a critical foundation for mastery with fluency of basic subtraction operation. Another important difference is that the subtraction predictive model involves ventral part of the cingulate gyrus and posterior part of the cingulate gyrus, but the multiplication predictive model does not. Compared with multiplication, subtraction is unique in that multiplication does not engage mental number line based procedures, but subtraction does6. Recognizing the size of numbers is associated with spatial shifts of attention52. Previous fMRI study shows that the posterior cingulate gyrus is associated with the anticipatory allocation of spatial attention53. This may be why the posterior cingulate gyrus appears in subtraction predictive models, but not in multiplication predictive models. Electrophysiological studies have shown that neurons in ventral cingulate gyrus excited during mental counting backwards tasks54, suggesting that it may play a role in the subtraction calculation task. Study has also shown that the posterior cingulate gyrus metabolism was significant correlated with correct responses to the mental calculation tasks (serial number subtraction)55, suggesting a close relationship between the posterior cingulate gyrus and the mental subtraction process.
Further, we found that the output of arithmetic-related predictive model correlates with the performance of visuospatial WM. In addition, the brain areas involved in the predictive models of subtraction and multiplication overlap with those involved in the predictive model of visuospatial WM. These results are consistent with many of previous findings. Previous studies have reported that visuospatial WM is an important domain-general cognitive process in both typical and atypical mathematical skill development56,57,58, which can be evidenced by the finding that children with mathematical disabilities (MD) did not use visuospatial WM resources appropriately during arithmetic problem solving56. Task-based fMRI study also shows that shared neural circuits are activated when children perform visuospatial WM and arithmetic tasks59. In particular, the multiplication predictive model can predict the performance of digit recall task, but the subtraction predictive model cannot. This may be because, compared to subtraction, multiplication relies more on retrieving solutions from long-term digit-related memory rather than direct quantity comparisons15,31. Compared with visuospatial WM, the correlation between the output of arithmetic-related predictive models and verbal WM is relatively poor. This may be because visuospatial WM is used in arithmetic tasks across a wider age range than verbal WM. Younger children have been found to predominantly rely on visuospatial WM to solve arithmetic problems60, whereas older children and adults use both verbal WM and visuospatial WM61. Overall, our results suggest that individual differences in arithmetic ability and visuospatial WM may have a shared neural basis.
By performing a neuroimaging-transcriptome association analysis, we obtained transcriptional profiles associated with subtraction- (or multiplication-) related structural patterns. We demonstrated that the structural pattern associated with subtraction ability primarily correlated with transcriptional profiles involved in transmembrane transport. Ion transmembrane transport is closely related to the generation and transmission of neural signals62, as well as synaptic plasticity63. The transmembrane flow of ions causes changes in the intracellular ion concentration of neurons, resulting in changes in the strength of synapses. This synaptic plasticity is considered to be the cellular basis of neural functions such as cognition, learning and memory63. Further, we demonstrated that the structural pattern associated with multiplication ability primarily correlated with transcriptional profiles involved in synaptic signaling. The precise pattern of synaptic connections formed during development is critical for establishing and refining neural circuits relevant to cognitive function64. Synaptic signaling plays a key role in this process, as it allows neurons to communicate with each other and form new connections based on patterns of activity65. Disruption of synaptic signaling pathways leads to cognitive deficits66.
In addition, we also demonstrated that the structural pattern associated with visuospatial WM primarily correlated with transcriptional profiles involved in histone modification (histone H4-K16 acetylation and positive regulation of histone methylation). Consistently, previous studies have shown that histone acetylation and positive regulation of histone methylation are associated with memory formation and consolidation67,68. For instance, spatial memory could induce histone acetylation in the rodent hippocampus67,69. Histone acetylation is critical for synaptic plasticity and memory formation67. Normal aging-related memory impairment is associated with the lack of histone H4 acetylation70. In addition, histone methylation is actively regulated in the hippocampus and facilitates memory formation68. Animal experiments also implicate histone methylation as a potential positive regulator of gene transcription in memory consolidation68. This consistency further illustrates the reliability of our findings revealed by the neuro-transcriptomics approach adopted in our study.
The present study had limitations. First, since the spatial patterns of absolute gene expression levels do not appear to change greatly after birth71, gene expression data from adult donors may not have a large impact on our findings. In future studies, we would still like to use gene expression data from children to validate our findings. Second, the current study uses out-of-scanner subtraction and multiplication tests that involve a broader set of rational numbers (fractions and decimals). Increasing complexity of computational problems may reduce the differentiation of computational strategies between subtraction and multiplication. Although we adopted a modeling approach that uses other arithmetic abilities as control variables, we cannot guarantee that the homogenization effect caused by the increase in computational complexity can be completely eliminated. More ideally, we hope to verify the findings of the present study in future studies based entirely on single-digit subtraction and multiplication tasks.
In the present study, our findings suggest an applicable neuroimaging-based biomarker of arithmetic ability and increases our understanding of the neural and genetic mechanisms underlying arithmetic ability. Because abnormal GMV is associated with dyscalculia disease72, it is necessary to validate our predictive model on disease data to help early diagnosis in future study.
Methods
Overview
The dataset used for the current analyses was obtained from ref. 28 and is publicly available. This dataset includes structural MRI and behavioral data from childhood and adolescence, which we used to investigate the relationship between GMV and arithmetic ability, and to perform neuroimaging-transcriptome association analyses. First, we extracted the GMV of each ROI in Destrieux atlas73 for each child from a public arithmetic processing dataset74. Then, we constructed a multiple linear predictive model based on GMV information and quantified the reliability of the model using a Leave-one-out (LOO) procedure (Fig. 1). Based on the brain regions involved in the predictive model, the arithmetic structural patterns were calculated. To investigate whether there is a sharing structural basis between arithmetic ability and WM, we first calculated the correlations between the output of the predictive model of arithmetic ability and WM abilities, and further examined the overlap of brain regions involved in the predictive models of arithmetic ability and the predictive model of WM. Finally, we extracted brain-wide gene expression profile using the Allen Human Brain Atlas (http://human.brain-map.org/)75, and applied a correlation analysis to measure the spatial similarity between arithmetic structural patterns and gene expression profiles (Supplementary Fig. 1).
Participants
In the public arithmetic processing dataset, deposited in OpenNeuro (https://openneuro.org/datasets/ds001486/), 132 students in grades 3 to 8 (mean age, 11.26 years; standard deviation (SD), 1.46 years; range, 8–15 years, 62 males) were recruited from schools in the Chicago metropolitan area. In fact, the OpenNeuro dataset is longitudinal and contains behavioral and imaging data measured twice, with an interval of ~2 years, allowing analysis of developmental changes. In this study, we conducted a cross-sectional study using the first collected data (ses-T1). A detailed description of the dataset is provided in a previous study74. Several studies have been conducted based on this dataset15,76,77. None of these studies focused on data-driven predictive models of arithmetic skills with a cross-validated framework and related gene expression information, which constituted the aims of this study.
All of the subjects were right-handed, native English speakers, and free of any neurological conditions including epilepsy, attention deficit hyperactivity disorder, or neurological diseases. None of the participants, according to parental reports, had any hearing impairments, uncorrected visual impairments, premature births (less than 36 weeks), were taking medication that affected the central nervous system, or had any other conditions that would have made them unfit for a MRI scan, such as braces. The participants all received a standard score of 85 or above on the Wechsler Abbreviated Scale of Intelligence-WASI full IQ scale, and none of them had a history of intellectual impairment. All experimental procedures were approved by the Northwestern University Institutional Review Board. Parental consents were obtained in minors participating in the study. The present study was approved by the Anhui Medical University Ethics Committee (approval ID: 2023094).
Behavioral Tests
Arithmetic skill: subtraction performance
The subtraction subtest of CMAT was utilized to assess subtraction abilities78. This untimed test consists of 23 subtraction problems to be solved on paper with a pencil. It includes single-digit subtractions, multi-digit subtractions, decimal subtractions, and fractional subtractions of varying difficulty. This test was given outside of the scanner. Standardized scores of this test were used to assess subtraction ability.
Arithmetic skill: multiplication performance
The multiplication subtest of CMAT was utilized to assess multiplication abilities. This untimed test consists of 26 multiplication problems to be solved on paper with a pencil. It includes single-digit multiplications, multi-digit multiplications, decimal multiplications, and fractional multiplications of varying difficulty. This test was given outside of the scanner. Standardized scores of this test were used to assess multiplication ability.
Verbal working memory
The digital recall and listening recall subtests of the AWMA were used to assess verbal WM79. The digit recall began with a block of one digit and increased to a block of nine digits. A participant should immediately recall each of the presented sequences in the correct order. The listening recall subtest requires the simultaneous storage and processing of verbal information. It requires children to determine whether a sentence is true or false, such as “Bananas live in water,” as well as remember the sentence’s final word, “water”. As children progress through the test, the number of sentences per item increases, increasing the number of final words they must remember to retrieve later.
Visuospatial working memory
The dot matrix and spatial recall subtest of the AWMA were used to assess visuospatial WM79. In the dot matrix subtest, a participant was shown the sequential positions of a red dot in a 4 × 4 squared matrix (the red dot sequentially appeared in different positions of a blank squared matrix), and at the end of the block he or she should tap all those squares (positions) on the blank matrix in exactly same order as the red dot was presented. The subtest started with a 1-dot block and increased to a 9-dots block. In spatial recall test, children view pictures of two shapes where the shape on the right has a red dot near it and they must determine whether the shape on the right is the same as the shape on the left when rotated in two dimensions, or if it is the mirror image. At the end of the trial, individuals are asked to remember the position of the red dot and to respond by pointing to a picture with three possible positions marked. As the children progress through the test, the number of shape pairs to be compared increases, and participants must recall the correct position of all the red dots in the correct temporal order.
Standardized scores of these four tests were used as the measures of WM ability.
MRI data acquisition and pre-processing
Images were collected using a Siemens 3 T TIM Trio MRI scanner (Siemens Healthcare, Erlangen, Germany) at CAMRI, Northwestern University’s Center for Advanced MRI. A high resolution T1 weighted 3D structural image was acquired for each participant, with the following parameters: TR = 2300 ms, TE = 3.36 ms, matrix size = 256 × 256, field of view = 240 mm, slice thickness = 1 mm, number of slices = 160.
Image postprocessing was performed using a fully automated set of tools available in the FreeSurfer software suite (http://surfer.nmr.mgh.harvard.edu/). The surface based cortical reconstruction and subcortical volumetric segmentation procedures are documented in detail elsewhere80. In brief, preprocessing included intensity normalization, removal of nonbrain tissue, transformation to MNI space, segmentation of gray-white matter tissue, and tessellation and smoothing of the gray-white matter boundary. Based on the Destrieux atlas, the cortical surface was divided into 148 regions73. The “recon-all” pipeline in FreeSurfer was used to calculate the GMVs of each ROIs in Destrieux atlas. The entire cortex of each child was visually inspected, and misalignment was manually checked and removed. Two children were removed for wrong cortical surface locations (apparently false location of gray matter surface and pial surface), and data from the remaining 130 children were used for subsequent analysis.
Construction of GMV-based predictive model
Inspired by the CPM approach, a strategy widely used in recent years to predict individual differences in human cognitive abilities based on brain structural/functional patterns9,32,33,34,35,36, we developed GMV-based predictive models separately for subtraction and multiplication performance. Different from classic regional-level studies, CPM-inspired methods enable a data-driven exploration of entire GMV patterns in subtraction/multiplication related brain regions which can predict individual differences in subtraction/multiplication ability. Taking building a subtraction predictive model as an example, one participant was left out on each LOO iteration as the testing set, and the remaining participants were regarded as the training set. To select out brain regions specifically associated with subtraction ability, partial correlations were calculated between the GMV of each ROI and the subtraction performance, while controlling for age, gender, eTIV and multiplication performance. For each LOO iteration in the training set, the ROI demonstrating significant correlation (P < 0.01) across participants were included in a feature set to build the predictive model. A GLM was fit to relate the GMV of each ROI within the feature set to the subtraction skills across all participants, with age, gender, and eTIV as covariates. Subsequently, this GLM was used to obtain the predicted subtraction performance of the left-out participant in the testing set from his/her GMVs. After the LOO procedure was repeated iteratively for each participant, we calculated the Pearson’s correlation coefficient between the observed and predicted subtraction skills across all participants to evaluate the predictive power. We followed the similar procedure when building the multiplication predictive model. It should be noted that in the partial correlation calculation of the multiplication predictive model, age, gender, eTIV and subtraction performance are controlled.
To confirm the reliability of the prediction results, we used two permutation testing approaches reported in CPM studies9,33. In the first approach, the observed subtraction or multiplication scores were shuffled across participants 10,000 times and calculated the Pearson’s correlations with the corresponding predicted scores. The number of times that a correlation coefficient in the set of 10,000 permutation tests outperformed the correlation coefficient from the predictive models was recorded and divided by 10,000 to obtain the permutation testing probability for statistical evaluation. In the second approach, randomly shuffled (behavioral) arithmetic observations were assigned to each subject, and the LOOCV predictive model was reconstructed33. Pearson correlations between predicted and observed (randomly shuffled) arithmetic observations were calculated to construct null distribution, which was used to derive p values. Due to computational cost, we set the permutation number of the second approach to 1000.
Considering that the selected ROIs varied slightly across the iterations, to obtain a unified set of ROIs, we included brain regions selected in at least one iteration of the subtraction predictive model or the multiplication predictive model, respectively.
The correlation between predictive model output and WM
To evaluated the correlation between predictive model output and WM, we calculated Pearson’s correlation coefficients between the predicted scores of each arithmetic subtest (subtraction and multiplication) and the behavioral performance on WM.
Gene expression profiles: Allen Human Brain Atlas
To assess the gene expression profiles, we introduced brain-wide gene expression data publicly available from the Allen Human Brain Atlas (http://human.brain-map.org/)75. Samples from two donors cover the whole brain. Of note, we used postmortem gene expression data from adult donors obtained from the Allen Human Brain Atlas to explore the relationship between gene expression and the brain structural patterns of arithmetic ability in children. Our predictive models were built on children’s structural MRI data. Although the absolute expression levels of genes may change with age due to developmental effects, their spatial patterns do not appear to change greatly after birth71. Therefore, gene expression data from adult donors may not have a large impact on our findings.
To map postmortem data into the same space as the MRI data, followed a previous study29, we carried out the following procedures. First, we removed samples located in the brain stem and cerebellum, and re-annotated the gene names of probes for the remaining 2,748 samples. Second, to discriminate expression signal from noise in the microarray, we used the intensity-based filtering method to filter the data29. For each gene, its expression level in a given sample was obtained by averaging the expression values across all detecting probes. Next, to minimize the influence of outliers, we normalized the expression data using the scaled robust sigmoid algorithm81. To obtain gene expression data at the brain region level, we matched the MNI coordinates of each sample to the Destrieux parcellations using the nearest-point search algorithm29. Each sample was then assigned to one of the brain regions. For each region, expression data for each gene was obtained by first averaging the data across samples from the same donor, and then averaging the nodal expression data across donors. Using this process, for each region, we obtained gene expression data for 15,745 genes. We performed subsequent spatial correlation analysis between brain structural patterns and gene expression profiles using samples from two donors whose gene expression data covered the entire brain.
Relationship between the structural pattern of arithmetic ability and gene expression profile
Taking subtraction as an example, to present the structural pattern of arithmetic subtraction ability, we calculated the partial correlation between arithmetic ability and GMV of each brain regions involved in arithmetic predictive model, while controlling for age, gender and eTIV. In the previous ROI selection step of predictive model, we have already eliminated the effects shared by subtraction and multiplication by using multiplication ability as a control variable. Now when calculating the structural pattern of subtraction ability, multiplication ability is not repeatedly used as a control variable. After the partial correlation calculation is completed, each brain region obtains a partial correlation coefficient r, which represents the contribution of the GMV of this brain region to individual differences in arithmetic ability. The r values of all brain regions involved in the predictive model constitute the structural pattern of subtraction ability. We followed the similar procedure when calculating the structural pattern of multiplication ability.
To examine whether the spatial inhomogeneity in arithmetic structural patterns was associated with gene expression levels, we performed a spatial similarity analysis across the arithmetic-related brain regions. For each of the 15,745 genes, we undertook a Pearson’s correlation analyses to measure the spatial similarity between gene expression profile and the structural pattern of arithmetic ability. Genes demonstrating significant positive correlation (r > 0, P < 0.05) were selected and applied functional enrichment analyses using the ToppGene Suite (https://toppgene.cchmc.org/)82.


Responses