Structural basis for intrinsic strand displacement activity of mitochondrial DNA polymerase
Introduction
During replication of double-stranded DNA genomes, DNA polymerase (DNAP) copies the parent strand of DNA while displacing the non-coding strand. In many genetic systems, this process, known as strand-displacement DNA synthesis, is aided by a dedicated replicative helicase1,2,3. However, some DNAPs, such as the Pol B family bacteriophage DNAP Phi29 and the Pol A family DNAP I from the bacterium Geobacillus stearothermophilus (BST polymerase), possess intrinsic strand displacement activity and require no auxiliary factors4,5,6,7. Understanding the mechanism behind this intrinsic activity is of broad interest, with potential applications in the development of therapeutic strategies for genetic diseases and in the design of DNA amplification and diagnostic tools8,9,10.
Strand-displacing DNAPs are central to advanced DNA amplification techniques, such as rolling circle and isothermal DNA amplification. These methods are fast, simple, and cost-effective, requiring no thermal cycling and making them particularly suitable for field diagnostics and point-of-care applications11. They are increasingly used in resource-limited settings for tasks like diagnostics, genetic testing, and environmental monitoring, due to their ability to rapidly generate high yields of DNA12. However, despite their wide applications, the molecular basis for intrinsic strand displacement activity remains unclear, as surprisingly, no high-resolution structures of strand displacing DNAPs containing a downstream DNA duplex have been obtained thus far. Early structural findings with Pol B family DNAP Phi29 suggested that a narrow channel connecting the active site with the downstream DNA that would only fit a template strand is a pre-requisite for strand displacement activity13. However, in the Pol A family of DNAPs, the region near the strand separation site involves structurally distinct elements, and the basis for their intrinsic strand displacement activity remains unknown1,14.
To provide insights into the mechanism of intrinsic strand displacement activity, we used a single-subunit Pol A family DNAP from yeast Saccharomyces cerevisiae mitochondria, Mip1, for which no previous structural information was available. Mip1, an ortholog of human mitochondrial DNAP Polγ, possesses both polymerization and 3’ to 5’ exonuclease catalytic domains and is the major driving force of mtDNA replication in yeast mitochondria15,16,17,18,19,20. While Mip1 lacks the homodimeric Polγ-B subunit present in human Polγ, the catalytic subunits of these enzymes share significant sequence homology14,15. A notable difference between these subunits is the extended C-terminal region of MIP1, comprising approximately 200 amino acids. This region is critical for maintaining processivity and is essential for cell viability21. Unlike its human counterpart, which critically depends on replicative helicase, TWINKLE, Mip1 does not require an auxiliary factor for DNA strand separation22,23. Our structural data, combined with in vitro and in vivo analyses, provide the first glimpse of the strand displacement process at the molecular level. We reveal key structural elements in Mip1 that facilitate strand displacement, shedding light on the intrinsic strand displacement mechanisms in this class of polymerases and offering new insights into why other members of the Pol A family rely on helicases for replication.
Results
The overall structure of the Mip1-DNA complexes
We used a single-subunit DNAP from yeast mitochondria, Mip1, to assemble the complex on a primer-template construct with a 20 bp downstream DNA duplex (Fig. 1A, B). Mip1 was allowed to incorporate 4 nucleotides in the presence of dGTP, dATP, and a chain-terminating nucleotide ddTTP, to extend the primer and to force the melting of downstream DNA (Fig. 1B). This complex has been studied by cryogenic electron microscopy (cryo-EM), and a dataset was collected and processed using single-particle analysis (Supplementary Figs. 1–5).

A A schematic representation of the domain organization of Mip1 and its key structural elements. B Assembly of the strand displacement complex. The DNA template strand (here and throughout) is shown in blue, the primer in red, and the non-template strand in cyan. The incoming nucleotide is in yellow. C The cryo-EM density map of Mip1 (Structure I). D–G De novo models of Mip1 (Structures I-IV). Important structural elements involved in strand separation are highlighted. Fingers – pink, exonuclease domain – light yellow, thumb – orange, catcher loop – wheat, SD-loop – magenta, wedge helix – teal, joist– slate. H Downstream DNA bending by Mip1 during strand separation.
To improve the resolution of substrate-bound complexes, 3D variability analysis was used (see Methods), resulting in four major clusters (Supplementary Fig. 1) and four corresponding high-resolution structures. The subsequent de novo modeling led to structures ranging from 2.4 to 3.0 Å resolution (Fig. 1C–G, Supplementary Figs. 2, 3, Supplementary Tables 1, 2). In these structures, the 3’ end of the primer is positioned in the enzyme’s polymerization (pol) site, which also accommodates a bound incoming nucleotide, dATP. The major differences between the obtained structural conformations of Mip1 involve the bending of the downstream DNA duplex relative to the primer-template duplex, the extent of downstream DNA melting, and the engagement of structural elements responsible for the enzyme’s intrinsic strand displacement activity, as described below (Fig. 1D–H). In Structure I (Fig. 1D), all DNA bases in the downstream template strand are paired with their counterparts in the non-template strand. In Structure II, the template n + 1 DNA base lacks its complementary base in the non-template strand (gap 1), suggesting that this Mip1 conformation represents the initial melting of the downstream DNA duplex by 1 bp (Fig. 1E). In Structure III, the melting region is still 1 bp, however, the initial bending of the downstream DNA decreases from ~80o to 121o (Fig. 1F, H). Finally, in Structure IV, the downstream DNA is bent at 116 o, and the unwound region is propagated to 3 bp (Fig. 1G, H).
Mip1 possesses a characteristic right-hand shape of the Pol A family of DNAPs (Fig. 2A, C). The regions accommodating downstream DNA duplex and primer-template form two prominent positively charged clefts on the Mip1 surface (Fig. 2A). The enzyme forms many hydrogen bonds with the phosphate backbone of the DNA, stabilizing 20 bp of the primer-template duplex and 8 bp of downstream DNA (Fig. 2B).

A Mip1 surface charge distribution. B Schematic representation of Mip1-DNA interactions in Structure I. Residues are color-coded to match the corresponding structural elements. Non-template and template DNA bases, for which density is missing in Cryo-EM maps, are shaded. Polγ residues corresponding to the key residues of Mip1 involved in strand displacement are shown in parentheses. C Structural comparison of Mip1 (Structure I) with human Polγ-A. The enzymes are aligned using their conserved palm domain. The Catcher loop in human Polγ is modeled using AlphaFold3. D Major interactions of Mip1 with DNA. E A close-up view of the pol active site of Mip1 shown with Coulombic density (blue mesh). The incoming nucleotide, dATP, is in yellow.
The catalytic subunits of Mip1 and Polγ share high structural homology (Fig. 2C). The major difference between Mip1 and Polγ-A involves the presence of an extended C-terminal domain in Mip1 (not resolved in our cryo-EM maps), a structure supporting the primer-template duplex, called “Joist,” and a β-hairpin loop engaged in downstream DNA binding, termed Catcher loop (Fig. 2C, D). In Mip1, Joist is stabilizing approximately 15 bp of the upstream DNA duplex (Fig. 2B). In human Polγ, besides providing the DNA interaction interface, Joist is sharply bent and serves as a binding site for Polγ-B homodimer (Fig. 2C, right panel). The positively charged residues of the Catcher loop (res 794–803) are engaged in interactions with the template strand of the downstream DNA in Structure I-III, and both template and non-template strands in Structures IV (Fig. 2D). A more extended Catcher loop is present in Polγ, however, it has never been fully resolved, and its function remains unknown (Fig. 2C).
The thumb subdomain of Mip1, similar to those in other Pol A family DNAPs, consists of two α helices connected by regions of variable lengths and structure (Supplementary Fig. 6). In both Mip1 and Polγ, these helices exhibit high structural similarity and are separated by a large intrinsic processivity (IP) subdomain15, spanning 165 amino acids in Mip1 and 310 amino acids in Polγ. This IP subdomain contains the Joist and a flexible element known as the Guide loop, which, in human Polγ, plays a role in the proofreading mechanism16 (Fig. 2C and Supplementary Fig. 6).
The pol site of Mip1 has a high sequence and structural homology to Polγ-A (Fig. 2E). All four Mip1 structures have similar conformation of the active site. The acceptor n DNA base is in the catalytic site, base-paired with the incoming dATP, indicating that the obtained Mip1 complexes represent the post-translocated states of the nucleotide addition cycle. The fingers domain of Mip1 is in “closed” conformation, as evident by the positioning of the O and Y helices in close proximity to the DNA, and the movement of the conserved tyrosine residue, Y757, away from its typical stacking position with the n base of the template DNA (Fig. 2E). Mip1 exhibits high structural conservation in its pol site region with other members of the Pol A family of polymerases, including Polγ, T7, and Taq DNA polymerases (Supplementary Fig. 7).
Initial melting of the downstream DNA duplex
Structures I and II provide a detailed view of the mechanics of the initial strand displacement process (Fig. 3A, B, Supplementary Fig. 5). In Structure I, the downstream DNA duplex is completely base-paired, representing a pre-melted state (“zero gap”) of DNA strand separation (Fig. 3A). The acceptor n base of the template strand interacts with the incoming substrate, while the n + 1 is base-paired with its counterpart in the non-template strand of DNA. The single-stranded portion of the non-template strand, from the base n-7 to the base n, is invisible in cryo-EM maps, suggesting that the path of the displaced strand is not stabilized by Mip1 interactions. The template strand of DNA is sharply bent between the n and n + 1 base, making a ~ 93o angle between the downstream DNA and the primer-template duplex (Fig. 3A).
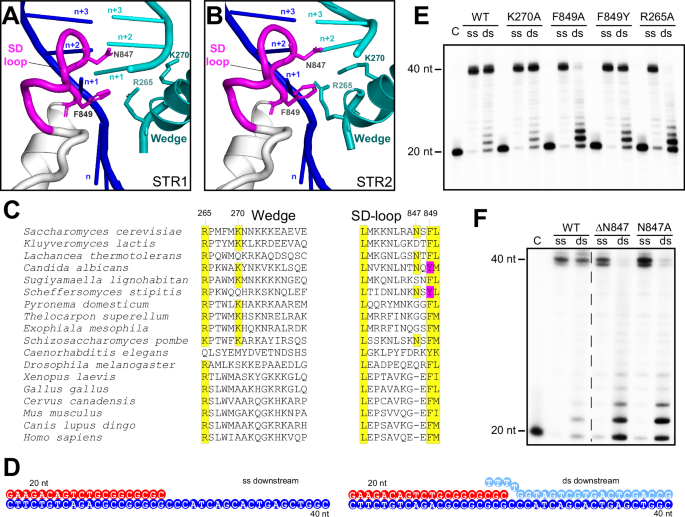
A, B A close-up view of the strand displacement region of Mip1. The n + 1 base pair is visible in Structure I (A), while its space is occupied by the R265 residue in the Wedge helix in Structure II (B). C Sequence conservation of the Wedge and SD-loop regions of mitochondrial DNAPs from various species. Conserved residues are highlighted in yellow. The F849Y polymorphism in the SD loop of DNAPs of some yeast species is shown in magenta. D Primer-template constructs used in primer extension assays. E Primer extension assay performed using Wedge helix and SD-loop mutants with a primer-template construct containing either single-stranded or double-stranded downstream DNA. F Primer extension assay performed using DN847 and N847A mutants in the SD-loop, with a primer-template construct containing either single-stranded or double-stranded downstream DNA.
Two elements of Mip1 are engaged in strand displacement activity at this stage (Fig. 3A). The conserved F849 residue in a small loop at the N-terminus of large helix Q in the palm subdomain, termed here the Strand Displacement (SD) loop, is seen in stacking with the n + 1 downstream DNA base pair (Fig. 3A). Another residue in the SD loop, N847, appears to block the path of the non-template strand into the active site (Fig. 3A). Structure I revealed an additional critical structural element involved in the strand displacement activity of Mip1 – the Wedge helix (res 264–280) (Fig. 3A). Recent structural studies demonstrated the key role of the Wedge helix in Polγ proofreading activity16. In Structure I, the R265 residue of Wedge inserts between the strands of the downstream duplex at the n + 1 base pair, while K270 interacts with the phosphate backbone of the non-template strand of DNA (Fig. 3A).
The juxtaposition of the SD loop and the R265 residue at the n + 1 DNA base-pair suggests that translocation of Mip1 along the template strand will result in clashes with these structural elements, driving the displacement of the non-template DNA strand. Indeed, in Structure II, the side chain of R265 swings into space previously occupied by the n + 1 NT DNA base (Fig. 3B), whereas F849 and K270 occupy the position of the phosphate and sugar moiety, respectively. This is accompanied by the movement of the Wedge helix, Thumb, and Joist, and by further bending of the DNA, which results in a ~ 83o angle between the downstream DNA and the primer-template duplex (Fig. 1E, H). Consistent with the changes described above, the cryo-EM maps for Structure II lack density for the n + 1 base of the NT DNA strand, suggesting that it has already been displaced and the downstream DNA is melted by 1 bp (“gap 1”) (Fig. 3B).
To confirm the role of the SD loop and the Wedge helix in intrinsic strand displacement activity, we generated Mip1 variants with key residues of these structural elements substituted with alanines (Fig. 3C). A primer extension assay, which employed constructs with either single-stranded or double-stranded downstream DNA was used (Fig. 3D, E). All generated Mip1 variants had activity similar to the WT Mip1 when strand displacement was not required for primer extension (Fig. 3E). However, the activity of the F849A variant of Mip1 was severely compromised on the template with the double-stranded downstream DNA (Fig. 3E). In contrast, the activity of the F849Y variant of Mip1, a common polymorphism in yeast species, was similar to the WT Mip1. Similarly to F849A, deletion of the N847 residue, or its substitution to alanine, resulted in a Mip1 variant with abolished strand displacement activity (Fig. 3F). While both R265 and K270 are conserved in yeast species, only R265A substitution had a marked effect on the strand displacement activity of Mip1 (Fig. 3C, E), consistent with the structural data.
To investigate whether Mip1 variants defective in strand displacement exhibit reduced processivity, we performed a primer extension assay using a long single-stranded DNA template from bacteriophage M1322 (Supplementary Fig. 6). The R265A and ΔN847 Mip1 variants demonstrated significantly lower efficiency in synthesizing a full-length complementary DNA strand compared to WT Mip1. The most prominent defect was observed with the F849A variant, which failed to produce a complementary DNA strand (Supplementary Fig. 6).
Catcher loop-assisted DNA bending mediates strand displacement
Engagement of the Catcher loop with downstream DNA and bending of the latter, observed in Structures III and IV, suggests that this element can play an important role in the strand displacement mechanism. The loop is an insertion to the conserved fingers domain of DNAPs, which moves during each cycle of nucleotide incorporation24. In Structures I and II, two positively charged residues, R797 and K803, project towards the template strand of the downstream DNA to interact with the phosphate backbone between bases n + 2 and n + 3 (Fig. 2D).
In contrast to Structures I and II, the downstream DNA in Structures III and IV is found sitting on top of the Catcher loop (Fig. 4A, B), which now makes a network of interactions with the non-template DNA strand. Residues K794, K796, R797, K799, and K803 of the Catcher loop and K1029 of the flap subdomain form a positively charged groove on the Mip1 surface (Figs. 2, 4A). These extensive interactions of the Catcher loop with DNA observed in Structure III stabilize the wider angle between the downstream DNA and the upstream DNA duplex ( ~ 120o); however, they do not change the extent of the downstream DNA melting, which remains at 1 bp. Nonetheless, in Structure IV, which likely represents a consecutive step of the strand displacement process, an additional kink in the template DNA strand between bases n + 3 and n + 4 is observed (Fig. 4B). This sharp bending of the TS effectively unwinds the downstream DNA, preventing base pairing of the n + 2 and n + 3 bases with the non-template strand counterparts. Consistently, the cryo-EM maps of Structure IV lack density for these bases in the non-template strand of DNA (Fig. 4B).

A Interactions of the Catcher loop with downstream DNA and flap subdomain in Structure III. The structure of Mip1 (res 1-998, surface representation) is shown along with a loop connecting a flap (grey) to the C-terminal Domain (invisible in the Cryo-EM density). B A close-up view of Catcher loop interactions with downstream DNA and the flap subdomain in Structure IV (grey). C Conservation of the Catcher loop in yeast species. Conserved residues are highlighted in yellow, while positively charged residues are highlighted in red. Residues targeted in Mip1 mutagenesis are indicated by grey arrows. D Primer extension assay performed using the Catcher loop mutant (Tetra) and a primer-template construct with single or double-stranded downstream DNA, performed at 30 oC (left panel) and room temperature (right panel). E Electrophoretic Mobility Shift Assay (EMSA) using WT Mip1 (top panel) and TETRA Mip1 mutant (bottom panel). F. Relative affinity of WT and Tetra Mip1 mutant for DNA, as observed in (E).
The Catcher loop position appears to be stabilized by multiple hydrophobic interactions with the helix-turn-helix “flap” subdomain of Mip1 (residues 1014–1051) (Fig. 4A). The many hydrophobic residues of the flap form a deep pocket that neatly accommodates conserved residues of the Catcher loop, F801 and F804 (Fig. 4B). The flap subdomain connects to the Mip1 body through a ~ 40 Å long flexible linker (residues 995-1014) and leads to the large, ~200 amino acid C-terminal domain (CTD) (Fig. 4A). It is possible that the motion of CTD and the flap subdomain can affect the ability of the Catcher loop to interact with the downstream DNA and exhibit strand displacement activity. Indeed, Mip1 CTD deletion mutants show decreased strand displacement activity21. To probe if interactions of the Catcher loop with the downstream DNA are important for strand displacement activity, we generated a variant of Mip1 in which four positively charged residues K794, K796, R797, and K803 were substituted to alanines (“TETRA”) (Fig. 4C, D). We found that while TETRA Mip1 was capable of extending a primer on a construct with single-stranded downstream DNA, its activity was significantly reduced on double-stranded DNA (Fig. 4D). Both WT and the TETRA Mip1 had similar DNA binding activity as evident from the EMSA experiments (Fig. 4E, F), suggesting that bending of the downstream DNA mediated by the Catcher loop is critical for the strand displacement activity of Mip1. Notably, TETRA Mip1 was significantly less processive than the WT enzyme in a primed M13 DNA extension (Supplementary Fig. 6).
Mip1 variants defective in strand separation do not support mitochondrial DNA maintenance and respiration
To test the in vivo role of the Mip1 structural elements implicated by structural and biochemical studies in strand displacement function, we generated point mutations in the centromeric MIP1-pRS315 plasmid. These mutants were then introduced into a yeast tester strain, in which the chromosomal MIP1 ORF had been deleted, and the WT MIP1 was encoded by pRS316-MIP1 plasmid (Fig. 5A). To monitor the respiration status of the cells, the tester strain contained an ade2 mutation, causing respiratory-proficient colonies to appear red. After 6 days of growth on media containing 5-fluoroorotic acid to counter-select the WT MIP1-pRS316 plasmid, the majority of the mutants displayed a profound defect in mitochondrial function, as revealed by a higher frequency of colonies containing sectors of respiratory-inactive white cells or completely white colonies (Fig. 5B, C). The colonies of two Mip1 variants, F849A and TETRA, lacked any respiratory-active cells. DAPI staining further confirmed that these cells had lost their mitochondrial DNA, rendering them rho° (Fig. 5D).

A Schematic representation of the plasmid-shuffling and petite formation frequency assays. Yeast colonies were classified as white (no respiration), sectored (mixed), and red (active respiration). Strains retaining respiratory activity were obtained from the plasmid-shuffling assay and selected by propagation on a glycerol-containing medium. The schematic was created in BioRender. Sokolova, V. (2025) https://BioRender.com/x01j374. B Yeast colonies formed on 5-FOA-containing media. C The plasmid-shuffling assay of the W303a mip1Δ strain expressing either the WT MIP1 or the indicated MIP1 variants. The average fraction of the red, sectored, and white colonies (n = 3) is shown. Data are presented as mean ± SD. An unpaired, two-sided Student’s t-test was used for statistical analysis, with asterisks indicating significant differences between an individual mutant and the wild-type strain. p < 0.05 (*), p < 0.01 (**), p < 0.001 (***). Data are presented as mean ± SD. D Analysis of DAPI staining of mutant yeast strains by fluorescence microscopy (n = 3). The mtDNA and nuclear DNA staining are shown for W303 WT MIP1, W303 mip1Δ, and the MIP1 variants F849A and TETRA, which did not produce colonies containing respiratory active cells in the 5-FOA shuffling procedure. M mitochondria, N nucleus. E Petite formation frequency in mutant MIP1 strains obtained via FOA shuffling, compared to the WT MIP1 strain (n = 3). An unpaired two-sided Student’s t-test was used for statistical analysis, with *** indicating a significant (p < 0.001) difference between an individual mutant and the wild-type strain.
To further evaluate the mitochondrial phenotype of the Mip1 mutants, we selected respiratory-active yeast cells by using glycerol-containing media, where mitochondrial function is essential. We then measured the frequency of petite formation25 by estimating the proportion of cells that lost respiratory function during growth on glucose (Fig. 5E). Our results revealed that the Mip1 variants K270A and F849Y maintained respiratory proficiency at levels comparable to the WT yeast strain. In contrast, the R265A, N847A, and particularly the ΔN847 variants exhibited significant respiration defects (Fig. 5E). Therefore, the in vivo activity of Mip1 mutants strongly correlated with their intrinsic strand displacement efficiency, as determined by both structural studies and biochemical assays.
Discussion
The mechanism of intrinsic strand displacement activity in Pol A family of DNAPs
Our structural findings elucidate the mechanism behind the intrinsic strand displacement activity of the Pol A family DNA polymerase, Mip1. Single particle analysis reveals four key conformations of Mip1, each associated with different stages of its strand displacement function. By analyzing the extent of DNA unwinding and the relative changes in protein structure, we have been able to identify the sequential steps involved in DNA strand separation – a process that has remained largely unexplored by structural methods (Fig. 1D–G).
At the beginning of the process, when the non-template strand of DNA has not been displaced, Mip1 bends the downstream DNA, creating a 90° angle between the downstream and upstream DNA duplexes (Fig. 1H). This mechanism closely resembles the DNA melting process in the Pol A family of RNA polymerases, which also exhibit intrinsic strand displacement activity (Fig. 6A)26,27. In human mitochondrial RNA polymerase (mtRNAP), DNA melting is stabilized by an aromatic residue in the fingers domain, Y1004, which forms stacking interactions with the n + 1 base of the DNA template strand (Fig. 6A)28. Although the fingers domains are evolutionarily conserved between Pol A family RNA polymerases and DNA polymerases, mitochondrial DNAPs lack an analogous aromatic residue. Instead, they utilize the strand displacement module, composed of two structural elements absent in RNA polymerases: the SD loop and the Wedge helix. These structural elements harbor residues that insert between the strands of the downstream DNA. The F849 residue in the SD loop of Mip1 functions similarly to the Y1004 residue in mtRNAP, stabilizing the flipped-out conformation of the n + 1 base in DNA, while R265 in the Wedge helix inserts between the two strands of DNA (Fig. 6A). Interestingly, human Polγ, which has marginal intrinsic strand displacement activity, also features the SD loop with a conserved F1092 residue (Fig. 6B, C). However, this loop is shorter and thus lacks the bulging formed by the N847 residue required for efficient strand displacement (Fig. 6C). Consistently, in T7 DNAP, which also lacks the intrinsic strand displacement activity and thus relies on gp4 helicase, the SD loop is significantly shortened and lacks aromatic residues (Fig. 6D). In contrast, BST DNAP, known for its potent intrinsic strand displacement activity, has an extended helix Q, which appears to serve a function similar to the SD loop in Mip1, as suggested by the structural alignment of these enzymes (Fig. 6E).

A Strand separation in mitochondrial RNAP (left) and DNAP (right). Polymerases were aligned using the conserved catalytic residues in their palm subdomains. Note the nearly identical trajectory of the RNA-DNA and the primer-template duplexes in both structures. B–E Conservation of the SD loop in DNAPs of the Pol A family. Polγ – human mitochondrial DNAP, T7 – bacteriophage T7 DNAP, TAQ – Thermus aquaticus DNAP, BST – Geobacillus stearothermophilus DNAP. F–I Catcher loop insertion into the conserved fingers domain of DNAPs of the Pol A family. Helices O2 and P are indicated. The Catcher loop in human Polγ is modeled using AlphaFold3. Mitochondrial DNA polymerases use different mechanisms for strand separation during replication. Here, the authors reveal the cryo-EM structures of yeast Mip1, identifying key structural elements that enable strand displacement. Mutations in these elements impair mitochondrial function and DNA maintenance.
The strand displacement activity in RNAPs, and likely in DNAPs, is closely linked to the translocation of these enzymes along the DNA29. The incorporation of nucleotides and subsequent translocation by DNAP are accompanied by the opening and closing motion of the fingers domain30. Although our structural data did not capture the open conformation of Mip1 due to the presence of the incoming substrate in the insertion site, we speculate that the opening of the fingers domain does not significantly alter the geometry of the strand displacement module, as its elements and the Catcher loop likely remain engaged with the DNA.
Interestingly, unlike the situation with RNAPs, Mip1 appears to unwind two additional bases in the downstream DNA region (Fig. 4B). We speculate that the melting of additional bases contributes to Mip1 processivity and high rate of DNA synthesis22. The melting is mediated by a kink in the downstream DNA introduced by multiple interactions of the Catcher loop with both template and non-template strands of DNA. The Catcher loop is a unique insertion in the fingers domain of mitochondrial DNA polymerases and is not found in mitochondrial RNAPs (Fig. 6A). The substitution of four residues involved in interactions of the Catcher loop with DNA resulted in the Mip1 variant defective in primer extension using a double-stranded DNA template, confirming the role of this structural element in strand displacement activity. The Catcher loop is present in human Polγ, in which it is significantly extended (Fig. 6F, G). The Catcher loop is missing from strand displacement-deficient TAQ and T7 DNAPs (Fig. 6H, I), though the latter enzyme has an insertion loop in the fingers domain, called the “front basic patch”31,32, which occupies a similar space in the structure of the DNAP-DNA complex, as the Catcher loop in Mip1. The front basic patch has been shown to be a part of the binding site for gp4 helicase33.
Yeast mitochondrial DNAPs feature extended C-terminal domains, not found in their mammalian orthologs21,34. Biochemical data suggest that CTD can influence both the strand displacement function of Mip1 and its processivity. Since Mip1’s CTD is connected to the flap subdomain, which anchors the Catcher loop (Fig. 4A), movement of this domain or its interactions with other proteins may regulate Mip1 activity in yeast mitochondria.
In conclusion, this study provides structural insights into mitochondrial DNAPs from yeast species, offering a detailed view of the intrinsic strand displacement mechanism that is unique to these enzymes. This structural characterization opens avenues for developing novel therapeutic strategies targeting pathogenic yeast species, where mitochondrial DNA replication machinery could be exploited. These results also provide a foundation for future studies on mitochondrial diseases and potential treatments that could target the mitochondrial DNA replication machinery.
Methods
Protein expression and purification
The C-terminal His-tagged Mip1 in pET24d vector was expressed and purified as described previously35, with modifications. Specifically, cell cultures were grown at 37 °C until OD600 reached 0.4. The growth temperature was reduced to 16 °C over 2 h, after which the expression of Mip1 was induced by the addition of 0.15 mM IPTG, and cells were cultivated overnight. Collected cell pellets were resuspended in 20 mL of lysis buffer (40 mM Tris-HCl pH=7.9, 1 M NaCl, 5% Glycerol, 10 mM Imidazole, 0.5% Tween-20, 5 mM 2-mercaptoethanol, 1 mM PMSF, 1 µg/ml Pepstatine, 8 µg/ml Benzamidine). Crude lysate was sonicated for 20 min at 40 Amp in cycles of 1 sec on, 2 sec off. After centrifugation, clear lysate was incubated with 1:100 (v/v) of HisPurTM Ni-NTA resin (ThermoFisher Scientific) for 2 h at 4 °C. The incubated Ni-NTA resin was washed twice with 50 mL wash buffer (40 mM Tris-HCl pH=7.9, 1.2 M NaCl, 5% Glycerol, 15 mM Imidazole, 0.5% Tween-20, 5 mM 2-mercaptoethanol, 0.1 mM PMSF) for 30 min at 4 °C. The beads were poured into a gravity flow column and washed with 2 CV of HEPES buffer A (25 mM HEPES pH 7.4, 100 mM NaCl, 5% Glycerol, 5 mM 2-mercaptoethanol). Mip1 was eluted with 5 mL of elution buffer (HEPES Buffer A with 250 mM Imidazole). Elution fractions containing the protein were transferred onto the ion exchange chromatography column MonoSTM 5/50 GL (GE Healthcare), equilibrated in HEPES buffer A, and Mip1 was eluted by 0–100% linear gradient of HEPES buffer B (25 mM HEPES pH 7.4, 1 M NaCl, 5% Glycerol, 5 mM 2-mercaptoethanol). Peak fractions eluted around 37–39 mS/cm were collected and loaded onto a 1 mL HiTrapTM Heparin column (Cytiva) equilibrated in Heparin buffer A (40 mM Tris-HCl pH 7.9, 300 mM NaCl, 5% Glycerol, 5 mM 2-mercaptoethanol). Mip1 was eluted by 0–100% linear gradient of Heparin buffer B (40 mM Tris-HCl pH 7.9, 1.5 M NaCl, 5% Glycerol, 5 mM 2-mercaptoethanol). Peak fractions eluted at 60 mS/cm were collected and analyzed using PAGE electrophoresis, concentrated, and stored at −80 °C.
Variants of Mip1 (K270A, F849A, F849Y, R265A, N847A, ΔN847, and TETRA – K794A, K796A, R797A, K803A)) were obtained by site-directed mutagenesis (QuikChange, Agilent) and expressed and purified as described above.
DNA Oligonucleotides and primer-template annealing
Synthetic DNA oligonucleotides (IDT DNA) were used. Primer sequences (5’ to 3’) are as follows: GAAGACAGTCTGCGGCGCGC (DNA20), Cy3-GGTACAACTTGACGACATAGCGTG (5Cy3DNA24). The template strand sequences (5’ to 3’): CGGTCGAGTCACGACTACCCGCGCGCCGCAGACTGTCTTC (TS40), CGGTCGAGTCACGACTCCGATTATCACGCTATGTCGTCAAGTTGTACC (DNA24TS). Non-template strand sequence: TTTTGGTAGTCGTGACTCGACCG (NT23flap4T).
To anneal, the primer-template constructs (2 μM) were diluted in water, heated for 7 min at 95 °C, and cooled down (1 °C/min) for 1 h to 25 °C in a thermocycler.
Preparation of Mip1 complexes for cryo-EM
WT Mip1 was dialyzed in a buffer containing 10 mM Tris-HCl pH 7.9, 100 mM NaCl, 10 mM DTT, and 5 mM MgCl2 overnight at 4 °C. To assemble the complex, the dialyzed WT Mip1 was mixed with the DNA20/TS40/NT23flap4T construct at 4 µM (1:1 molar ratio) in the presence of 0.5 mM dGTP and ddTTP to allow the primer extension and chain termination for 20 min at room temperature. Upon completion of primer extension, dATP (0.1 mM) was added, and the complex was incubated at room temperature for an additional 10 min. The complexes were applied to negatively glow-discharged 300 mesh Cu Quantfoil 1.2/1.3 grids with holey-carbon foils (Quantifoil). Grids were blotted with Whatman® Grade 595 filter paper using a Vitrobot Mark IV (ThermoFisher Scientific) for 1–2 s at 4 °C and 95% humidity, then vitrified in liquid ethane. The sample quality and particle distribution were assessed using Glacios Transmission Electron Microscope equipped with a Falcon-4 direct electron detector.
Single-particle data acquisition and image processing
High-resolution single particle data was collected at Stanford-SLAC Cryo-EM Center (S2C2) employing a Titan Krios G3i transmission electron microscope (ThermoFisher Scientific) with a Selectris X Energy Filter and 10 eV slit width at 300 kV. The movies were captured at a nominal magnification of 165,000, which amounts to an Å/pixel value of 0.741, using a Falcon4i direct electron detector kept in counting mode. An objective lens with an aperture size of 100 µm was inserted to improve contrast of the micrographs. An exposure time of 3.9–5.1 s resulted in a total electron dosage of 60−70 e–/Å2 over 60–70 frames, with a dose of 1 e–/Å2 each frame. Data was collected in EPU 3.7 with defocus values ranging from -0.5 to -1.5 µm.
The movie stacks were processed using CryoSPARC 4.4 fleet36. The movies were frame-aligned, motion-corrected, gain-normalized, and dose-weighted, using the patch motion correction module. Contrast transfer function (CTF) values of the micrographs were estimated with patch CTF (CryoSPARC). Micrographs with ice, ethane contamination, high frame motion, or lower CTF fit resolution (worse than 7 Å) were discarded. Mip1 particles were picked on micrographs that were low pass filtered to 20 Å, using the blob picker job with an input particle diameter of 70–120 Å. Following multiple rounds of 2D classification on 4X binned particles, particles positioned closer to 55 Å were rendered as duplicate particles and were removed. Particles were then re-extracted at 1X pixel size of 0.741 Å/pixel and used for generating an initial map through ab initio reconstruction using a resolution range of 7–9 Å. The unbinned particles were then refined with non-uniform refinement using a 40 Å low pass filtered reference ab initio map. To assess heterogeneity, two major sets of particles were separated using heterogeneous refinement. Particles in the non-catalytic state of Mip1 were separated into two clusters using 3D Variability Analysis (3DVA) in intermediate mode, while particles in the catalytic conformation of Mip1 were divided into three distinct clusters through 3DVA in cluster mode. Four well-separated conformations were further refined to high resolution (2.4–3.0 Å) using non-uniform refinement. The reported resolutions of the cryo-EM maps are based on the FSC 0.143 criterion37. The 3DFSC server was used to assess the isotropy of the 3D reconstructions of classes I-IV38. The angular distribution and local resolution plots for the three classes were generated in ChimeraX.
Model building and structure refinement
An AlphaFold2 predicted Mip1 model was docked into the best-resolved cryo-EM map of Structure I, and the polypeptide chain was morph-fitted in Coot 0.9.8.5. The upstream and the downstream regions of the DNA in the template, primer, and non-template strands were fitted, and incoming dATP with an Mg2+ ion was added to the cryo-EM density. DNA-B form restraints from Coot were used to model the upstream and downstream DNA. The C-terminal domain of Mip1 (residues 1054-1254) and the displaced region of the non-template strand were not resolved in the cryo-EM density and have not been modeled. The local density fit of Mip1 and the DNA regions for the three different 3D classes were improved over an iterative process of model fitting in Coot39, and further finetuning using real-space refinement in PHENIX40. Real-space refinement was carried out with secondary structure and Ramachandran restraints for the polypeptide chain; base pairing, and base stacking restraints for the DNA. Comprehensive model validation was carried out with PHENIX and the PDB validation server (https://validate-rcsb-2.wwpdb.org/) for all Mip1 structures. Map-to-model Fourier Shell Correlation (FSC) plots for Mip1 structures were obtained in PHENIX. Figures were generated with PYMOL and ChimeraX.
Primer extension strand displacement assays
The primers were 5’-labeled using [γ-32P]-ATP (3000 Ci/mmol) and T4 Polynucleotide Kinase (NEB). Mip1 complexes (50 nM) with labeled primer-template construct were assembled in a buffer containing 40 mM Tris-HCl (pH 7.9), 60 mM NaCl, 10 mM MgCl2, and 20 mM 2-mercaptoethanol in the presence of BSA (0.1 mg/ml) for 5 min at room temperature.
Primer extension was performed using DNA20/TS40 and DNA20/TS40/NT23flap4T in the presence of 0.2 mM dNTPs. Reactions were carried out for 3 min at room temperature and stopped by the addition of an equal volume of 95% formamide/5 mM EDTA. The products of the reaction were resolved by 20% PAGE containing 6 M Urea and visualized by autoradiography using PhosphorImager (GE Healthcare).
Processivity assay
The primer-template construct was prepared by annealing a 20 nt primer (5’ to 3’ sequence: GTAAAACGACGGCCAGTG) to a single-stranded circular DNA M13mp18 (NEB). Mip1 (80 nM) was added to the primer-template construct (2.5 nM) in a buffer containing 40 mM Tris-HCl (pH 7.9), 60 mM NaCl, 10 mM MgCl2, and 20 mM 2-mercaptoethanol in the presence of BSA (0.1 mg/ml) and incubated for 5 min at room temperature. Primer extension was performed in the presence of 0.2 mM dNTPs. Reactions were carried out for 2–5 min at 30 oC and stopped by the addition of 25 mM EDTA solution. The products of the reaction were resolved using 0.8% agarose gel containing ethidium bromide and visualized using Bio-Rad ChemiDocTM imager.
Electrophoretic mobility shift assay (EMSA)
The primer-template construct was prepared by annealing DNA24TS and 5’-Cy3-labeled DNA24 oligonucleotides. To perform EMSA, complexes of Mip1 with DNA (100 nM) were assembled in a buffer containing 40 mM Tris-HCl pH 7.9, 60 mM NaCl, 10 mM MgCl2, 5% glycerol, 20 mM 2-mercaptoethanol in the presence of BSA (0.1 mg/ml) for 10 min at room temperature and transferred to ice. The reactions were resolved in pre-chilled 0.5% agarose gels run in 0.5X TBE buffer for 25 min at 100 V at 4 °C. The products of the reactions were visualized using a Bio-Rad ChemiDocTM imager and quantified using ImageJ. For each reaction, the fraction of bound DNA was determined as the intensity of the bound DNA divided by the sum of intensities of the bound and unbound DNA in the respective sample.
Yeast strains and cloning
The yeast plasmids containing the MIP1 gene were obtained by inserting a PCR amplification product consisting of the chromosomal MIP1 ORF and an extra 249 nt upstream and 223 nt downstream in S. cerevisiae W303-1A or Σ1287 between the SalI and SacI sites in pRS315 and pRS316. Mutations in MIP1 were introduced by swapping a NdeI fragment from the respective pET28 bacterial expression plasmids and verified by sequencing.
The W303 MATa mip1Δ, pRS316-MIP1 strain was obtained by the sporulation of diploid W303 MATa/MATα, MIP1/mip1::kanMX4, pRS316-MIP1 heterozygous diploid strain where one allele of MIP1 was completely removed by homologous recombination using the kanMX4 selection marker.
5-FOA plasmid-shuffling and mtDNA analysis
The strain W303 MATa mip1Δ, pRS316-MIP1 was transformed with pRS315, pRS315-WT-MIP1(Σ1287), or pRS315-mip1 and selected on plates with SC-Ura-Leu media containing 2% glucose for two days. Next, a 4 ml culture of SC-Ura-Leu containing 2% glucose was inoculated with a single colony and incubated for 4.5 h. The cells were plated out onto SC-Leu solid media containing 2% glucose and 1 mg/ml of 5-fluoroorotic acid (5-FOA) in triplicates. The colonies were growing for 3 days at 30 ˚C plus 3 days at room temperature and counted. Three biological replicates were used to characterize each Mip1 mutant. The unpaired Student t-test was used for statistical analysis, and the statistical difference compared to the WT strain is indicated (p < 0.05(*), p < 0.01(**), p < 0.001(***).
The presence of mtDNA in yeast strains was analyzed by 4′,6′-diamidino-2-phenylindole (DAPI) staining as previously described using an Olympus BX61 microscope at 400x magnification41.
Petite formation frequency assay
Petite formation assay was performed similarly to the previously published method25. W303 MATa, mip1Δ pRS315-mip1 strain obtained through 5-FOA shuffling were propagated on solid media containing SC-Leu media with 3% glycerol. A single yeast colony was used to inoculate a 5 ml liquid culture containing SC-Leu with 3% glycerol. After 2 days, 2 × 10⁵ cells/ml were released into SC-Leu with 2% glucose, incubated for 24 h, and diluted again to 2 × 10⁵ cells/ml. Next, 200–300 cells were plated onto SC-Leu plates containing 0.3 % glucose, 0.5 % glycerol, and 2% ethanol. After 3–4 days at 30 °C the number of petite and rho+ colonies was determined. Petite frequency was defined as the ratio of petites to the total number of colonies. Three biological replicates of each Mip1 mutant strain were analyzed.
Statistics and reproducibility
Experiments presented in Fig. 3e, f and Fig. 4d–f were repeated at least three times. Experiments presented in Fig. 5b–e involved three independent biological replicates (n = 3). The representative images are shown.
Reporting summary
Further information on research design is available in the Nature Portfolio Reporting Summary linked to this article.
Responses