Structure characterization of Grifola frondosa polysaccharide and its effect on insulin resistance in HFD-fed mice

Introduction
Type 2 diabetes is a serious health concern worldwide, and is characterized by insulin resistance (IR)1. As of 2021, the global diabetes prevalence in 20–79 years old was 536 million cases of diabetes worldwide with an estimated 783 million by the year 2045 if current trends continue despite the variety of pharmacological interventions currently available2. Type 2 diabetes occurs in 95% of the diabetic populations and is considered a chronic and noncommunicable disease responsible for 80% of premature deaths globally3. Several studies have reported that the occurrence and progression of IR are related to a disturbance in the proportions of gut microbiota4,5. In particular, perturbed Firmicutes/Bacteroidota (F/B) eubiosis has been linked with increased intestinal permeability, with infiltration of bacteria byproducts through a leaky gut barrier triggering subsequent inflammatory responses characteristic of diabetes6. It appears that the metabolic factors associated with chronic low-grade inflammation and oxidative stress, which link gut microbiota dysbiosis and IR7. Gut microbiota disorder increases the lipopolysaccharide (LPS) content and it binding to toll-like receptor 4 (TLR4)8. TLR4 functions as a primary sensor in microbial products, activating signaling pathways that induce the expressions of pro-inflammatory genes9. Some natural antioxidant, such as polysaccharides, resveratrol, and flavone, has been shown to alter the composition of the gut microbiota, suggesting that these antioxidants interact with the gut microbiota through modulation of inflammation, glucose homeostasis, gut permeability and short-chain fatty acid-producing bacteria10,11. Thereby, it is of utmost importance to develop efficient functional products that target the gut microbiota and the related inflammatory response mainly to prevent and alleviate IR.
Fungus reportedly exhibit beneficial bio-functions, which has led to the wide application in food products and pharmaceutical products12,13. The polysaccharides extracted from fungus exhibit a wide range of biological activities, including antioxidant activity, immunomodulatory, and anti-inflammation activities14,15,16. Numerous studies have focused on the effects of fungus polysaccharides in regulating blood glucose, lowering blood lipids, and improving the intestinal microecological environment17,18. Among these effects, the regulatory effect of gut microbiota, which leads to alleviated oxidative stress and ultimately mitigated metabolic syndrome, is considered one of the key mechanisms through which fungus polysaccharides regulate energy metabolism19,20.
Grifola frondosa (G. frondosa) is an edible fungus belonging to the family of Polyporaceae. G. frondosa is rich in functional polypeptides, polysaccharides, and active small molecule compounds, which have rendered this fungus valuable as an ingredient of traditional medicines21. The polysaccharides in G. frondose (GFP) are reportedly abundant in antioxidant activities and anti-inflammatory effects22, which involve the TLR4-mediated signaling pathway followed by the regulation of the expressions of inflammatory cytokines23,24.
Nonetheless, the extent to which GFP mitigates high-fat diet (HFD)-induced insulin resistance and its underlying mechanisms remains ambiguous. In the present study, GFP was subjected to structural characterization. In addition, this study examined the impact of GFP on gut microbiota in HFD-induced insulin-resistant mice. Given that inflammation is closely linked to gut microbiota disorder and substantial evidence identified TLR-4 as a principal regulator with potential pro-inflammatory properties, we hypothesized that GFP could protect against IR in an HFD-fed mice model by reconstructing the composition of gut microbiota and inhibiting the TLR4-regulated inflammatory response. The findings of the present study would serve as a theoretical reference to guide the development and application of GFP in functional foods.
Results
Molecular weight, molecular conformation and monosaccharide composition of GFP-N1 and GPF-N2
As depicted in Fig. 1A and C, GFP-N1 and GFP-N2 presented single, sharp, and symmetrical peaks at 23–25 min and 30–34 min, respectively, indicating that GFP-N1 and GFP-N2 were homogenous polysaccharides. The Mw of the GFP-N1 was 3.323 × 10³ kDa, and the Mw of the GFP-N2 was 10.8 kDa. The molecular conformation of GFP-N1 was inferred from the radius of gyration (Rg) versus molar mass plot in a double logarithmic coordinate, as depicted in Fig. 1B. The Rg (also referred to as the R.M.S. radius) was derived directly from the SEC-MALLS-RI measurement. Unfortunately, due to the low Mw of GFP-N2, its molecular conformation could not be predicted. The molecular conformation was predicted from the slope value of the straight-fitting line. In general, when the slope value of the straight fitting line ranges from 0.2 to 0.4, it indicates branching polymers with compact coil chain conformation25. The slope value of the fitting line for the GFP-N1 was 0.271, suggesting that the chain conformation of GFP-N1 was almost a coil chain conformation. As depicted in Fig. 1E and F, the GFP-N1 was mainly composed of galactose (Gal, 10.72 µg/mg) and glucose (Glc, 657.68 µg/mg) and GFP-N2 was mainly composed of Gal (3.54 µg/mg), Glc (44.49 µg/mg) and mannose (Man, 44.21 µg/mg), which indicated that this GFP was a neutral polysaccharide.

A Light scattering (LS) and refractive index (RI) signals of GFP-N1. B The plot of Rg versus molecular weight in a double logarithmic coordinate and the fitting line of GFP-N1. C Light scattering (LS) and refractive index (RI) signals of GFP-N2. D Monosaccharide standards analyzed by HPAEC. E Monosaccharide composition of GFP-N1 analyzed by HPAEC. F Monosaccharide composition of GFP-N2 analyzed by HPAEC. G The FT-IR spectra of the GFP-N1. H The FT-IR spectra of the GFP-N2. I The total ion flow of PMAAs of GFP-N1 in GC-MS. J The total ion flow of PMAAs of GFP-N2 in GC-MS.
FT-IR analysis
The FT-IR spectra of the GFP-N1 presented absorption bands at 3436.21, 2933.55, and 1025.20 cm-1 (Fig. 1G), and the FT-IR spectra of the GFP-N2 presented absorption bands at 3412.45, 2927.36, and 1056.92 cm-1 (Fig. 1H), which were the characteristic absorption peaks typical of polysaccharides. The wide peaks at 3436.21 and 3412.45 cm-1 were attributed to the stretching vibration of -OH. The peaks at 2933.55 and 2927.36 cm-1 were assigned to the C-H stretching vibration of methylene. The bands at 1025.20 and 1056.92 cm-1 were the absorption peak for the stretching vibration of C-O. The peaks at 1638.47 and 1654.56 cm-1 corresponded to the stretching vibration of C = O. The peaks at 1401.10 and 1400.84 cm-1 represented the bending vibration of C-H. The peaks at 1153.55 cm-1 and 1079.46 cm-1 were the absorption peaks for the stretching vibration of C-O. The peak at 920.05 cm-1 was attributed to the deformation scissor vibrations of the C-H and C-O bonds.
Methylation analysis (linkage analysis)
In this analysis, GFP-N1 and GFP-N2 were first converted to partially methylated alditol acetates (PMAAs) through derivatization and hydrolysis, and then the PMAAs were identified using GC-MS. The total ion flow results are presented in Fig. 1(I and J). As presented in Table 1, the GFP-N1 contained seven glycosidic linkages: T-linked-Glcp, 1,3-Glcp, 1,6-Glcp, 1,4-Glcp, 1,3,4-Glcp, 1,3,6-Galp, 1,4,6-Glcp in the molar ratio of 13.97:3.17:2.10:67.44:3.20:2.02:8.10. GFP-N2 contained seven glycosidic linkages: T-linked-Manp, T-linked-Glcp, 1,3-Glcp, 1,2-Manp, 1,6-Glcp, 1,4-Glcp, 1,6-Manp, 1,3,6-Galp, 1,3,6-Glcp, 1,2,6-Glcp in the molar ratio of 22.82:12.88:4.55:19.23:12.02:6.18:7.05:3.31:6.36:5.60.
Anti-inflammatory effect of GFP on HFD-induced IR mice
Effect of GFP on body weight, energy intake, and glucose metabolism of mice
After nine weeks of gavage (15th week of the experimentation), the daily food intake was significantly lower in the mice fed with an HFD and the daily energy intake of the mice in the HFD group was significantly higher than that of the mice in the CON group. The food intake and energy intake of mice in the GFP1 and GFP2 group was slightly higher than that in HFD group with no significant difference. The food intake and energy intake of mice in the GFP3 was significantly higher than that in HFD group (Fig. 2B and C). The body weight of the mice in the GFP-treated groups was significantly lower than that of the mice in the HFD group (Fig. 2D). The body weight gain of the mice in GFP-treated groups was also significantly lower than that of the mice in the HFD group (Fig. 2E). The mice in the HFD group exhibited symptoms of glucose intolerance, which manifested as a significantly greater AUC compared to the CON group, along with significantly higher levels of fasting blood glucose and fasting plasma insulin compared to the mice in the CON group. These results indicated a significant difference in the HOMA-IR values between the CON and HFD group mice (Fig. 2F–J). The blood glucose-related indices were significantly lower in the GFP-treated groups compared to the HFD group.
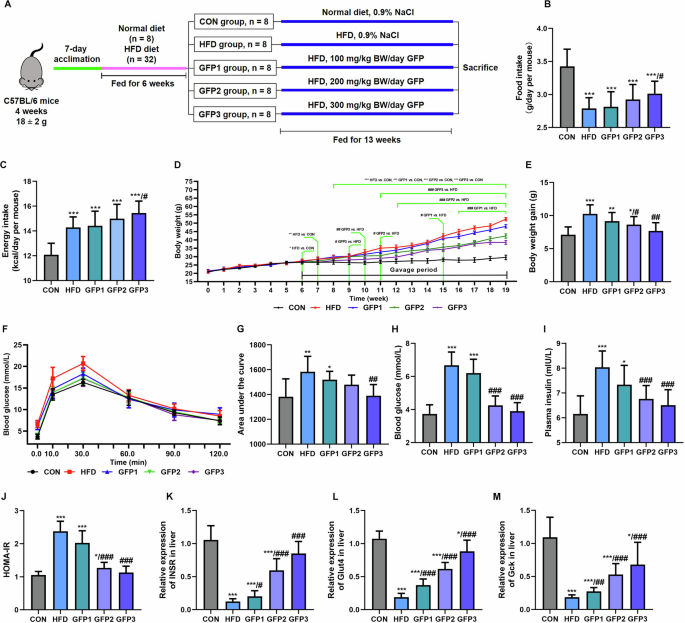
A Schematic diagram of experimental design. B Food intake. C Energy intake. D Body weight growth curve. E Body weight gain. F Blood glucose curve in OGTT. G Area under the glucose curve in OGTT. H Fasting blood glucose. I Fasting plasma insulin. J HOMA-IR. K–M The mRNA expression of glucose metabolism-related genes in the liver. *p < 0.05; **p < 0.01; ***p < 0.001 when compared to CON group; #p < 0.05; ##p < 0.01; ###p < 0.001 when compared to HFD group.
Further, the mRNA levels of the genes related to glucose metabolism in the liver were determined (Fig. 2K–M). It was revealed that INSR, Glut4, and Gck were significantly downregulated in the HFD group compared to the CON group. GFP treatment significantly improved the effect of HFD on mRNA expressions of the above-mentioned genes.
Effect of GFP on lipid metabolism of mice
As depicted in Fig. 3A and B, the body fat of the HFD group mice was significantly higher than that of the CON group mice, and this effect was significantly alleviated upon GFP administration. The mice in the HFD group exhibited significantly higher levels of plasma total cholesterol, triglyceride, and LDL-C and lower levels of HDL-C compared to the mice in the CON group. The HFD-induced changes in the blood lipid indices were significantly mitigated upon GFP administration (Fig. 3C–F).
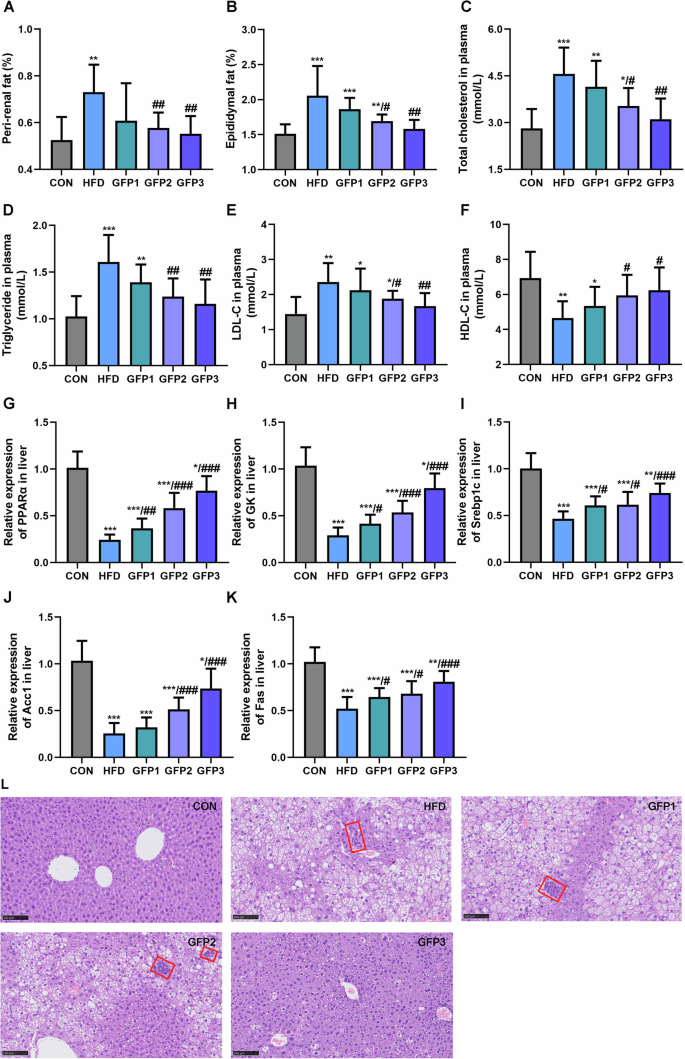
A Peri-renal fat (%). B Epididymal fat (%). C The total cholesterol level in plasma. D The triglyceride level in plasma. E The LDL-C level in plasma. F The HDL-C level in plasma. G–K The mRNA expression of lipid metabolism-related genes in liver. L H&E staining of liver section (inflammatory cells are indicated by the red boxes) (200×, scale bar = 100 µm). *p < 0.05; **p < 0.01; ***p < 0.001 when compared to CON group; #p < 0.05; ##p < 0.01; ###p < 0.001 when compared to HFD group.
Subsequently, mRNA expressions of the genes involved in lipid metabolism in the liver, including PPARα, GK, Srebp1c, Fas, and Acc1, were determined. In comparison to the CON group mice, the HFD group mice exhibited significant downregulation in the mRNA expression of the above genes. GFD administration significantly remitted this effect of HFD on the mRNA expressions of the above lipid metabolism-related genes (Fig. 3G–K). The histomorphological analysis revealed inflammatory cell infiltration and fat vacuous in the liver of HFD mice. The administration of GFP significantly mitigated the hepatic steatosis induced by HFD (Fig. 3L).
Effects of GFP on gut microbiota and SCFAs in mice
GFP administration significantly alleviate the effect of HFD on the diversity of gut microbiota in the mice (Fig. 4). The β-diversity of the gut flora was evaluated using the principal component analysis (PCA). The PCA results revealed that the HFD group was clearly separated from the CON group. Specifically, the GFP-treated mice were located closer to the CON mice, indicating that the HFD-induced disturbance to the microbial composition were partially reversed by GFP treatment. In addition, a distinct separation between the HFD group and GFP3 group was observed, indicating that the microbial composition of these two groups were significantly different (Fig. 4A). In addition, the gut flora of the different groups at the phylum level was evaluated (Fig. 4B). The α-diversity of gut microbiota was evaluated by determining the bacterial richness based on the Chao1 index. In addition, the bacterial diversity was evaluated based on Shannon and Simpson indices. As depicted in Fig. 4C–E, bacterial diversity was significantly lower in the HFD group mice compared to the CON group mice. Moreover, significant differences were noted in the bacterial diversity between the HFD and GFP-treated groups.
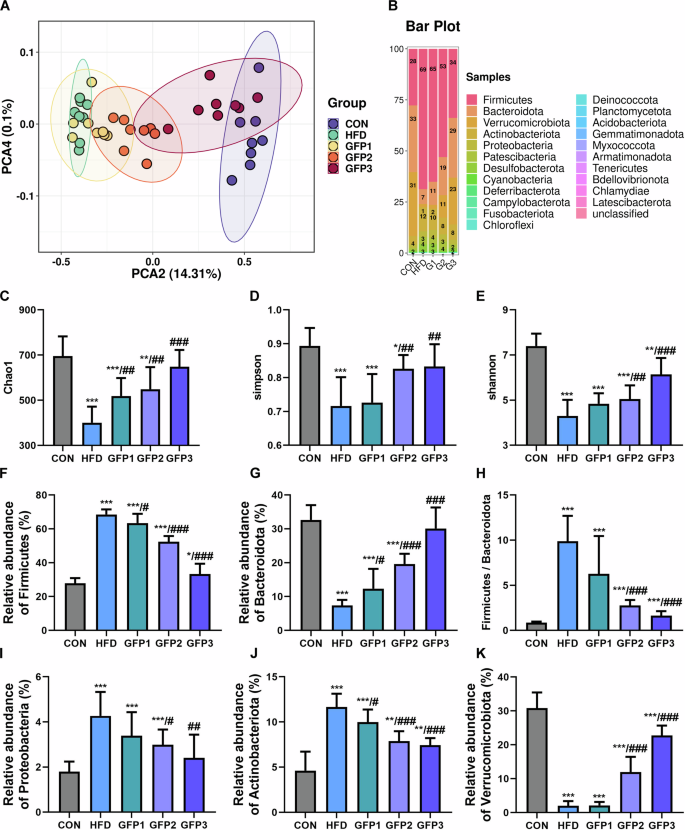
A PCA based on weighted UniFrac. B Comparison of gut microbial relative abundance at phylum level. C–E α-diversity index: richness estimates (Chao1) and diversity estimates (Shannon and Simpson). F–G The relative abundance of Firmicutes and Bacteroidota. H The ratio of Firmicutes/Bacteroidota. I–K The relative abundance of Proteobacteria, Actinobacteriota, and Verrucomicrobiota. *p < 0.05; **p < 0.01; ***p < 0.001 when compared to CON group; #p < 0.05; ##p < 0.01; ###p < 0.001 when compared to HFD group.
The gut microbiota of the mice in the HFD group exhibited a significant increased abundance of the members of phylum Firmicutes and a decreased abundance of the members of phylum Bacteroidota when compared with the CON mice. Accordingly, the F/B ratio was significantly higher in the HFD-treated group. Further, in the HFD group mice, a significant increase was noted in the members of several phyla, including Proteobacteria and Actinobacteriota, while a significant decrease was noted in the members of phylum Verrucomicrobiota. Similarly, a comparison of HFD and GFP-treated groups revealed that GFP treatment alleviated the effect of HFD on the gut flora community in mice (Fig. 4F–K).
The levels of total SCFA and certain fatty acids, including acetic acid, butyric acid, isobutyric acid, valeric acid, isovaleric acid, propionic acid, isobutyric acid, and hexanoic acid, were revealed to be significantly lower in the HFD-treated mice compared to the CON mice. The mice in the GFP-treated groups exhibited a significantly higher production of total SCFAs and fatty acids compared to the HFD group mice (Fig. 5).
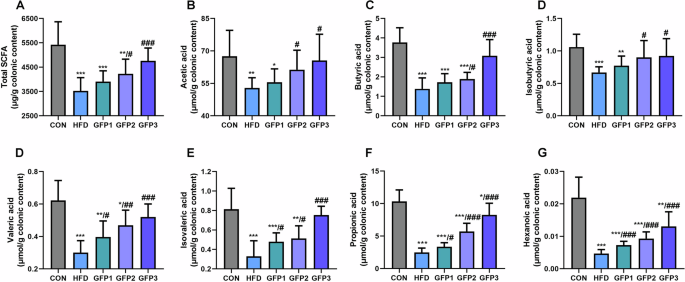
(A) The total SCFAs in colonic content. (B-G) The level of significant differential SCFAs in colonic content. *p < 0.05; **p < 0.01; ***p < 0.001 when compared to CON group; #p < 0.05; ##p < 0.01; ###p < 0.001 when compared to HFD group.
Effects of GFP on the inflammatory response and oxidative stress in mice
The effects of GFP on inflammatory response were assessed by measuring the levels of inflammatory cytokines in plasma and the liver (Fig. 6). The HFD group mice exhibited significantly increased levels of IL-6, IL-8, LPS, LBP, TLR4, TNFα, and NFκB and decreased levels of IL-10 compared to the CON mice. The comparison of the inflammatory cytokine markers between the HFD group and the GFP-treated groups revealed that GFP significantly alleviated the inflammatory response caused by HFD.
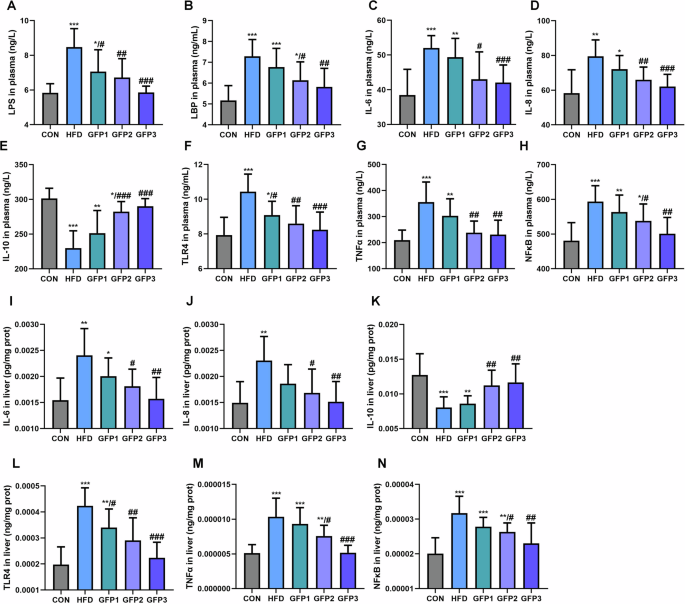
A LPS level in plasma. B LBP level in plasma. C–H Inflammatory cytokines in plasma. I–N Inflammatory cytokines in liver. *p < 0.05; **p < 0.01; ***p < 0.001 when compared to CON group; #p < 0.05; ##p < 0.01; ###p < 0.001 when compared to HFD group.
Figure 7 presents the levels of oxidative stress markers in the mice. Reduced GSH/GSSG ratio and increased MDA levels were observed in the plasma and the liver of HFD-treated mice. In addition, the T-AOC level and the activities of antioxidant enzymes, including SOD, CAT, and Gpx, in the plasma and the liver were significantly lower in the HFD-treated group compared to the CON group. GFP administration significantly remitted these effects of HFD on oxidative stress and antioxidant enzyme activity in the mice.
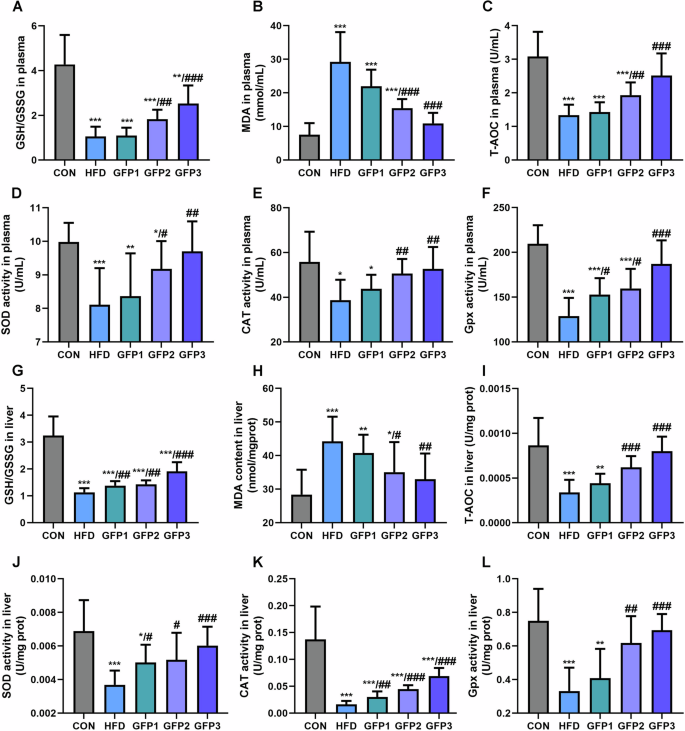
A The GSH/GSSG ratio in plasma. B The MDA level in plasma. C The T-AOC in plasma. D–F The activity of antioxidant enzymes in plasma. G The GSH/GSSG ratio in liver. H The MDA level in liver. I The T-AOC in liver. J–L The activity of antioxidant enzymes in liver. *p < 0.05; **p < 0.01; ***p < 0.001 when compared to CON group; #p < 0.05; ##p < 0.01; ###p < 0.001 when compared to HFD group.
Further, no significant difference was noted in the protein levels of total Nrf2 in the liver among the experimental groups. The protein level of Nrf2 in the nucleus, however, was significantly decreased in the HFD group compared to the CON group. In the GFP-treated groups, GFP significantly increased the nuclear expression of Nrf2 protein compared to that in the HFD group (Fig. 8A–C). In addition, HFD treatment significantly downregulated the mRNA expressions of antioxidant-related genes, including glutathione peroxidase 1 (Gpx-1), heme oxygenase 1 (Ho-1), and NAD(P)H quinone dehydrogenase 1 (Nqo1), in the Nrf2/Antioxidant response element (ARE) pathway (Nrf2/ARE) compared to the CON group. In the GFP-treated groups, GFP significantly upregulated the mRNA expressions of the above genes compared to the HFD group (Fig. 8D–F).
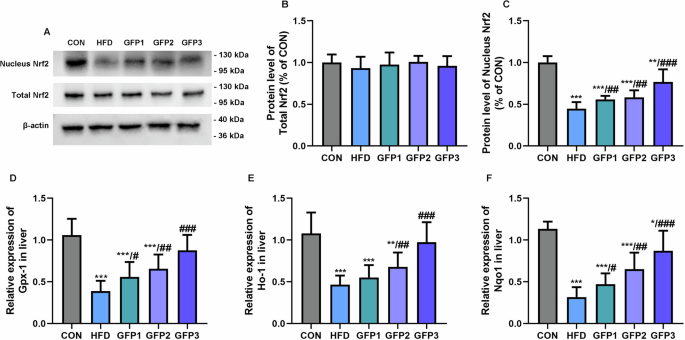
A–C The protein level of total and nucleus Nrf2 in liver. D–F The mRNA expression of antioxidant-related genes in the Nrf2/ARE pathway in liver. *p < 0.05; **p < 0.01; ***p < 0.001 when compared to CON group; #p < 0.05; ##p < 0.01; ###p < 0.001 when compared to HFD group.
Effects of GFP on the colonic barrier in mice
The mRNA expression of the cluster of differentiation 14 (CD14) was significantly upregulated in the colon of the HFD group mice compared to the CON group mice. In regard to the genes associated with the tight junctions responsible for the colonic barrier, the mRNA expressions of zonula occludens-1 (ZO-1), occluding, and claudin3 were significantly downregulated in the colons of HFD group mice compared to the CON group mice. The comparison of the mRNA expressions of the above genes between the HFD group and the GFP-treated groups revealed that GFP remitted the colonic barrier damage caused by HFD (Fig. 9A–D). The histopathological results revealed the inflammatory cell infiltration and thinning of the colonic wall in the colon of HFD group mice. GFP alleviated the inflammatory damage induced in the colonic mucosa by HFD (Fig. 9E).
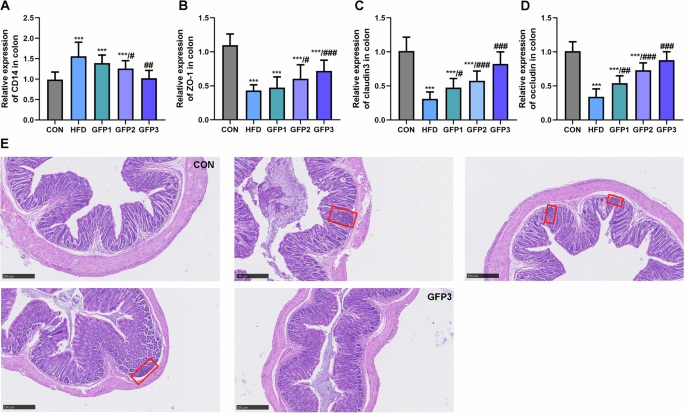
A The mRNA expression of CD14 in colon. B–D The mRNA expression of tight junction-related genes in colon. E H&E staining of colon section (inflammatory cells are indicated by the red boxes) (100×, scale bar = 250 µm). ***p < 0.001 when compared to CON group; #p < 0.05; ##p < 0.01; ###p < 0.001 when compared to HFD group.
Discussion
Recently, edible fungi polysaccharides have been considered a feasible option for the treatment of IR26. Mechanistic studies have revealed that gut microbiota and the associated inflammatory pathways could be the target sites and key pathways involved in the regulation of the insulin sensitivity of polysaccharides27. In this study, a polysaccharide extracted from Grifolia grifolia was selected as the research object. After impurity removal and purification, its chemical properties and composition was analyzed, and then its effect on the gut microbiota of HFD-induced IR mice was studied.
Previous studies have demonstrated that the biological functions of polysaccharides are closely related to their structural characteristics, including their Mw, monosaccharide composition, glycosidic bonds, and branch chain characteristics28. In the present study, the molecular weight of the purified GFP-N1 was 3.323 × 10³ kDa. A polysaccharide with a greater molecular weight has a larger volume, which then significantly affects the absorption and utilization of the polysaccharide in the intestine. On the other hand, if the molecular weight is quite low, the polysaccharide does not form stable active structures and, therefore, exhibits reduced physiological activity29. Geng et al. reported that the daily administration of the polysaccharide extracted from Abelmoschus esculentus L. Moench (Mw: 3.02 × 10³ kDa), which was similar to the Mw of the polysaccharide isolated and evaluated in the present study, exerted a hypoglycemic effect on type 2 diabetic mice17. According to this similarity in the Mw of the two polysaccharides, it was speculated that the GFP evaluated in the present study might also exhibit good biological activity.
In addition, different monosaccharide compositions have a great influence on the properties of polysaccharide. The two most abundant monosaccharides, namely, galactose and glucose, were detected in the GFP-N1. The three most abundant monosaccharides, namely, galactose, glucose, and mannose, were detected in the GFP-N2. According to previous studies, most fungus polysaccharides with anti-inflammatory activity were reported to have 1 → 3, 1 → 4, and 1 → 6 glycosidic bonds30. Previous study confirmed that gut microbiota significantly increases the production of SCFA, such as butyrate and propionate, via targeted hydrolysis of polysaccharide 1 → 3, 1 → 4, and 1 → 6 glycosidic bonds, thus enhancing anti-inflammatory ability31. Therefore, we speculated that the GFP mainly exists in the form of β-glucan, as evidenced by its high glucose content and 1 → 3, 1 → 4 and 1 → 6 glycosidic bonds. β-glucan is known for its high-water solubility, which gives rise to an irregular linear structure that inhibits intermolecular association32. Previous studies have confirmed that mixed-linkage β-glucan could actively impact gut microbiota33,34. In particular, β-glucan with higher Mw is able to alter the gut microbiota composition, and the shifts observed is positively associated with an improved metabolic diseases risk factor profile35. In the present study, GFP contained these special structural characteristics, corroborating that this GFP might also have good physiological activity.
Subsequently, C57BL/6 mice were fed an HFD to construct an IR model, and GFP intervention was performed to elucidate the effect of GFP on IR in mice. IR is a chronic metabolism syndrome characterized by disordered glucose and lipid metabolism36. In the insulin-regulated glucose metabolism pathway, INSR plays an essential role in the insulin-induced Glut4 translocation and glycogen synthesis in the liver37. Glut4 is phosphorylated by Gck, and this process is closely related to glucose transport and glycolysis38. This research showed that GFP could not reduce the daily energy intake of mice fed with HFD, but could ameliorate the excessive weight gain caused by HFD, indicating that GFP could significantly improve the efficiency of energy metabolism and accelerate the consumption of energy substances, such as saccharides and fats. In addition, the result in this study confirmed that the GFP might be ameliorating the disorder in the glucose metabolism induced by HFD by influencing the insulin signaling pathway. In addition, the GFP considerably decreased the abnormal levels of the indicators of lipid metabolism and reduced steatosis and vacuolar degeneration in the liver. In the signaling pathways related to lipid metabolism, GK encodes a key enzyme that catalyzes the phosphorylation of glycerol using ATP to generate ADP and glycerol 3-phosphate39. PPARα is related to insulin sensitivity40, which further regulates the expressions of several genes associated with lipid metabolism, such as Srebp1c41. Srebp1c plays an important role in lipogenesis and induces the transcription of genes required for fatty acid synthesis, including fatty acid synthase (Fas) and acetyl-CoA carboxylase 1 (Acc1)42. Fas is a key enzyme that governs the rate of fatty acid synthesis43, and Acc1 is the rate-limiting enzyme in the biogenesis of long-chain fatty acids44. The results of the present study revealed GFP might be improving lipid metabolism by ameliorating the HFD-induced changes in the expression of the above-mentioned genes related to lipid metabolism. According to the above results, GFP regulated IR in the HFD-fed mice.
In previous studies, it was demonstrated that HFD induced IR through the promotion of the imbalance in the gut microbiota45. Colonic microbiota dysbiosis manifests as an increased F/B, and this ratio is negatively associated with glucose metabolism and lipid metabolism46. In the present study, the colonic flora in the HFD-fed mice had a higher content of Firmicutes and a lower content of Bacteroidota, and a higher F/B ratio was observed, which was confirmed by the abnormal symptoms related to glucose and lipid metabolism in the mice fed with HFD. The data of this study reveal that GFP may alleviate the disturbance of glucose metabolism and lipid metabolism by improving the F/B imbalance caused by HFD. Additionally, it has been suggested that the gut microbiota influence the onset and development of IR primarily by secreting metabolites, such as SCFAs, and activating pro-inflammatory or anti-inflammatory signaling pathways6,47.
SCFAs have been demonstrated to play important roles in regulating host cellular metabolism, and their effect on insulin pathway is a concern48. Studies have confirmed that propionate promotes gluconeogenesis in the liver, while butyrate and acetate reduce fat deposition49,50. Several studies suggested that SCFAs have a direct role in the regulation of T cells in both the gut and peripheral tissues51, while T cells are central regulators of tissue inflammation, and their numbers are decreased in visceral adipose tissue from people with IR52. Systemic inflammation is strongly associated with IR53. In the present study, GFP was confirmed to significantly increase the levels of acetic acid, propionic acid, butyric acid, isobutyric acid, valeric acid, isovaleric acid, propionic acid, and hexanoic acid in vivo, which further suggested that GFP regulates the insulin pathway through alterations in the colonic flora.
The disturbance in the gut microbiota communities also facilitated an increase in inflammation. Firmicutes are recognized as pro-inflammatory gut microbiota and are reported to be positively correlated to the levels of LPS, IL-6, and TNF-α54. Verrucomicrobiota is a gut microbiota member that is reported to be beneficial in decreasing inflammation55. In the present study, the increased inflammatory response induced by HFD was alleviated upon GFP administration, which could be attributed to the GFP-induced selective decreases and increases in the colonic microbiota. Accordingly, it was speculated that GFP alleviated the increased levels of inflammatory cytokines induced by HFD through changes in the gut flora, which ultimately improved glucose and lipid metabolism.
Several studies have confirmed that a disturbance in the gut microbiota and decreased levels of SCFAs induce an inflammatory response56. LPS is produced by gram-negative bacteria, and after transporting into the bloodstream, it binds to the LBP along with the CD14 receptor to form the LPS-LBP-CD14 complex57. Later, this complex combines with TLR4 and activates NFκB. Subsequently, the complex stimulates the secretion of inflammatory cytokines, including IL-6, IL-8, and TNFα58. SCFAs, particularly acetic acid, propionic acid, and butyric acid, have been reported to inhibit LPS-induced inflammation by restraining TNFα secretion, inhibiting the activity of NFκB, reducing the production of pro-inflammatory factor IL-6 and up-regulating of the expression of anti-inflammatory factor IL-1059,60,61. In the present study, the levels of LPS and LBP were observed to be significantly increased in the plasma of HFD-fed mice. In addition, the relative expression of the CD14 mRNA was significantly increased in the colon of HFD-fed mice. GFP administration then effectively reduced these changes induced by HFD, which suggested that GFP might have an alleviating effect on the HFD-induced activation of the LPS inflammatory pathway.
Moreover, infiltration of inflammatory cells was detected in the colon of HFD-fed mice in this study, which may further affect the barrier function of colonic epidermal cells62. Disruption of the barrier is referred to as leaky gut wall syndrome and seems to be characterized by the release of bacterial metabolites and endotoxins into the circulation, such as LPS63. In this study, significant downregulation of the mRNA expressions of ZO-1, occludin, and claudin3 was noted in the colons of HFD-fed mice, which suggested that high levels of inflammation damage the colonic barrier and promoted the transport of LPS from the colonic lumen into the bloodstream. Several previous studies have reported that LPS specifically activates the TLR4 inflammatory pathway and regulates IR64,65. Numerous studies have confirmed that two mechanisms are important for the execution of the effect of the LPS/TLR4 inflammatory pathway on insulin signaling. The first mechanism involves the promotion effect of the LPS/TLR4 inflammatory pathway on NFκB, which is an important factor for the regulation of inflammation and IR66. The other mechanism involves LPS/TLR4 activation in adipocytes, leading to the promotion of the expressions of inflammatory cytokines, such as TNFα and IL-6, which also causes systemic IR67. Therefore, the results of the present study suggested that GFP improved HFD-induced inflammation through the downregulation of the LPS/TLR4 inflammatory pathway.
LPS/TLR4-induced oxidative stress is considered a key factor in promoting inflammation68,69. In the present study, HFD-induced oxidative stress was significantly remitted by GFP, as evident by the decreased MDA levels and an elevated GSH/GSSG ratio. In addition, GFP significantly increased the antioxidant capacity of HFD-treated mice, as evident by the T-AOC levels, the activities of antioxidant enzymes, and the mRNA expression of the Nrf2/ARE antioxidant signaling pathway. Among all antioxidant-related pathophysiological pathways, the Nrf2/ARE signaling pathway is recognized as an important cellular mechanism70. The ARE is situated in the promoter region of the antioxidant-related genes encoding enzymes, including Gpx-1, Ho-1, and Nqo171. Under normal physiological conditions, Nrf2 is bound to Kelch-like ECH-associated protein-1 (Keap1) and it binds to the actin cytoskeleton in the cytoplasm. When the cells are under stress induced by electrophilic groups, such as ROS, Nrf2 dissociates from Keap1 and is transported to the nucleus, where it binds to the ARE sequences and activates the transcription of the antioxidant-related genes72. However, under the conditions of severe oxidative stress, the translocation of Nrf2 from the cytoplasm to the nucleus is inhibited73. In the present study, the transport of Nrf2 from the cytoplasm to the nucleus was reduced by HFD, which led to the downregulation of the transcriptional activities of the antioxidant genes involved in the Nrf2/ARE pathway. In the Nrf2/ARE pathway, Gpx-1 belongs to the glutathione peroxidation family, which catalyzes the reaction involving the reduction of hydroperoxides by glutathione74. Ho-1 catalyzes the degradation of heme into biliverdin, free iron, and carbon monoxide, thereby exhibiting antioxidant and anti-inflammatory activities75. Nqo1 is a flavoprotein that catalyzes the two-electron reduction of quinone into hydroquinone via NADH, thereby serving as a scavenger of ROS76. The decrease of Nrf2 transport and downregulation of Nrf2/ARE signaling pathway genes expression induced by HFD were significantly mitigated by GFP treatment. These findings confirmed that the oxidative stress noted after the administration of HFD was significantly remitted by GFP. Furthermore, the Nrf2/ARE signaling pathway reportedly protects cells from oxidative damage during the inflammatory response and reduces the expressions of inflammation-associated cytokines77. Therefore, the results obtained in the present study further confirmed that GFP regulates the insulin pathway by inhibiting oxidative stress, which is closely related to the inflammatory response.
Materials and methods
Purification of GFP
The crude GFP was purchased from Hangzhou Huqingyutang Traditional Chinese Medicine Co. Ltd. The purification process is operated as shown in Fig. 10A. Firstly, impurities was removed from crude polysaccharides. Papain was added to remove protein and petroleum ether was added to remove fat. Microporous resin AB-8 was utilized to remove pigment. This was followed by dialysis (3000 Da) against water. The purified GFP was collected for animal experiment.
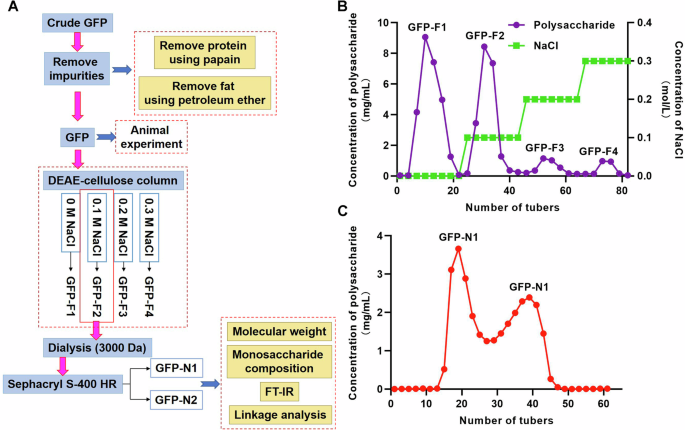
A The purification process of GFP. B The polysaccharide eluted by distilled water and NaCl solution using DEAE-cellulose column. C The polysaccharide eluted by Sephacryl S-400 HR.
Preliminary separation was performed using the DEAE-cellulose column (26 mm × 400 mm). Sequential elution was performed using distilled water followed by NaCl solution at the concentrations of 0.1, 0.2, and 0.3 M. The flow rate was 1 mL/min. The polysaccharide eluted by distilled water and NaCl solution were named GFP-F1, GFP-F2, GFP-F3 and GFP-F4 respectively (Fig. 10B). Different fractions were collected and evaluated for the carbohydrate content using the phenol-sulfuric acid method. The main polysaccharide fractions were concentrated and subjected to dialysis (3000 Da) against distilled water for 72 h. Next, the GFP-F2 sample was loaded onto Sephacryl S-400 HR (26 mm × 1000 mm), followed by elution with distilled water at a flow rate of 1.0 mL/min. After the main peak solution was enriched, it was dialyzed and dried to obtain GFP-N1 and GPF-N2 (Fig. 10C). The total sugar content was measured by using the phenol-sulfuric acid method.
Structural analysis for GFP
Molecular weight (Mw) determination
The molecular weight of GFP-N1 and GPF-N2 was determined using the Hu’s method78. The samples were dissolved in 0.1 M NaNO3 containing 0.02% NaN3 at the concentration of 1 mg/mL, followed by filtration through a 0.45-µm pore size filter. The homogeneity and Mw were determined using the SEC-MALLS-RI. DAWN HELEOS-II laser photometer (Wyatt Technology Co., USA) equipped with two tandem columns (300 × 8 mm, Shodex OH-pak SB-805 and 803; Showa Denko K.K., Japan).
A differential refractive index detector (Optilab T-rEX, Wyatt Technology, USA) was connected to determine the concentration of fractions and the dn/dc value. The dn/dc value of the fractions in the 0.1 M NaNO3 containing 0.02% NaN3 was determined to be 0.141 mL/g. The data were acquired and processed using ASTRA6.1 (Wyatt Technology, USA).
Monosaccharide composition analysis
The monosaccharide composition of GFP-N1 and GPF-N2 was determined using the Zhu’s method79. The sample was hydrolyzed through 2 h of treatment with trifluoroacetic acid (2 M) at 121 °C inside a sealed tube. Afterward, the samples were dried using nitrogen, and methanol was added for washing. The final residue was re-dissolved in deionized water and then filtered through a 0.22-µm microporous filtering film for use in measurements.
The sample were analyzed through high-performance anion-exchange chromatography (HPAEC) using a CarboPac PA-20 anion-exchange column (3 × 150 mm; Dionex) and a pulsed amperometric detector (PAD; Dionex ICS 5000+ system, USA). The data were acquired using ICS5000+ (ThermoScientific, USA) and processed using Chromeleon 7.2 CDS (ThermoScientific, USA).
Fourier transform infrared (FT-IR) spectra analysis
The FT-IR spectra of GFP-N1 and GPF-N2 were obtained using a spectrometer (Nicolet iZ-10, Thermo Nicolet, USA). The samples were mixed with KBr powder and then pressed into 1 mm pellets for use in the FT-IR analysis, for which measurements were conducted in the range of 4000 to 400 cm-1.
Methylation analysis (linkage analysis)
Methylation analysis of GFP-N1 and GPF-N2 was performed according to the Yang’s method with a slight modification80. The polysaccharide sample was dissolved in DMSO and was methylated in DMSO/NaOH containing CH3I. The permethylated products were hydrolyzed through 1.5 h of treatment with 2 mol/L TFA at 121 °C, followed by reduction using NaBD4 and acetylation using acetic anhydride for 2.5 h (100 °C). The acetates were dissolved in chloroform and then subjected to the GC-MS analysis using Agilent 7890 A (Agilent Technologies, USA) equipped with Agilent BPX70 chromatographic column (30 m × 0.25 mm × 0.25 µm, SGE, Australia). In this analysis, high-purity helium (split ratio 10:1) was used as the carrier gas at an injection volume of 1 µL. The GC system was connected to the Agilent 5977B quadrupole mass spectrometry system (MS, Agilent Technologies, USA). The MS analysis was performed at an initial temperature of 140 °C for 2.0 min, after which the temperature was increased at a rate of 3 °C/min until it reached 230 °C, which was maintained for 3 min. The MS system was equipped with an electron bombardment ion source and a MassHunter workstation. The ion source was used for analyte detection in full scan (SCAN) mode within the range of 50 to 350 m/z.
The effects of GFP on HFD-induced IR mice
Animals and sample collection
The present study was performed according to the Chinese guidelines for animal welfare and experimental protocol and the U.K. Animals (Scientific Procedures) Act, 1986 and associated guidelines. Specific Pathogen-Free male C57BL/6 mice (4 weeks old, 18 ± 2 g) were procured from GemPharmatech Biotechnology Co. Ltd. (Nanjing, China). All animals were housed in a controlled-environment facility in the Experimental Animal Center at Zhejiang Academy of Agricultural Sciences (Hangzhou, China, ethical approval code: 2022-1945). An ambient temperature (20-24 °C) and 40-60% relative humidity were maintained inside this animal facility. The photoperiod inside the facility was set to a 12-h/12-h light-dark cycle. All mice were allowed free access to food and pure drinking water throughout the experiment.
After 7 days of acclimatization, the mice were fed with a normal diet (fat energy supply ratio: 20%, gross energy: 3530 kcal/kg, n = 8) or a high-fat diet (HFD, fat energy supply ratio: 60%, gross energy: 5,127 kcal/kg, n = 32) for 6 weeks to establish the IR model (Fig. 2A). GFP was previously reported an anti-inflammatory effect in diabetic nephropathy individuals at the dose of 100 mg/kg BW/day23. Thus, the mice were randomly divided into the following five groups (n = 8): control group (CON), which received a normal diet and a daily intragastric administration of saline solution (0.9% NaCl); HFD group, which received HFD and a daily intragastric administration of saline solution; GFP1 group, which received HFD and a low dose of GFP (100 mg/kg BW/day); GFP2 group, which received HFD and a medium dose of GFP (200 mg/kg BW/day); GFP3 group, which received HFD and a high dose of GFP (300 mg/kg BW/day).
After 19 weeks (13 weeks of GFP or saline administration), the mice were subjected to 12 h of fasting followed by exposure to isoflurane anesthesia for 5 min. Blood samples were collected from the orbital sinus and stored in tubes containing an anticoagulant. Plasma was separated from these blood samples through centrifugation at 1570 × g for 10 min at 4 °C. All mice were sacrificed through cervical dislocation, and the livers and colons were dissected based on the characteristic morphological features. The contents of the colon were also collected.
Gut microbiota profile analysis and identification of short-chain fatty acids (SCFAs) in samples
The profiles of the flora were obtained based on the 16S rDNA sequencing results. The total genomic DNA was extracted using the E.Z.N.A. Stool DNA Kit (D4015, Omega INC., USA). The elution of the total DNA was performed using 50 µL elution buffer. The extracted total DNA was analyzed using PCR method. The GC-MS system comprising an Agilent 7890B gas chromatograph coupled with an Agilent 5977B mass spectrometer (Agilent Technologies, USA) was employed to analyze the SCFAs.
Measurement of glucose and lipid metabolism index
At the end of the experimental period, the mice were evaluated for glucose tolerance. Each mouse was administered 2 g/kg BW of glucose via gavage. Blood samples were collected from the tail vein at different time points of 0, 10, 30, 60, 90, and 120 min after the glucose gavage. Blood glucose was then evaluated using the One Touch Sure Step test strip (Lifescan, USA). The area under the glucose curve (AUC) indicated the level of glucose tolerance. The plasma insulin concentration of the blood samples was measured using Enzyme-linked immunosorbent assay (ELISA) kits (Huijia Biotechnology, China). The homeostatic model assessment index of insulin resistance (HOMA-IR) was calculated using the following equation81:
The levels of total cholesterol, triglyceride, high-density lipoprotein cholesterol (HDL-C), and low-density lipoprotein cholesterol (LDL-C) in the plasma samples were quantified using the corresponding kits (Jiancheng Bioengineering Institute, China).
Histopathological analysis
The liver samples and colon samples were fixed in 10% formaldehyde phosphate buffer for 24 h, followed by embedding in paraffin. Hematoxylin and eosin (H&E) staining was performed on 5 µm serial sections for the histopathological analysis.
Oxidative stress and inflammatory index measurements
The activities of antioxidant enzymes (superoxide dismutase (SOD), catalase (CAT), and glutathione peroxidase (Gpx)), malondialdehyde (MDA) content, total antioxidants (T-AOC) level, reduced glutathione (GSH) content, and oxidized glutathione (GSSG) content were measured using the corresponding kits (Jiancheng Bioengineering Institute, China). The levels of tumor necrosis factor α (TNF-α), interleukin-6 (IL-6), interleukin-8 (IL-8), interleukin-10 (IL-10), nuclear factor κB (NFκB), and toll-like receptor 4 (TLR4) were determined using mice ELISA kits (Huijia Biotechnology, China). The total protein content was also measured using the corresponding kit (Beyotime Biotechnology, China).
RNA extraction and qRT-PCR
Total RNA was extracted using the Trizol reagent (Vazyme Biotech Co. Ltd., China) and quantified using a NanoDrop Spectrophotometer (ND2000, Thermo, USA). qRT-PCR was performed using the SYBR green-based qRT-PCR kit along with the 7900HT instrument (Applied Biosystems, USA). Gene expressions were determined as described in previous studies using the 2–ΔΔCT method64. The primer sequences for the evaluated genes are listed in Supplementary Table 1. The relative expression of each gene was expressed as a ratio of its expression to the expression of the housekeeping gene β-actin.
Protein extracts and western blot analysis
Protein was extracted from the nucleus and cytoplasm of the liver using the Nuclear and Cytoplasmic Protein Extraction Kit (Biosharp, China). The total protein was extracted using RIPA lysis buffer (Biosharp, China) and detected by western blotting using the Song’s method82. The primary antibodies (ProteinTech, China) used in the present study included NF-E2-related factor 2 (Nrf2) (1:2000, 80593-1-RR) and β-actin antibody (1:5000, 81115-1-RR) were used for incubation at 4 °C for 10 h. The protein blots were then incubated with the IgG-horseradish peroxidase-conjugated secondary antibody (1:5000, PR30009). The fluorescence images of the blots were obtained with the Molecular Imager ChemiDocTM XRS+ Imaging System (Bio-Rad, USA). The ImageJ software was employed to quantitative analysis the target protein signals.
Statistical analysis
All experimental data were expressed as means ± standard deviations. The data were subjected to a one-way analysis of variance (ANOVA) using SPSS 22.0. Duncan’s multiple range test was then conducted for all statistical comparisons among groups. The significance level was set at p < 0.05.
GFP was extracted from G. frondosa, which is composed of glucose, galactose, and mannose. The main glycosidic linkages between the monosaccharides of this GFP are 1 → 2, 1 → 3, 1 → 4, and 1 → 6 glycosidic bonds. The GFP improved IR symptom in HFD-fed mice. The mechanisms underlying the effect of GFP in IR subjects could involve the regulation of the gut microbiota and the LPS/TLR4 inflammatory signaling pathway. The findings of the present study suggested that GFP is suitable for consideration as a diet supplement for the management of IR.

Responses