Subcellular proteomics and iPSC modeling uncover reversible mechanisms of axonal pathology in Alzheimer’s disease
Main
A major hallmark in Alzheimer’s disease (AD) is the accumulation of aggregated extracellular β-amyloid (Aβ) peptide deposits1. However, the mechanisms by which these deposits trigger neuronal changes and contribute to cognitive deficits remain unclear. Amyloid plaques are known to cause synapse loss2 and dendritic spine reduction in their vicinity3, but a less understood and potentially critical feature is the formation of axonal spheroids around plaques. Hundreds of axons, but not dendrites, near individual plaques develop enlarged spheroid-like structures (traditionally termed dystrophic neurites)4,5,6,7,8,9,10. These plaque-associated axonal spheroids (PAASs) correlate well with AD severity4,11, disrupt axonal electrical conduction4,12,13, impair neuronal networks4 and may contribute to cognitive decline. PAASs contain enlarged, enzyme-deficient endolysosomal vesicles4,14,15,16 and autophagosomes15,17. Spheroid enlargement may result from the accumulation of these vesicles4 and disruption of axonal cytoskeleton and transport16,18,19,20,21,22. Ultimately, the presence of axonal spheroids may further impair axonal trafficking, leading to downstream synaptic dysfunction and axonal degeneration3,23,24,25. Additionally, PAASs may contribute to the propagation of tau pathology through neuronal networks26. Thus, PAASs may represent a critical neuropathological hub, driving circuit disruption and proteinopathy and contributing to cognitive decline in AD3,4,12,13,23,27.
Axonal spheroids can form as a result of a variety of insults and are observed across acute neural injuries and age-related neurodegenerative conditions. Although they share morphological and subcellular cytoskeletal and organelle features, including the accumulation of proteins such as amyloid precursor protein (APP) and cathepsins14,22, mechanistic differences exist given the diversity of pathological processes involved. In neural injury models, spheroid formation involves cytoskeletal disruption, membrane tension changes22,28 and phosphatidylserine exposure, leading to glial phagocytosis22,29. In contrast, in AD, PAASs persist for very long intervals without significant glial clearance4,30,31,32.
Despite these observations, PAASs have not been a major focus of mechanistic investigations, and the cell biological processes underlying their formation remain poorly understood. In the present study, we developed a proteomics approach to investigate the molecular composition of PAASs, by employing proximity labeling to selectively isolate the subcellular proteome of PAASs in human postmortem and mouse brains. This analysis revealed protein turnover, cytoskeleton dynamics and lipid transport as key biological processes in PAASs. Additionally, we identified hundreds of previously unknown proteins and signaling pathways expressed in PAASs, some of which could play important roles in their formation.
To investigate the structural dynamics, functional consequences and reversibility of PAASs, we established a human induced pluripotent stem cell (iPSC)-derived AD model that recapitulates PAAS pathology. This model enabled longitudinal imaging and optical electrophysiology, revealing patterns of spheroid growth and action potential conduction disruption. To further examine the mechanisms driving spheroid growth, we focused on the mTOR signaling pathway, identified through PAAS proteomics and confirmed to be expressed within PAASs in vivo. Genetic and pharmacological inhibition of mTOR in iPSC neurons and in mice led to marked reduction in PAAS pathology. As mTOR is a master regulator of protein turnover, lipid metabolism and axonal cytoskeletal remodeling33,34,35, these findings highlight the importance of these biological processes in PAAS formation.
Altogether, the integration of subcellular proteomics in postmortem human brain, human iPSC AD modeling and molecular manipulation of PAASs in human neurons and mice provides new insights into the complex cell biology and reversibility of axonal pathology in AD.
Results
Proximity labeling of axonal spheroids in AD human brains
Proximity labeling is a methodology used to biotinylate proteins within specific cellular or subcellular compartments using genetic expression of localized peroxidases or biotin ligases36,37,38,39,40, enabling the selective protein biotinylation, isolation and identification of proteomes using liquid chromatography with tandem mass spectrometry (LC–MS/MS)41,42. Recently, this approach was adapted for fixed tissues by targeting subcellular compartments with horseradish peroxidase (HRP)-conjugated antibodies, enabling localized protein biotinylation43,44,45,46. Leveraging these advancements, we devised and refined an antibody-based proximity labeling approach to characterize the PAAS proteome in postmortem AD human brains and 5×FAD mice (Fig. 1, Extended Data Figs. 1 and 2, Supplementary Figs. 1 and 2 and Supplementary Movie).
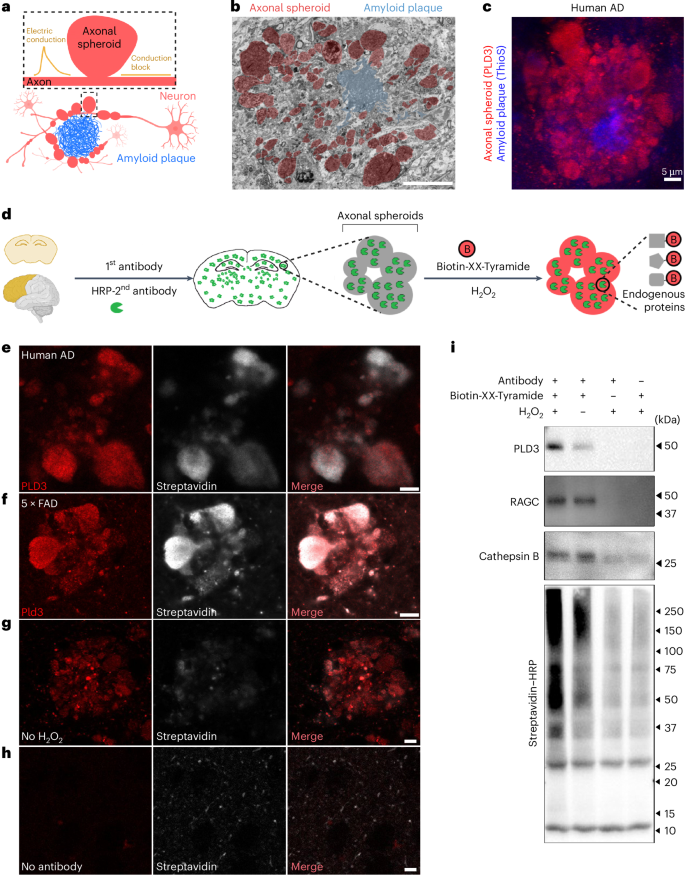
a, Schematic showing axons with spheroids (red) around an amyloid plaque (blue). Spheroids disrupt axonal electric conduction, causing delays and blockages4. b, FIB/SEM image of a 5×FAD mouse brain showing spheroids (red) around an amyloid plaque (blue). Scale bar, 20 μm. Related to Supplementary Movie. c, Immunofluorescence confocal deconvolved image demonstrating that PLD3 is highly enriched in axonal spheroids (red, PLD3) around amyloid plaques (blue, thioflavinS) in postmortem AD human brain. d, Schematic of the pipeline for proximity labeling PAAS proteomics in postmortem brains. AD human or mouse brain sections were incubated with a primary antibody against PLD3 and an HRP-conjugated secondary antibody, followed by a biotinylation reaction in the presence of Biotin-XX-Tyramide and H2O2. e–h, Proximity labeling biotinylation of proteins within PAASs: human AD brains (e) and 5×FAD mouse brains (f). e,f, Biotinylated proteins were visualized using streptavidin–Alexa Fluor 647. g,h, Control conditions include no-H2O2 (g) or no-antibody labeling (h), both of which showed markedly reduced biotinylation. Scale bar, 5 μm. i, Streptavidin–HRP western blot showing efficient streptavidin bead pulldown of biotinylated proteins, including PLD3 (protein bait) and known axonal spheroid proteins RAGC and cathepsin B. See also Extended Data Figs. 1 and 2 and Supplementary Figs. 1 and 2.
Our approach was based on the observation that phospholipase D3 (PLD3), an endolysosomal protein, is highly abundant within PAASs (Fig. 1c and Extended Data Fig. 1e–g)4,47,48,49,50, specifically expressed in neurons4,47 and absent in glial cells4. Although low levels of PLD3 are found in neuronal cell bodies (Extended Data Fig. 1), quantitative immunofluorescence demonstrated that most PLD3 originates from PAASs (Extended Data Fig. 1g). Leveraging this finding, we used PLD3 as a protein bait for proximity labeling proteomics of PAASs. This involved sequential incubation of postmortem AD human or mouse brains with a primary antibody against PLD3 and an HRP-conjugated secondary antibody, followed by a peroxidation reaction with H2O2 and Biotin-XX-Tyramide (Fig. 1d). This process resulted in robust biotinylation of proteins within PAASs, confirmed by streptavidin labeling with minimal background outside axonal spheroids (Fig. 1e–h). To validate the spatial precision of proximity labeling, we employed stimulated emission depletion (STED) super-resolution imaging, which confirmed the high precision of proximity biotinylation of axonal spheroids (Extended Data Fig. 2). Additionally, to demonstrate subcellular specificity, we conducted parallel proximity labeling experiments using the neuronal nuclear and perinuclear cytoplasm marker NeuN as a protein bait (Extended Data Fig. 1c,d).
We also optimized the protein lysis method, significantly improving protein extraction efficiency compared to previous studies43. This protocol involved increased sodium dodecyl sulfate (SDS) concentration to 2% in basic Tris-HCl solution (pH 8.0), which enhanced protein extraction by effectively de-crosslinking proteins in fixed postmortem tissue (Supplementary Fig. 2a and Methods). Using this approach, we performed pulldown of biotinylated proteins and detected them via streptavidin–HRP western blotting. The analysis revealed a diverse array of proteins, including the baits PLD3 and NeuN as well as axonal spheroid proteins RAGC and cathepsin B (Fig. 1i and Supplementary Figs. 2b–d). Thus, the refined proximity labeling method provides a robust approach for isolating proteins enriched in axonal spheroids, enabling comprehensive proteomic profiling.
Proteomic analysis of plaque-associated axonal spheroids
To uncover the proteome of axonal spheroids, samples from individuals with AD and unaffected controls were processed for PLD3 proximity labeling protein biotinylation (Fig. 2a and Extended Data Fig. 3). Human frontal cortex postmortem samples were obtained from 39 individuals from the Yale Alzheimer’s Research Center (n = 8 AD and n = 2 control) and the Banner Sun Health Research Institute (n = 17 AD and n = 12 control), with detailed clinical and neuropathological data (Supplementary Fig. 1). Individuals with AD exhibited high amyloid plaque load, whereas controls had minimal or no plaque burden. For proteomics, we selected six individuals with AD (three females and three males) with the highest amyloid plaque burden (Supplementary Fig. 1c) and eight unaffected controls (three females and five males). An additional 25 AD cases (13 females and 12 males) and seven controls (two females and five males) were used for immunofluorescence validation.

a, Schematic of the technical pipeline for PAAS proteomic analysis. Gray matter regions with high plaque load were microdissected from brain sections from human AD; gray matter was also dissected from unaffected controls under a fluorescence stereomicroscope. b, Statistical pipeline used to identify PAAS proteomes in humans (related to Fig. 2c and Extended Data Fig. 1e–g). The same pipeline was applied to uncover PAAS proteomes in 5×FAD mice. c, Table showing statistical cutoffs and summary of identified proteomic hits in humans with AD and 5×FAD mice. The human PAAS proteome includes 821 proteins (all with FC > 1.95), whereas the mouse PAAS proteome includes 856 proteins (all with FC > 1.66). d, Volcano plot showing proteins that passed statistical cutoffs (orange dots) in humans with AD. The top 10 proteomic hits, with the lowest P values and highest FCs, are labeled by their gene names in black. Selected known PAAS proteins are highlighted as red dots with red gene names. Black dots among yellow ones represent proteins filtered out by the statistical pipeline (Fig. 2b) (see Supplementary Table 1 for the full list of proteomic hits). c,d, Quantification was performed two-sided. See also Extended Data Figs. 3–7 and Supplementary Figs. 3–6. Ctrl, control.
Proteomic analysis identified 2,360 proteins through a three-step process (Fig. 2b,c). First, non-specific protein binders to beads were removed by comparing PLD3-labeled samples to no-antibody controls, using cutoffs of P < 0.05, false discovery rate (FDR) < 0.1 and fold change (FC) > 1.5. To ensure data stringency, we compared normalized total precursor intensity (NTPI) and normalized total spectra count (NTSC) methods (Supplementary Fig. 3). This analysis identified 870 proteins (NTSC) and 965 proteins (NTPI) after applying these statistical cutoffs, with 849 proteins shared between the two methods, which were then used for downstream analysis. Second, we searched for glial cell–specific proteins and found only two, which were excluded from the dataset. Third, we aimed to exclude proteins specific to neuronal soma and neuropil, by comparing the proteomes of PLD3-labeled AD samples to unaffected controls, using P < 0.05 and FC > 1.5 or FC < 0.67. Given that the PLD3 labeling in controls originates from neuronal soma and neuropil (due to the absence of plaques), proteins with FC > 1.5 (98 proteins) represented those enriched in PAASs and/or broadly increased in AD. Proteins with FC < 0.67 (51 proteins) represented those specific to neuronal soma and neuropil and/or those decreased in AD. To increase stringency, proteins with FC < 0.67 were removed from the PAAS proteomic dataset (Fig. 2b). As a result, 821 proteins remained, representing the PAAS proteome in AD, all exhibiting an FC enrichment > 1.95 (Fig. 2b,c, Supplementary Figs. 4–6 and Supplementary Tables 1 and 2).
For comparative analysis, parallel experiments were conducted with 15-month-old 5×FAD mice (Extended Data Fig. 4). Using a similar proteomic strategy, we identified 856 PAAS proteins in mice (Fig. 2a–c, Extended Data Fig. 4a and Supplementary Table 1). All 856 proteins exhibited FC > 1.66 (Supplementary Table 1), with 476 overlapping between humans with AD and 5×FAD mice (Extended Data Fig. 4b). Proteomic analyses in both humans and mice revealed hundreds of proteins previously unknown to be expressed in PAASs, alongside those already reported (Fig. 2d, Extended Data Fig. 4a, Supplementary Fig. 6 and Supplementary Table 2).
Various controls ensured specificity, including additional proteomics using Lamp1 as a bait in 5×FAD mice, which detected 510 overlapping hits with PLD3 but also identified numerous glial-derived proteins (Extended Data Fig. 5), consistent with Lamp1 expression in glial cells. To confirm the robustness of proteomic hits, anti-biotin bead pulldown of biotinylated peptides produced results consistent with streptavidin bead pulldown (Extended Data Fig. 6). To further examine subcellular specificity, we used NeuN, a neuronal nuclei and perinuclear cytoplasm marker51, as a control bait. Unlike the PLD3-labeled PAAS proteome, the NeuN-labeled proteome showed distinct specificity to nuclei and neuronal soma (Extended Data Fig. 7 and Supplementary Table 1).
Uncovering key signaling pathways in axonal spheroids
To gain insights into the molecular mechanisms associated with axonal spheroid pathology, we conducted Gene Ontology (GO) annotation of biological process, molecular function and cellular component using the human PAAS proteomics dataset of 821 proteins, followed by pathway enrichment analysis. Results showed that proteomic hits were primarily associated with axons, synapses, cytoskeleton, lysosomes and proteasome complex (Fig. 3a and Supplementary Table 4). These findings reflect the axonal origin of PAASs and the accumulation of endolysosomal organelles, as shown by immunofluorescence and electron microscopy (Fig. 1b,c and Supplementary Movie)4,14. Many synapse-related proteins, such as the SNARE complex, are involved in both vesicle fusion and endolysosomal function. Because PAAS structures lack pre-synaptic and post-synaptic features (Supplementary Movie), SNARE complex proteins and other synapse-related signatures likely indicate vesicle fusion processes within the endolysosomal pathway.

a, Pathway enrichment analysis of the PAAS proteome in AD human brains. The Enrichment Map represents a network of pathways, with edges connecting pathways that share many genes. Node color reflects the FDR of each pathway. Theme labels were curated based on the main pathways of each subnetwork. Subnetworks with a minimum of four pathways connected by edges are shown. b, IPA pathway analysis of the PAAS proteome in humans with AD. Top-ranking CNS-related signaling pathways are shown. The signaling pathways are summarized as four modules. The alluvium plot shows color-coded modules connecting to the differentially expressed genes (DEGs), and the DEGs connect to the pathways that they are involved in. c, IPA pathways related to the three modules (synapse/vesicle fusion, protein turnover and cytoskeleton) with P < 0.01 are listed. Heatmaps indicate either the −log10 (P value) or the z-score of each signaling pathway (pathways with a z-score in red are predicted to be activated, whereas blue ones are predicted to be inhibited). d, Bar chart shows representative proteomic hits from the signaling pathways in c. Newly identified proteins are shown in red; known PAAS proteins are shown in black. n = 6 human AD brains and n = 8 unaffected human control brains were analyzed. Error bars indicate s.e.m. c,d, Quantification was performed two-sided. e, Representative immunofluorescence confocal images of newly identified proteins (red) expressed in spheroids (gray) in AD postmortem brains. Scale bar, 5 μm. Zoom-out images are shown in Supplementary Fig. 7. Quantification was performed in n = 10 AD human brains. Protein expression quantifications can be found in Supplementary Table 2. See also Extended Data Fig. 4 and Supplementary Fig. 7. Ctrl, control.
We performed signaling pathway analysis using the human PAAS proteome and found that 10 of the top 17 central nervous system (CNS)-related pathways involved three main modules, synapse/vesicle fusion, protein turnover and cytoskeleton (Fig. 3b), consistent with GO analysis findings (Fig. 3a). These included five pathways related to the cytoskeleton (for example, axonal guidance), three to synapse/vesicle fusion (for example, synaptogenesis) and two to protein turnover (for example, phagosome maturation) (Fig. 3b and Supplementary Table 5). Additional pathways included those related to synapse and vesicle fusion, such as clathrin-mediated endocytosis signaling and cytoskeleton growth and dynamics, such as actin cytoskeletal signaling and Rho family GTPase signaling (Fig. 3c). Pathways involved in protein turnover, including ubiquitination, autophagy and phagosome formation, were also identified. We also noted activation of the PI3K/AKT and mTOR pathways and inhibition of PTEN signaling (Fig. 3c), which have all been implicated in regulation of protein turnover and axonal growth52. Notably, subsets of proteomic hits from these pathways showed increased expression in humans with AD compared to controls (Fig. 3d).
To confirm the expression of proteomic hits in PAASs, we validated selected proteins from various pathways using high-resolution immunofluorescence confocal microscopy. These included proteins linked to synaptogenesis, vesicle fusion and calcium signaling (for example, SYT11 and CAMK2A) and cytoskeleton dynamics (for example, SPTBN1) (Fig. 3e, Supplementary Fig. 7 and Supplementary Table 2). A complete list of validated proteins is provided in Supplementary Fig. 6 and Supplementary Table 2. For immunofluorescence validation, we used SMI312 or PLD3 to visualize PAAS structures. SMI312, a neurofilament and pan-axonal marker, typically highlights axonal morphology but also accumulates in PAASs under AD conditions, reflecting cytoskeletal abnormalities. SMI312 is widely validated as a PAAS marker in pathological conditions15,16 and is particularly useful for co-localization studies with other antibodies. However, SMI312 is expressed in only a subset of spheroids14. Similarly, newly validated proteins from our proteomic dataset exhibited heterogeneous expression levels. This variability in protein expression within spheroids suggests a potential mechanistic sequence of events occurring at different stages of spheroid formation and growth.
We also conducted parallel PAAS proteomics analysis in 5×FAD mice. Similar to the human PAAS proteome, GO terms related to axon, cytoskeleton, SNARE binding, lysosome and endosome transport were identified (Extended Data Fig. 4c). Additionally, signaling pathways associated with synapse/vesicle fusion, protein turnover and cytoskeleton dynamics were captured in the 5×FAD mouse PAAS proteome (Extended Data Fig. 4d,e).
Lipid transport signaling is markedly upregulated in axonal spheroids
To investigate aberrant signaling in PLD3-labeled AD brains compared to controls, we performed gene set enrichment analysis (GSEA) (Fig. 4a and Supplementary Table 6). GSEA revealed significant upregulation of lipid transport–related biological processes (Fig. 4a,b). Top-ranked proteins associated with these processes included ATP8A1, C3, APOE, ATG9A, ATP8A2, TMEM30A, HEXB and HDLBP (Fig. 4c), all of which were identified in the PAAS proteome and increased in AD (Fig. 4d, related to Fig. 2b and Supplementary Fig. 6). Conversely, GSEA showed downregulation of ribosome, translation and RNA metabolism in PLD3-labeled AD brains compared to controls (Fig. 4a). Because PLD3-labeled signals in unaffected brains are derived from neuronal soma and neuropil, the downregulated processes in unaffected controls likely correspond to protein functions specific to these subcellular compartments.

a, GSEA was performed to compare PLD3-labeled proteins between humans with AD and unaffected controls. Pathway enrichment analysis was performed to cluster GSEA nodes. Each node represents a biological process or cellular component. The name of each cluster was curated based on the main GSEA biological processes and cellular components within each cluster. See also Supplementary Table 6. b, Detailed information on the lipid transport cluster. The biological process or cellular component of each node is listed. c, The eight top-ranked proteomic hits involved in the lipid transport cluster. The bar chart shows the FC and FDR of these hits by comparing PLD3-labeled humans with AD versus unaffected controls. d, Venn diagram showing that the eight top-ranked lipid transport–related proteins are shared between the human PAAS proteomes (821 proteins) and the AD upregulated proteins (98 proteins). A total of 75 proteins are shared between these two datasets. e,f, Representative zoomed-out (e) and zoomed-in (f) immunofluorescence confocal images of the top-ranked lipid-related proteomic hits in AD human brain, including C3, APOE, HDLBP, HEXB and TMEM30A. Scale bar, 5 μm. Zoomed-out images of all the proteins are shown in Extended Data Fig. 8. Quantification was performed in n = 3 AD human brains. Protein expression quantifications can be found in Supplementary Table 2. g, Representative immunofluorescence confocal images showing the anti-co-localized distribution of HDLBP (red) and the pan-axonal marker SMI312 (gray) within thickened axons in the AD human postmortem brain (n = 3). Scale bar, 5 μm. Ctrl, control.
To validate the enrichment of top-ranked lipid-related proteomic hits in PAASs, including APOE, HDLBP, C3, HEXB and TMEM30A, we performed immunofluorescence confocal imaging (Fig. 4e,f and Extended Data Fig. 8a). Notably, APOE, the strongest genetic risk factor for AD and a lipid transporter53, was among the top hits. We observed varying levels of expression of these proteins in axonal spheroids in AD human brains (Fig. 4e,f, Extended Data Fig. 8a and Supplementary Table 2). Complement C3 (C3), APOE and high-density lipid binding protein (HDLBP) exhibited the highest expression in axonal spheroids and aberrant axons around amyloid plaques, with much lower expression in axons away from plaques (Fig. 4e, Extended Data Fig. 8a and Supplementary Table 2). These proteins were also detected in cell bodies and in neuropil and plaque regions, aligning with their known distribution patterns (Extended Data Fig. 8a and Supplementary Table 2). Notably, HDLBP exhibited a distinct pattern of segregation within a subset of thickened axonal segments where the pan-axonal marker SMI312 was absent (Fig. 4g), suggesting that lipid metabolism dysregulation may precede spheroid enlargement. Regarding HEXB, which is primarily expressed in microglia in mice54, we found it expressed in PAASs and neuronal cell bodies in human brains (Extended Data Fig. 8b), consistent with human single-cell transcriptional profiles55.
mTOR signaling in axonal spheroids
The PAAS proteomics analysis highlighted the activation of the PI3K/AKT/mTOR axis within axonal spheroids (Fig. 3c and Extended Data Fig. 4e). This pathway is a master regulator of mRNA translation, metabolism and protein turnover35,52. Consistent with these roles, our proteomic analysis identified protein turnover, lipid metabolism and axonal cytoskeleton dynamics as prominent signatures (Figs. 3 and 4 and Extended Data Fig. 4d,e)33,34,35. Key proteins in the PI3K/AKT/mTOR axis were selected for validation. Among these, mTOR, RAGA (RRAGA), RAGC (RRAGC), LAMTOR1 and AKT1 were detected in the PAAS proteomes of humans and/or mice, whereas PIK3R4, RHEB and RAPTOR were not (Supplementary Fig. 6 and Supplementary Tables 1 and 2). Immunofluorescence staining confirmed the presence of all selected proteins in axonal spheroids in both postmortem AD human brains and 5×FAD mice (Fig. 5a). Proteins detected in the proteomes showed moderate to high immunofluorescence signals in PAASs, whereas those that were not detected exhibited moderate to low expression (Fig. 5a and Supplementary Table 2). Notably, phosphorylated-mTOR-S2448, a marker of mTOR activation, was expressed in axonal spheroids in AD human brains but not in unaffected controls (Fig. 5b–d). This finding suggests that phosphorylated-mTOR-S2448 may serve as a potential marker for disease progression. Overall, these results underscore the activation and involvement of the PI3K/AKT/mTOR axis in axonal spheroids in AD.
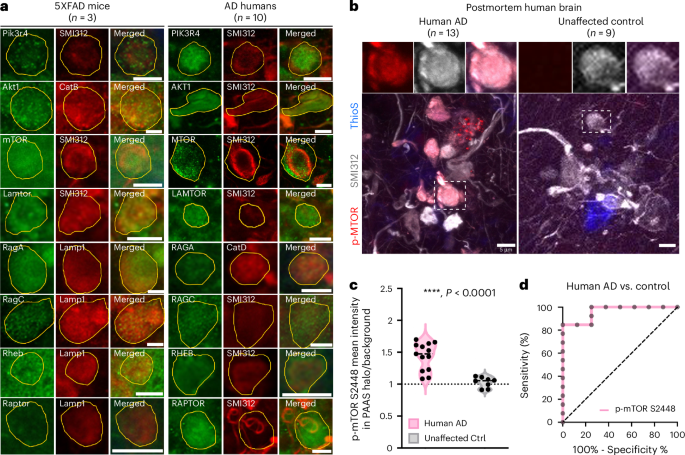
a, Immunofluorescence confocal imaging validation of selected proteomic hits and the related proteins in the PI3K/AKT/mTOR axis reveals that signaling molecules of this axis are expressed in PAASs in both humans with AD and 5×FAD mice. PAASs were labeled using traditional markers, including neurofilament SMI312, cathepsin B (CatB), cathepsin D (CatD) or Lamp1. PAASs are outlined in yellow. Scale bar, 5 μm. Protein expression quantification results can be found in Supplementary Table 2. b, Phosphorylated-mTOR-S2448 (red) is highly enriched within PAASs (gray, SMI312) around amyloid plaques (blue, thioflavinS) in advanced AD. Scale bar, 5 μm. c, Quantification of the mean fluorescence intensity levels of p-mTOR-S2448 within axonal spheroid halos normalized to background fluorescence, comparing humans with AD (n = 13 brains) and unaffected controls (n = 8 brains). Mann–Whitney test, two-tailed, ****P < 0.0001. Black dashed line indicates the median. d, Receiver operating characteristic (ROC) curve demonstrates that the p-mTOR-S2448 level in PAASs significantly distinguishes AD brains from unaffected controls. Area under the ROC curve = 0.962, standard error = 0.038, 95% confidence interval: 0.888–1.000, P = 0.0005. Quantification was performed two-sided. Ctrl, control; ThioS, thioflavin S.
Human iPSC modeling replicates axonal spheroid pathology
To establish a comprehensive strategy for investigating selected proteomic hits and their roles in spheroid formation, we developed a long-term human iPSC-derived neuron and astrocyte co-culture AD model56 (Fig. 6a,b and Extended Data Fig. 9a–d). A similar approach was recently shown to replicate axonal spheroid formation with exogenous aggregated Aβ1–42 (ref. 57). We simplified the induction protocol using the NGN2-induced glutamatergic neuron method56, making it more accessible for most laboratories. Increasing the overall neuronal density enhanced the similarity to axonal spheroid halos observed around amyloid plaques in the human brain. Our optimized model generated thioflavin S–positive amyloid deposits surrounded by abundant axonal spheroids (Fig. 6b, Extended Data Figs. 9e,f and 10a–c and Supplementary Fig. 8a). These spheroids accumulated lysosomes and autophagosomes (Fig. 6b,c) and expressed phosphorylated Tau S235, S396 and S404 (Extended Data Fig. 9g), closely resembling human axonal spheroids4,58.

a, Workflow of the human iPSC-derived AD model. b, Image showing axonal spheroids (SMI312, gray) around amyloid deposits (thioflavinS, blue) and expressing ATG9A (red). c, Time-lapse imaging shows a spheroid forming (arrowhead) from a neurite (AAV9-hSyn-mCherry labeled) near Aβ deposits (gray) and enlarging over time. Lysosomes (AAV2-CMV-LAMP1-GFP labeled) accumulate within spheroids. d–h, Neuronal GCaMP8f imaging in the human iPSC AD model. d, Images of CAMKII-GCaMP8f-labeled neuronal processes with (upper) or without (lower) axonal spheroids and representative traces of calcium dynamics. y axis indicates ΔF/F, and dotted black lines indicate the calcium rise slope. Quantification of calcium rise time (e) and calcium rise speed (f). Each dot represents a neuronal process from three independent experiments (two-tailed Mann–Whitney test). g, Images showing that calcium decay time is slower in spheroids (pink asterisk) than in neuronal processes (blue asterisks). h, Quantification of calcium decay time in neuronal soma (blue), processes with (light pink) or without (light blue) spheroids and spheroids (pink). Each dot represents a neuronal process from three independent experiments (one-way ANOVA). i, mTOR signaling in iPSC-derived axonal spheroids (SMI312). j, Western blot showing that Torin1 treatment reduces mTOR downstream effectors phosphorylated 4E-BP1 and phosphorylated p70 S6K, whereas their total protein levels remain unchanged. k–r, Torin1 reduced axonal spheroids (SMI312) around Aβ deposits (thioflavin S). l–p, Pre-Aβ administration Torin1 treatment quantification: l, axon with spheroid percentage (n = 3 in each group). Paired t-test two-tailed, P = 0.005. m, spheroid size (paired t-test two-tailed, P = 0.013, n = 4 per group). Dots represent experiments (20–30 ROIs). n, Axon number around plaques in each ROI (Torin1 n = 56; vehicle n = 55; unpaired t-test two-tailed, P = 0.880). o, Soma size. Dots represent neuronal somata (Torin1 n = 298, vehicle n = 316. Unpaired t-test two-tailed, P = 0.927; related to Extended Data Fig. 8i). p, Plaque size. Dots represent amyloid plaques (Torin1 n = 201, vehicle n = 253. Unpaired t-test two-tailed, P = 0.419). q,r, Post-Aβ administration Torin1 treatment (related to Extended Data Fig. 10). Spheroid number normalized to axon density (q) and spheroid size (r) (Mann–Whitney test, two-tailed, n = 4 per group). Scale bar, 5 μm, except scale bar, 10 μm in g. e,f,h,l–r, Data presented as mean values ± s.e.m. See also Extended Data Figs. 9 and 10 and Supplementary Fig. 8. NS, not significant; ThioS, thioflavin S.
This culture system enabled longitudinal structural and functional imaging, providing insights into the dynamics and consequences of spheroid pathology. Using reporter adeno-associated viruses (AAVs) to label neurons and lysosomes, we tracked spheroid formation after Aβ1–42 administration. Confocal microscopy of individual axons revealed gradual spheroid formation and lysosomal accumulation starting on day 1, with spheroids increasing in size over a 7-day observation period (Fig. 6c).
We also investigated the functional repercussions of spheroid formation in this human iPSC-derived model. Using calcium imaging with the reporter GCaMP8f, we measured Ca2+ rise times in axonal segments on both sides of axonal spheroids after electrical stimulation. Axonal segments with spheroids showed a significantly reduced calcium rise slope compared to those without spheroids (Fig. 6d–f), consistent with impaired action potential conduction across spheroids, as seen in our earlier in vivo findings in 5×FAD mice4. Additionally, axon segments with spheroids exhibited prolonged calcium decay times compared to normal processes and somata, indicating disrupted calcium homeostasis within spheroids (Fig. 6g,h).
mTOR inhibition reduces spheroid pathology in human neurons
We investigated the role of PI3K/AKT/mTOR signaling in axonal spheroid development and enlargement using the human iPSC-derived AD model. Consistent with findings in postmortem human brains (Fig. 5), we detected expression of proteins associated with the PI3K/AKT/mTOR pathway localized within axonal spheroids (Fig. 6i and Supplementary Fig. 8).
To evaluate the impact of mTOR inhibition, we treated 3-month-old iPSC-derived neuron and astrocyte co-cultures with Torin1, an inhibitor of both mTORC1 and mTORC2 (refs. 59,60). A 7-day treatment with Torin1 significantly suppressed mTOR signaling, as evidenced by reduced phosphorylation of downstream effectors p-p70 S6K (Thr 389) and p-4E BP1 (Thr 37/46), without affecting total protein levels (Fig. 6j and Supplementary Fig. 9). To assess the effects of Torin1 on spheroid formation and reversal, cultures were treated either before or after Aβ exposure. Pre-treatment with Torin1 before Aβ substantially decreased both the number and size of spheroids (Fig. 6k–p). Post-treatment with Torin1 after Aβ exposure reduced the number of spheroids but did not affect their size (Fig. 6q,r and Extended Data Fig. 10a–c). Notably, these effects were not due to axonal loss (Fig. 6n and Extended Data Fig. 10d), changes in neuronal density or amyloid plaque size (Fig. 6o,p and Extended Data Figs. 9h and 10e). These results indicate that mTOR signaling is critical for amyloid-induced spheroid formation and suggest that targeting mTOR could be a promising approach for both preventing and reversing spheroid pathology.
Amelioration of spheroid pathology in 5×FAD mice
To investigate the role of mTOR signaling in axonal spheroid pathology in vivo, we employed a viral-mediated Cre/lox-based approach to induce Mtor knockout in 5×FAD mice (Fig. 7a–c and Supplementary Fig. 1a–d). Using heterozygous Mtor-floxed 5×FAD mice61 and AAV9-hsyn-cre-2a-tdTomato, we achieved partial loss of mTOR in infected neurons. Sparse neuronal infection enabled clear visualization of individual spheroids (Fig. 7d,e), showing a significant reduction in spheroid size after heterozygous Mtor knockout (Fig. 7f,g).

a, Schematic of neuronal-specific conditional knockout of Mtor in heterozygous floxed mice. b,c, Images showing neuronal-specific Cre-mediated Mtor knockout: homozygous (b) and heterozygous (c), using AAV9-hSyn-Cre-2A-tdTomato or AAV PHPeB-hSyn-Cre-EGFP in Mtor-floxed mice, respectively. b, mTOR expression (gray) was absent in Cre-expressing neurons compared to adjacent NeuN-labeled neurons without Cre expression. c, mTOR expression was reduced in Cre-expressing neurons compared to neurons without Cre expression. Scale bar, 5 μm. d, Experimental design to study mTOR knockout effects on individual spheroids. e, Images showing AAV9-hSyn-Cre-2A-tdTomato sparsely labeling individual spheroids (red) within a spheroid halo (Lamp1, gray). f, Quantification of spheroid size. Dots represent animals (mTOR-flox-AD n = 5, 5×FAD n = 4. Unpaired t-test, two-tailed, P = 0.027). g, Using the same data in f, comparison of spheroid size distribution and visualization using a quantile–quantile (Q–Q) plot. Dashed lines indicate spheroid area at 10 µm2. 5×FAD mice have significantly more large spheroids (area > 10 µm2) compared to mTOR-KO-AD (two-sample test for equality of proportions with continuity correction, two-tailed, P = 0.0004). h, Experimental design to assess the effect of Mtor knockout on spheroid halo size. i, Quantification of spheroid halo size. Dots represent animals (n = 3; unpaired t-test, two-tailed, P = 0.041). j, Quantified by axonal spheroid halos (knockout group n = 66 and control group n = 109. Unpaired t-test, two-tailed, P < 0.0001). k, Quantification of neuronal soma size. Dots represent animals (n = 3). Unpaired t-test, two-tailed, P = 0.90. l–o, Investigation of mTOR heterozygous knockout downstream signaling effectors. Immunofluorescence intensity of TFEB (l), LC3B (m), P-p70S6K Thr389 (n) and p70S6K (o). Littermates and sex were paired in l–o, paired t-test. Dots represent animals (n = 3 in each group). p, RNAscope in 5×FAD mice cortices showing mRNA species (poly(A) probe, magenta) present in spheroids (NHS ester-labeled, yellow, and DAPI negative). NHS ester (yellow) labels the spheroid halo and amyloid plaques. Nuclei are labeled with DAPI (blue). Scale bar, 5 µm. q, Quantification of poly(A) probe fluorescence intensity versus negative control probe within spheroids in cortices of 5×FAD mice (n = 3). Unpaired t-test, parametric, two-tailed, P = 0.001. r, Representative images showing puromycin labeling. Scale bar, 5 µm. s, Quantification of puromycin fluorescence intensity in axonal spheroids of 5×FAD mice (n = 3). Unpaired t-test, parametric, two-tailed, P = 0.028. j,q,s, Data are presented as mean values ± s.e.m. See also Supplementary Figs. 10–12. mo, months; NS, not significant.
To evaluate the overall impact on spheroid size and number, we measured the axonal spheroid halo size around individual amyloid plaques. We infected Mtor-floxed 5×FAD mice with AAV-PHP.eB-hSyn-Cre-GFP virus to achieve dense neuronal infection, inducing widespread Mtor heterozygous knockout in neurons (Fig. 7h and Supplementary Fig. 10b,d,e). This intervention significantly reduced the axonal spheroid halo size around plaques without affecting amyloid plaque size (Fig. 7i,j and Supplementary Fig. 10e–h). Notably, despite the role of mTOR in cell growth and maturation35,59, heterozygous Mtor knockout did not change the size of neuronal cell bodies (Fig. 7k and Supplementary Fig. 10f). These findings in vivo, consistent with the results from human iPSC-derived neurons, underscore the potential of targeting PI3K/AKT/mTOR signaling for mitigating axonal spheroid pathology in AD.
Signaling pathways involved in lysosome biogenesis and autophagy likely contribute to the accumulation of aberrant endolysosomes in spheroids. Additionally, local mRNA translation, which has been shown to modulate axonal outgrowth, may play a role in spheroid formation62,63. Considering the known effects of mTOR on lysosome biogenesis, autophagy and local mRNA translation35,52, we investigated related downstream molecules. Using AAV-PHPeB-hSyn-Cre, we achieved extensive neuronal infection in mTOR heterozygous floxed 5×FAD mice, enabling widespread mTOR heterozygous knockout in neurons (Fig. 7a–c,h). Immunofluorescence confocal imaging assessed expression levels of TFEB (lysosomal biogenesis transcription factor), p-p70S6K (regulator of local protein synthesis) and LC3B (autophagy marker) in neuronal somata. Automated quantitative analysis compared mTOR heterozygous knockout mice to controls (Fig. 7l–o). Results showed increased TFEB and LC3B expression (Fig. 7l,m), indicating enhanced lysosomal biogenesis and autophagy. Additionally, we observed decreased p-p70S6K (Fig. 7n,o), which may be associated with reduced local mRNA translation52.
We investigated whether local mRNA translation occurs in axonal spheroids. Using RNAscope in 5×FAD mice, we probed for mRNA species in axonal spheroids with a poly(A) tail probe and compared it to a scrambled control probe (Fig. 7p and Supplementary Fig. 11a). The poly(A) probe showed signal localization within axonal spheroids, whereas the control probe did not, confirming the presence of mRNA in these structures (Fig. 7q and Supplementary Fig. 11b–d). To examine local mRNA translation, we performed an in vivo puromycylation assay in 5×FAD mice (Fig. 7r and Supplementary Fig. 12a). Nascent proteins labeled by puromycin were detected in axonal spheroids, and treatment with the protein translation inhibitor anisomycin reduced the degree of labeling (Fig. 7s and Supplementary Fig. 12a–c), indicating that local mRNA translation occurs within spheroids. To test whether mTOR can regulate nascent protein production in spheroids, we applied both pharmacological and genetic approaches. Treatment with Torin1 to inhibit mTOR in 5×FAD mice did not alter the puromycin signal. Additionally, we used mTOR-floxed mice and a PHPeB-hSyn-Cre virus to genetically knock out mTOR in neurons. Neither the heterozygous nor homozygous mTOR deletion significantly affected the puromycin signal (Fig. 7a–c and Supplementary Figs. 10a–d and 12d–f). These results indicate that, under our experimental conditions (Supplementary Fig. 12d–f), mTOR does not appear to control local protein translation within axonal spheroids. These experiments indicate that the reduction in axonal spheroid size and number observed after mTOR inhibition is likely due to its enhancement of lysosomal biogenesis and autophagy rather than modulation of local protein translation in spheroids.
Discussion
Plaque-associated axonal spheroids, also known as dystrophic neurites, have been recognized as a hallmark of AD for over a century10,11,14,64,65, but their molecular composition and the mechanisms driving their progression remain largely unexplored due to methodological limitations. In the present study, we implemented a comprehensive approach to investigate the molecular and cellular mechanisms of PAAS formation. We developed a subcellular proximity labeling proteomics method for postmortem human and mouse brains43, enabling detailed analysis of the protein composition and signaling pathways operating within PAASs (Fig. 8, Supplementary Fig. 6 and Supplementary Table 2). Bioinformatics analysis and high-resolution confocal imaging identified hundreds of proteins and pathways newly associated with PAASs, including lipid transport, protein turnover and cytoskeletal dynamics, with the PI3K/AKT/mTOR pathway emerging as a key regulator of these biological processes in PAASs. To explore the functional implications of these findings, we implemented an optimized human iPSC-derived AD model57 that replicates amyloid plaque and PAAS formation. Pharmacological and genetic inhibition of mTOR signaling in this model and in AD-like mice significantly reduced PAAS pathology. Altogether, our study reveals the molecular architecture and functional impact of PAASs in human neurons and implicates the PI3K/AKT/mTOR axis as a key signaling pathway in PAAS formation and growth. It also suggests new therapeutic targets for mitigating axonal pathology independently of amyloid removal.

Proximity labeling proteomics reveals proteins associated with various subcellular organelles, the ubiquitin–proteosome system and cytoskeleton. These proteins and their signaling pathways are linked to biological functions, including protein turnover and vesicle fusion (green box); cytoskeletal dynamics (yellow box); lipid localization and transport (red box); and others (gray box). Highlighted here are selected newly identified and validated proteins, alongside those previously known to be enriched in PAASs, such as lysosomal proteins LAMP1 (ref. 4), cathepsin B and D14, RAGC14 and PLD3 (refs. 47,48); autophagosome protein ATG9A112; endoplasmic reticulum proteins RTN3 (ref. 112) and RTN1 (ref. 113); cytoskeletal neurofilament protein114; microtubule protein TUBB3 (ref. 20); synaptic proteins synaptophysin5 and VAMP2 (ref. 14); as well as APP31, Tau (MAPT)26 and ubiquitin71,112 (Supplementary Table 2).
Proximity labeling proteomics with subcellular resolution overcame the cellular and subcellular specificity limitations of conventional tissue proteomics, including those using micro-dissected amyloid plaques66,67,68. Using an antibody-based biotinylation method43,44, we tagged proteins in axonal spheroids without requiring exogenous peroxidase or biotin ligase overexpression36,37,41, enabling comparative proteomics from widely available postmortem tissues. PLD3 was chosen as the antibody bait due to its high enrichment in PAASs of both humans and mice47,48 and its neuron-predominant expression4,47, minimizing contamination from other cell types. Comparison of PLD3-labeled and Lamp1-labeled proteomes in 5×FAD mice confirmed that the PLD3-labeled proteome is highly specific for neuronal and axonal structures (Extended Data Fig. 5).
Using this proteomic strategy, we identified numerous proteins enriched in PAASs, including previously unknown ones, alongside those already associated with these structures (Fig. 8, Supplementary Fig. 6 and Supplementary Tables 1 and 2). Proteomic analysis in humans with AD revealed three key biological processes likely involved in PAAS formation and growth (Figs. 3 and 4). (1) Proteolysis Dysfunction: This was indicated by the accumulation of proteins related to endocytosis, phagosome, proteosome, ubiquitin-mediated proteolysis and lysosome acidification (Figs. 3, 5 and 8 and Supplementary Table 2). Previous studies demonstrated that accumulation of enlarged protease-deficient lysosomes and autophagosomes within PAASs14 mediates spheroid growth4, highlighting the critical role of impaired lysosomal function. Some of the identified proteins are also expressed in synapses, raising the possibility that PAASs may originate from pre-synaptic structures, although electron microscopy did not reveal pre-synaptic or post-synaptic features in PAASs (Supplementary Movie). (2) Cytoskeletal Dysregulation: Activated signaling pathways, such as actin cytoskeletal signaling, RAC signaling and actin nucleation by the ARP–WASP complex, were enriched within PAASs, whereas pathways such as RHOGDI signaling, which regulates Rho family GTPase, were inhibited (Fig. 3c and Extended Data Fig. 4e)69,70. These findings suggest that ongoing cytoskeletal reorganization and plasticity within PAASs play a key role their formation and enlargement. Moreover, these cytoskeletal changes may disrupt retrograde and anterograde axonal cargo transport, leading to accumulation of endolysosomal vesicles18,28,71 and further spheroid expansion. (3) Lipid Transport and Metabolism: Lipid-related signaling was highly activated in PAASs (Fig. 4a–d), with proteins involved in lipid transport and metabolisms, such as APOE, HDLBP and C3, prominently expressed in PAASs and aberrant axons (Fig. 4b–g and Extended Data Fig. 8a). Among these, APOE, the most significant AD risk gene, acts as a lipid carrier53. TMEM30A, ATP8A1 and ATP8A2 (Fig. 4c,e), which form the P4–ATPase complex, regulate asymmetric membrane lipid distribution, membrane stability and vesicle-mediated protein transport72. These proteins are likely related to the massive accumulation of endolysosomal vesicles within PAASs, requiring active lipid transport, synthesis and metabolism and aligning with findings that lipids participate in axonal lysosome delivery and spheroid formation21. Interestingly, complement C3, crucial for complement system activation73 and lipid metabolism74,75, exhibited the highest expression in axonal spheroids and aberrant axons (Fig. 4e,f and Extended Data Fig. 8a). This aligns with prior research linking complement proteins to dystrophic neurites around compact amyloid plaques76,77,78 and suggests a potential connection between complement pathway activation and spheroid formation. On the basis of our previous work showing that microglia rarely engulf spheroids and that spheroids persist for long periods4,31,32, we propose that C3 is playing a role independent of traditional neuroimmune interactions, warranting further investigation.
The PI3K/AKT/mTOR was identified as a key activated signaling pathway within PAASs (Fig. 3c and Extended Data Fig. 4e), with its activation in human postmortem brains strongly correlating with AD severity (Fig. 5b,c). The PI3K/AKT/mTOR pathway is known to inhibit autophagy, endosome and autophagosome maturation79, lysosomal biogenesis and proteasome assembly52 while promoting axonal outgrowth62,63,80 and lipid synthesis52,81. Interestingly, lipids such as phosphatidic acid and cholesterol can activate the mTORC1 complex82,83, suggesting that lipids within PAASs may mediate mTOR activation. This, in turn, could modulate PAAS formation by regulating the three key biological processes that we identified in PAASs: lipid transport, protein turnover and cytoskeletal dynamics (Figs. 3 and 4).
Our findings demonstrate that pharmacological inhibition of mTOR signaling in the human iPSC-derived AD model significantly reduced PAAS pathology (Fig. 6). Separate in vivo experiments with neuron-specific mTOR heterozygous knockout in 5×FAD mice excluded glial contributions, confirming a neuronal cell-autonomous effect of mTOR on PAASs (Fig. 7). Investigation of downstream mechanisms revealed that mTOR knockdown enhanced autophagy, likely acting both at the whole cell level and locally within axonal spheroids, consistent with the extensive accumulation of endolysosmal vesicles in these structures. Additionally, the presence of mRNA and nascent proteins in axonal spheroids suggested potential for local translation at these sites. However, although mTOR signaling is known to modulate local translation in neurons62,63,84, our study did not detect changes in local translation levels after mTOR knockout or pharmacological inhibition (Supplementary Fig. 12d–f).
In addition to PI3K/AKT/mTOR, we observed activation of other signaling pathways within PAASs, including calcium signaling and amyloid processing (Figs. 3c and 8). Proteins involved in calcium signaling, such as CAMK2 and calmodulin, were identified in PAASs (Fig. 3e, Supplementary Fig. 7 and Supplementary Table 2), suggesting a role for local calcium signaling dysregulation in PAAS pathogenesis. This is supported by our longitudinal calcium imaging in human neurons, which showed that axonal spheroids disrupt calcium rise and decay times after electrical stimulation, indicating impaired action potential conduction and calcium homeostasis within PAASs. Additionally, recent studies have shown that abnormal local calcium efflux from de-acidified late endosomes and amphisomes can disrupt axonal transport of these vesicles85, highlighting the complex interplay between calcium signaling and other pathways during PAAS development.
The human iPSC-derived AD model effectively replicated PAAS pathology, characterized by abundant spheroid formation around thioflavin S–positive amyloid plaques and significant accumulation of endolysosomal vesicles, cytoskeletal elements and phosphorylated tau within PAASs. The administration of exogenous Aβ in this model (Fig. 6a–d) supports the theory that spheroids form in response to extracellular amyloid deposition rather than acting as the source of these deposits18,86. Longitudinal imaging of individual axons in human neurons revealed rapid spheroid formation and lysosome accumulation within days of Aβ administration, with axons exhibiting active growth during spheroid formation rather than a dying-back pattern (Fig. 6c), consistent with previous in vivo mouse studies4. Despite widespread exposure to oligomeric Aβ in this model, axonal spheroids were predominantly observed next to compact thioflavin S–positive plaques (Fig. 6b and Extended Data Figs. 9e,f and 10b,c). This is consistent with human observations, where diffuse amyloid deposits (thioflavin S negative) rarely induce PAASs, whereas thioflavin S–positive deposits are closely associated with PAAS pathology31. These findings suggest that specific β amyloid conformations are critical for triggering PAAS formation.
This study has several potential limitations. First, although STED super-resolution imaging showed that the radius of antibody-based proximity labeling in brain tissue was less than 50 nm, some proteins distal to PLD3 may not have been captured in the PAAS proteome. However, the high enrichment of PLD3 in axonal spheroids likely increased biotinylation efficiency, resulting in our ability to capture most proteins previously described in PAASs, including endolysosomal-related proteins as well as cytoskeletal proteins (for example, SPTBN1) and cell surface receptors (for example, NTRK2) (Figs. 2d and 8, Extended Data Fig. 4a, Supplementary Fig. 6 and Supplementary Table 2). Second, although PLD3 is abundant in spheroids in both AD human and mouse brains, some labeling does occur at neuronal cell bodies and neuropil (~27% of PLD3 signal) (Extended Data Fig. 1e–g). We addressed this by excluding proteins potentially originating from neuronal cell bodies (Fig. 2b and Methods), but the presence of some neuronal cell body–specific proteins in the PAAS proteome cannot be entirely ruled out. For instance, a protein upregulated in AD but expressed solely in the neuronal soma could theoretically appear as a false positive, although we have not found such cases so far. Third, the low number of plaques and axonal spheroids in early-stage AD limited our ability to compare levels of the various PAAS proteins across disease stages due to insufficient protein yield. Future studies could leverage multiplexed high-resolution quantitative imaging87 for comparisons at different disease stages. Finally, the human iPSC-derived AD model in our study recapitulates spheroid formation around amyloid plaques but does so through a rapid process that may not fully mimic in vivo mechanisms. Refining these models to allow for more chronic amyloid buildup and incorporating co-cultures with other cell types, such as microglia, could better replicate the in vivo plaque microenvironment.
Altogether, the proteomics resources and methodologies developed in this study enable the investigation of axonal pathology in human postmortem brains, iPSC-derived human neurons and in vivo mouse models. Although this study focused on amyloid plaque-associated axonal spheroids, similar structures are observed in other neurodegenerative disorders21,88,89,90. Therefore, the multidisciplinary strategies, and the datasets generated, mapping the molecular architecture of axonal spheroids will facilitate studies into the diverse mechanisms underlying axonal spheroid pathology in AD and other neurodegenerative conditions, providing a foundation for hypothesis generation and therapeutic target testing.
Methods
Human postmortem brain tissue
Snap-frozen postmortem human brain specimens of frontal cortices from patients with AD and age-matched controls were obtained from the Yale Alzheimer’s Disease Research Center and the Banner Sun Health Research Institute. Detailed demographic and clinical information can be found in Supplementary Fig. 1. For proximity labeling proteomics, six AD cases with intermediate to high AD level64 and eight age-matched unaffected controls were used. To reduce inter-sample variability and maximize signal to noise by avoiding brains with low-density amyloid deposition, we carefully inspected approximately 40 individual postmortem brains using microscopy and selected for proteomic analysis six AD brains with the highest density of amyloid plaques and axonal spheroids within the frontal cortex. The gray matter regions with high plaque load were microdissected out from AD brain sections under visual guidance using a fluorescence stereomicroscope (Leica). Similarly, the gray matter regions were dissected from unaffected control brain sections. For immunofluorescence proteomic validations, 25 severe AD and 14 unaffected control cases were used (Supplementary Fig. 1).
Human iPSC line and human primary astrocytes
Two fully characterized, de-identified control human iPSC lines, NSB3182-3 (female) and NSB2607 (male), were used in all experiments91. NGN2-induced glutamatergic neurons56 were generated and co-cultured with human primary astrocytes (Thermo Fisher Scientific, N7805200, or ScienCell, 1800) for all experiments57.
Mice
All animal procedures were approved by the Institutional Animal Care and Use Committee at Yale University. Animals were housed at the Yale University Animal Facility, with a 12-hour light/dark cycle, temperature at 65–75 °F and with 40–60% humidity. Wild-type (WT) (C57BL/6J) mice, 5×FAD (Tg6799) mice92 and mTOR-flox (The Jackson Laboratory (JAX), 011009) mice61 were obtained from JAX. 5×FAD and WT mice, used for proximity labeling proteomics, were euthanized at 15 months of age, followed by transcardial perfusion. Three male mice per genotype (WT and 5×FAD) were used. Animals used for immunofluorescence proteomic validation were euthanized at 2–3 months or 12–15 months of age, with three biological replicates per experiment. mTOR-flox mice were cross-bred with 5×FAD mice to create an mTOR-flox 5×FAD line. For AAV-mediated mTOR heterozygous knockout experiments, mTOR-flox 5×FAD mice were injected with AAVs at 6 weeks of age. Five biological replicates (combining male and female mice) in each group were used for the AAV9-hSyn-cre-2a-tdT experiment, and three male mice in each group were used for the AAV-PHPeB experiment.
Antibodies and reagents
The full list of primary antibodies for newly validated and known PAAS proteins can be found in Supplementary Table 2, including catalog number, RRID, dilution factors and brief staining instructions. In brief, anti-PLD3 antibody, anti-SMI312 and anti-cathepsin D were used to label PAASs in both mice and humans. Anti-Lamp1 and anti-cathepsin B antibodies were used to label PAASs in mice. For proteomic hits validation, anti-GAA, anti-GBA, anti-TPP1, anti-ATP6V0A1, anti-SYT11, anti-G3BP1, anti-G3BP2, anti-ITM2B, anti-SPTBN1, anti-SV2A, anti-ATP2B3, anti-CAMK2A, anti-calmodulin, anti-SYT1, anti-CACNA2D1, anti-CACNA1B, anti-NTRK2, anti-mTOR, anti-p-mTOR S2448, anti-PIK3R4, anti-AKT1, anti-LAMTOR, anti-RAGA, anti-RAGC, anti-RHEB, anti-RAPTOR, anti-HDLBP, anti-APOE, anti-C3, anti-HEXB and anti-TMEM30A were used for validating newly identified PAAS proteins. Anti-RAGC, anti-ATG9A, anti-ubiquitin, anti-RTN3, anti-PKC, anti-synaptophysin, anti-SNAP25, anti-VAMP2 and anti-beta tubulin III were used for immunostaining of known PAAS proteins. To reveal GFP and tdTomato protein expression, anti-GFP (1:500, RRID: AB_10000240) and anti-RFP (1:200, RRID: AB_2209751) were used, respectively. For staining neuronal and glial markers in iPSC-derived human neurons, anti-neurofilament H (1:1,000, RRID: AB_2149761), anti-NeuN (1:1,000, RRID: AB_10711040), anti-NeuN (1:200, RRID: AB_2532109), anti-Synapsin1/2 (1:500, RRID: AB_2622240), anti-PSD95 (1:200, RRID: AB_10807979), anti-S100b (1:500, RRID: AB_2814881) and anti-IBA1 (1:100, RRID: AB_2891289) were used. To stain Aβ deposits, anti-6e10 (1:200, RRID: AB_2565328) was used. To stain phosphorylated Tau, anti-phospho-Tau S235 (1:1,000; Thermo Fisher Scientific), anti-phospho-Tau S396 (1:200) and anti-phospho-Tau S404 (1:200) were used (see RRIDs in Supplementary Table 2). Dendritic marker MAP2 (1:200, RRID: AB_776174) was used. To detect mTOR signaling substrates such as phosphor-4E-BP1 and p70S6K, an mTOR substrate antibody sampler kit (Cell Signaling Technology (CST), 9862) and anti-4E-BP1 antibody (CST, 9452) were used. For puromycylation, anti-puromycin 647 (1:1,000, RRID: AB_2736876) was used. Thioflavin S (Sigma-Aldrich, T1892, 2% w/v stock solution, 1:10,000 staining) was used to label amyloid plaques. Alexa Fluor dye-conjugated secondary antibodies were used (1:600; Thermo Fisher Scientific).
Tissue fixation
We compared the impact of different tissue fixation approaches on the proximity labeling efficacy and protein extraction efficiency. For human brain samples, snap-frozen postmortem human brains coupled with fresh fixation in 4% paraformaldehyde (PFA) at 4 °C for approximately 24 hours worked the best. For mice, freshly perfused mouse brains and fixed in 4% PFA at 4 °C for approximately 24 hours performed the best in both proximity labeling efficacy and protein extraction efficiency. We found that long-term fixation and storage with the formalin-fixed paraffin-embedded (FFPE) method markedly reduced both proximity labeling and protein extraction efficiencies.
Proximity labeling in brain tissue
Proximity labeling in human and mouse tissue was performed based on ref. 43 with optimizations. Detailed procedures are described below. Axonal spheroids were proximity labeled by using anti-PLD3 or anti-Lamp1 antibodies in mice and humans. Neuronal soma were proximity labeled using anti-NeuN antibody. In brief, frozen postmortem human brain specimens were fixed by submerging into ice-cold 4% PFA and put onto a shaker at 4 °C for approximately 24 hours. For mice, after transcardial perfusion, brains were fixed in 4% PFA at 4 °C for approximately 24 hours while shaking. Human and mouse brains were vibratome sectioned at 50-μm thickness. Ten sections (approximately 1 cm × 0.8 cm each) for human or mouse brain were used in each reaction per biological replicate. Human sections contained mostly gray matter. Six to eight human biological replicates were used in each group, and three biological replicates were used in each mouse group. Sections were permeabilized by PBS with 0.5% Triton X-100 for 7 minutes, followed by rinsing with PBST (0.1% Tween 20 in PBS). To quench the endogenous peroxidase activity, sections were incubated in 0.1% H2O2 for 10 minutes, followed by rinsing with PBST twice. Primary antibody diluted in blocking buffer (0.1% Tween 20 with 1% BSA in PBS) was incubated overnight at 4 °C on a shaker, followed by PBST washes for three times at 20 minutes per wash. Secondary antibodies conjugated with HRP were incubated in blocking buffer for 1 hour at room temperature, followed by PBST washes for three times at approximately 40 minutes per wash. Proximity labeling was performed by using Biotin-XX-Tyramide dissolved in 50 mM Tris-HCl buffer (pH 7.4) with H2O2 for 5 minutes, according to the user’s manual (Thermo Fisher Scientific, B40921). Specifically, every 1 ml of reaction solution was made of 10 μl of 1× Biotin-XX-Tyramide and 10 μl of 1× H2O2 in 50 mM Tris-HCl buffer. Biotinylation reactions were terminated by rinsing sections with freshly made 500 mM sodium ascorbate for three times, followed by PBST washes for three times.
Enrichment of biotinylated proteins using streptavidin beads
We performed proximity labeling proteomics on fixed brain specimens, which may reduce the protein extraction yield compared to other proximity labeling methods using fresh tissue. Thus, we optimized the protein extraction protocol and largely increased the protein extraction yield compared to previously published methods (Supplementary Fig. 2a)43. Specifically, brain sections from proximity labeling experiments were lysed and de-crosslinked in 100 mM Tris-HCl buffer (pH 8.0) with 2% SDS and protease inhibitor (Roche) at 95 °C for 45 minutes with constant shaking. For every 10 brain sections, 500 µl of lysis buffer was used. Protein lysate was sonicated using Sonic Dismembrator Model 500 (Thermo Fisher Scientific) for three times, 3 seconds per time at 4 °C. Protein lysate was centrifuged at 12,000 relative centrifugal force (rcf) for 5 minutes. Then, 450 µl of protein lysate supernatant was collected from each sample, incubated with 550 µl of PBST containing 200 µl of pre-washed streptavidin magnetic beads (Thermo Fisher Scientific, 88817), protease inhibitor and phosphatase inhibitor, to meet a final 1-ml volume. Samples were then incubated on a 360° rotator at 4 °C overnight. The rest of protein lysates were used for protein concentration measurement by BCA (Thermo Fisher Scientific). After incubation, beads were sequentially washed once with PBST, twice with PBST with 1 M NaCl and twice with PBS. Biotinylated proteins were eluted in elution buffer (20 µl of 20 mM dithiothreitol (DTT) and 2 mM biotin in 1× NuPAGE LDS lysis buffer (Thermo Fisher Scientific) with protease inhibitor and phosphatase inhibitor) at 95 °C for 5 minutes. Supernatant was collected and centrifuged at 12,000 rcf for 1 minute, followed by running into a 4–20% Tris-glycine gel (Invitrogen) at constant 150 V until all the proteins had run into the gel (approximately 10 minutes). Gel was rinsed once in ultrapure water (AmericanBio) and incubated in approximately 50 ml of Coomassie blue R-250 staining solution (Bio-Rad) for 1-hour incubation. Gel was de-stained with Coomassie blue R-250 destaining solution (Bio-Rad) for 2 hours with three times buffer changes. Gel was rinsed with ultrapure water for three times. Gel containing protein samples was visualized, cut with clean blades and kept at −20 °C.
Enrichment of biotinylated peptides using anti-biotin antibody
The labeled tissue was lysed using 100 mM Tris-HCl buffer (pH 8.0) with 2% SDS and protease inhibitor (Roche). The lysates were sonicated and then centrifuged at 16,500g for 10 minutes at 4 °C. The proteins were precipitated using acetone, and the pellet was dissolved in 8 M urea and 50 mM ammonium bicarbonate (ABC) and then sonicated for 30 seconds to re-solubilize the proteins. A Bradford assay was performed to determine protein concentration, and 2 mg of protein was used to process further. Proteins were reduced with 5 mM DTT for 45 minutes at room temperature and subsequently carbamidomethylated with 10 mM iodoacetamide for 30 minutes at room temperature in the dark. Before digestion, the urea concentration was reduced to 2 M with 50 mM ABC and digested with trypsin at an enzyme:substrate ratio of 1:50 overnight at 37 °C. After digestion, samples were acidified with 10% formic acid and de-salted using Nest Group C18 macro-spin columns (HMMS18V) as per the manufacturer’s instructions. Biotinylated peptides were enriched using anti-biotin antibody-based immunoprecipitation. The peptides were dissolved in IAP buffer containing 50 mM MOPS, 10 mM HNa2PO4 and 50 mM NaCl at pH 7.5. Anti-biotin beads (ImmuneChem Pharmaceuticals) were washed twice in IAP buffer before the samples were added to the beads for incubation on a rotator for 2 hours at 4 °C. The beads were washed twice with IAP buffer and twice with water (high-performance liquid chromatography (HPLC) grade). The biotinylated peptides were eluted from the beads using 80% acetonitrile (ACN) and 0.15% trifluoroacetic acid (TFA) with vortexing, followed by a 10-minute incubation at room temperature. The elution was repeated twice, and the supernatants were collected and vacuum dried.
Western blotting
For western blotting, 4–20% Tris-glycine gels (Invitrogen) were used for protein electrophoresis following the manufacturer’s protocol. Proteins were transferred to nitrocellulose membranes (Bio-Rad) at constant 350 mA for approximately 50 minutes. After blocking with 5% BSA in TBST (Tris-buffered saline with 0.1% Tween 20) for 1 hour, membranes were incubated with primary antibodies (anti-PLD3 1:250; anti-CatB 1:1,000; anti-RAGC 1:1,000; anti-NeuN 1:1,000; anti-GAPDH 1:1,000) diluted in 5% BSA in TBST on a shaker at 4 °C overnight, followed by three times of 15-minute washes with TBST. Membranes were then incubated with HRP-conjugated secondary antibodies diluted in 5% BSA in TBST for 1 hour at room temperature, followed by three times of 15-minute washes with TBST. To blot biotinylated proteins on the same membrane, stripping buffer (Thermo Fisher Scientific, 46430) was used to cover the whole membrane and incubated at room temperature with shaking for 10–12 minutes, followed by rinsing with PBST for three times. HRP-conjugated streptavidin (1:1,000) was diluted in blocking buffer for 1–2 hours at room temperature or 4 °C overnight. Clarity Western ECL blotting substrate (Bio-Rad) and ChemiDoc MP Imaging System (Bio-Rad) were used for chemiluminescence development and detection.
In-gel digestion
Gel slices were cut into small pieces and washed with 600 µl of water on a tilt table for 10 minutes, followed by 20-minute wash with 600 µl of 50% ACN/100 mM NH4HCO3 (ABC). The samples were reduced by the addition of 100 µl of 4.5 mM DTT in 100 mM ABC with incubation at 37 °C for 20 minutes. The DTT solution was removed, and the samples were cooled to room temperature. The samples were alkylated by the addition of 100 µl of 10 mM iodoacetamide (IAN) in 100 mM ABC with incubation at room temperature in the dark for 20 minutes. The IAN solution was removed, and the gels were washed for 20 minutes with 600 µl of 50% ACN/100 mM ABC and then washed for 20 minutes with 600 µl of 50% ACN/25 mM ABC. The gels were briefly dried by SpeedVac and then resuspended in 100 µl of 25 mM ABC containing 500 ng of digestion-grade trypsin (Promega, V5111) and incubated at 37 °C for 16 hours. The supernatants containing the tryptic peptides were transferred to new Eppendorf tubes. Residual peptides in the gel bands were extracted with 250 µl of 80% ACN/0.1% TFA for 15 minutes and then combined with the original digests and dried in a SpeedVac. Peptides were dissolved in 24 µl of MS loading buffer (2% ACN, 0.2% TFA), with 5 µl injected for LC–MS/MS analysis.
LC–MS/MS data collection
LC–MS/MS analysis was performed on a Thermo Fisher Scientific Q Exactive Plus equipped with a Waters nanoAcquity UPLC system using a binary solvent system (A: 100% water, 0.1% formic acid; B: 100% ACN, 0.1% formic acid). Trapping was performed at 5 µl min−1, 99.5% buffer A for 3 minutes using an ACQUITY UPLC M-Class Symmetry C18 Trap Column (100 Å, 5 µm, 180 µm × 20 mm, 2G, V/M; Waters, 186007496). Peptides were separated at 37 °C using an ACQUITY UPLC M-Class Peptide BEH C18 Column (130 Å, 1.7 µm, 75 µm × 250 mm; Waters, 186007484) and eluted at 300 nl min−1 with the following gradient: 3% buffer B at initial conditions; 5% B at 2 min; 25% B at 140 min; 40% B at 165 min; 90% B at 170 min; 90% B at 180 min; return to initial conditions at 182 minutes. MS scans were acquired in profile mode over the 300–1,700 m/z range using one microscan, 70,000 resolution, AGC target of 3 × 10⁶ and a maximum injection time of 45 ms. Data-dependent MS/MS scans were acquired in centroid mode on the top 20 precursors per MS scan using one microscan, 17,500 resolution, AGC target of 1 × 10⁵, maximum injection time of 100 ms and an isolation window of 1.7 m/z. Precursors were fragmented by HCD activation with a collision energy of 28%. MS/MS scans were collected on species with an intensity threshold of 1 × 10⁴, charge states 2–6 and peptide match preferred. Dynamic exclusion was set to 30 seconds.
Peptide identification
Data were analyzed using Proteome Discoverer software version 2.2 (Thermo Fisher Scientific). Data searching was performed using the Mascot algorithm (version 2.6.1) (Matrix Science) against the SwissProt database with taxonomy restricted to human (20,368 sequences) or mouse (17,034 sequences) as well as a streptavidin sequence. The search parameters included tryptic digestion with up to two missed cleavages, 10-ppm precursor mass tolerance and 0.02-Da fragment mass tolerance and variable (dynamic) modifications of methionine oxidation and carbamidomethyl cysteine. Normal and decoy database searches were run, with the confidence level set to 95% (P < 0.05). Scaffold version 5.1.2 (Proteome Software) was used to validate MS/MS-based peptide and protein identifications. Peptide identifications were accepted if they could be established at greater than 95.0% probability by the Scaffold Local FDR algorithm. Protein identifications were accepted if they could be established at greater than 99.0% probability and contained at least two identified peptides (one uniquely assignable to the protein). Proteins that contained similar peptides and could not be differentiated based on MS/MS analysis alone were grouped to satisfy the principles of parsimony. Proteins sharing significant peptide evidence were grouped into clusters. Label-free quantification was performed with Scaffold software. Spectral intensity values were used for protein quantification between groups.
To search for biotinylation sites in the anti-biotin antibody pulldown samples, the variable modifications of Biotin-XX-Tyramide were configured to account for marker ions resulting from fragmentation of biotinylated peptides. These marker ions have the following m/z values and elemental composition losses from the fully modified amino acid: dehyrdrobiotin (m/z 227.08), Biotin-X ion (m/z 340.25), Biotin-XX ion (m/z 453.25), immonium of tyrosine-Bxxp with loss of ammonia (m/z 706.38) and immonium of tyrosine-Bxxp (m/z 723.38).
Proteomic data analysis
Before the data analysis, missing values were removed. For example, if a protein A had 0 spectra count detected in all the samples, including tests and controls, then protein A was removed from the list. NTSC and NTPI are two common methods for proteomic quantification. For PLD3-labeled PAAS proteomes in humans, we compared NTSC and NTPI methods and used the shared proteomic hits for downstream analysis. For PLD3-labeled PAAS proteomes in mice, Lamp1-labeled proteomes in mice and NeuN-labeled neuronal nuclei and perinuclear cytoplasm proteomes in mice, we used NTSC for quantification. To obtain the PAAS proteome, differentially expressed proteins were analyzed by comparing proteomic hits obtained from PLD3-labeled samples versus those from control samples using no antibody. This allowed the filtering of endogenously biotinylated proteins and non-specific binders to streptavidin beads. To obtain the optimal cutoff values for the statistical analysis, we tested different degrees of stringency for FDR (0.1, 0.05 and 0.01) and FC (1 and 1.5). An optimum cutoff P < 0.05, FDR < 0.1 and FC > 1.5 was used for these datasets, as it captures the maximum numbers of known PAAS proteins while excluding the maximum numbers of potential contaminants. Post-cutoff proteomic lists were scrutinized for possible glial contaminations by cross-validations using single-cell RNA sequencing (scRNA-seq) transcriptomics in mice55 and humans93 and Tissue Atlas in the Human Protein Atlas94. When a gene had a fragments per kilobase of transcript per million mapped reads (FPKM) < 10 in neurons and an FPKM > 10 in other cell types in the mice scRNA-seq dataset55, or the mean expression level was less than 0.03 in neurons but greater than 0.03 in glia in the AD pathology human scRNA-seq dataset93, and protein expression was not detected in neurons from the Tissue Atlas94, this gene was excluded from the proteomic results. Two such genes (EPHX1 and PSAT1) were excluded from the PAAS proteome in humans with AD, and five such genes (Gsn, Ephx2, Gfap, Myh9 and Anxa2) were excluded from the PAAS proteome in AD mice. Proteomic hits that passed these thresholds were considered the final PAAS proteomes in humans with AD or AD mice. Lists of raw and filtered proteomic hits of PAASs and neuronal soma proteomes in humans with AD and AD mice can be found in Supplementary Table 1.
For GO analysis (Fig. 3a and Extended Data Figs. 4c and 7b), we uploaded the final proteomes to https://geneontology.org/ (refs. 95,96), g:profiler97 or the ToppGene Suite search portal98 and plotted the top 10 or top 20 retrieved terms on cellular compartment or biological process with the lowest FDRs. Pathway enrichment analysis was performed by retrieving GO biological process, cellular component and molecular function terms from g:profiler97 using terms size 5–200. The enrichment map was visualized in Cytoscape (version 3.9.1)99. For Ingenuity Pathway Analysis (IPA) (Fig. 3b,c and Extended Data Fig. 4d,e), the human or mouse PAAS proteome was imported into IPA software (Qiagen, 2022 release version)100 for canonical pathway analysis. The top IPA pathways with the lowest FDRs and potential relevance to PAAS pathology are listed. For GSEA (Fig. 4a), PLD3-labeled proteomes of humans with AD and unaffected controls were uploaded into Broad Institute GSEA software 4.3.2 (ref. 101) to perform GO analysis using default values, except the size was set to 200 to remove the larger sets from analysis. GSEA results were loaded into Cytoscape (version 3.9.1) for pathway enrichment analysis using EnrichmentMap102 and AutoAnnotate103 plugins with default values. Principal component analysis was performed using Qlucore Omics Explorer version 3.6 (Qlucore AB).
Immunofluorescence of fixed specimens and human iPSC-derived co-culture
The complete list of antibodies, dilution factors and immunofluorescence instructions for immunofluorescence staining of fixed specimens of humans and mice can be found in Supplementary Table 2. In brief, for mouse and human brains, fixation and vibratome sectioning was the same as described in the ‘Proximity labeling in brain tissue’ subsection. Heat-induced sodium citrate antigen retrieval was performed when necessary (see immunofluorescence instructions in Supplementary Table 2). Immunofluorescence staining was then performed with the following protocol: tissue was boiled in 50 mM sodium citrate with 0.05% Tween 20 at 95 °C for 45 minutes, followed by a 30-minute cool down at room temperature and rinse with PBS for three times. Primary antibody incubation was 12 hours to 3 days at 4 °C in blocking buffer (PBS with 1% BSA and 0.1% Tween 20), and secondary antibodies were incubated in blocking buffer at 4 °C overnight. Thioflavin S (Sigma-Aldrich, T1892, 2% w/v stock solution, 1:10,000 staining) was used for labeling amyloid deposits. Three times washes with PBST were performed before mounting tissues on slides with PermaFluor (Thermo Fisher Scientific, TA-030-FM).
For immunofluorescence of human iPSC-derived neuron–astrocyte co-culture, cells were washed three times with pre-warmed PBS before fixing with 4% PFA (ice cold) at room temperature for 20 minutes. Cells were washed with PBS for 15 minutes three times and were blocked with blocking buffer (1% BSA in PBS, plus 0.1% Tween 20) for 1 hour. Primary antibodies were diluted in blocking buffer and incubated with cells at 4 °C overnight. Cells were washed with PBST for 15 minutes three times. Secondary antibodies were diluted in blocking buffer and incubated with cells at 4 °C overnight. Thioflavin S (2% w/v stock solution, 1:10,000 staining) was diluted in PBS and incubated with cells at room temperature for 5 min. Cells were washed with PBST for 15 min three times before imaging.
Fixed tissue and live cell time-lapse confocal microscopy imaging
An upright or an inverted Leica SP8 confocal microscope was used to generate all images. Laser and detector settings (GaAsP hybrid detection system, photon counting mode) were maintained constant. For all analyses, single z-stack images or tiled images were obtained in the somatosensory cortex in mice. All images were obtained using a ×63 oil immersion objective (numerical aperture (NA) 1.40), ×40 water immersion objective (NA 1.10) or ×25 water immersion objective (NA 0.95) at 1,024 × 1,024-pixel resolution and z-step size of 1 μm, as we previously described31. When indicated, deconvolution was performed using the default setting in Leica SP8 LAS X software. For time-lapse imaging of spheroid growth in human neurons, 96-well plates were imaged in a Leica SP8 incubator, with the temperature set at 37 °C and supplied with CO2. Tilling images were obtained using a ×63 oil immersion objective (NA 1.40) at 512 × 512-pixel resolution, zoom factor at 3 and z-step size of 1 μm or 1.5 μm at every day for 7 days.
Lentivirus plasmid purification, lentivirus production and concentration
Escherichia coli stocks for pMDLg/pRRE (MDL), pRSV-Rev (Rev), pCMV-VSV-G (VSVG), FUW-M2rtTA and pLV-TetO-hNGN2-eGFP-Puro were purchased from Addgene (12251, 12253, 8454, 20342 and 79823, respectively). Bacteria was grown in 500 ml of LB broth (Thermo Fisher Scientific, DF0446-07-5) with 100 µg ml−1 ampicillin (Sigma-Aldrich, A9518) overnight at 37 °C with shaking. The next day, bacterial cells were pelleted by centrifugation at 4,000g for 10 minutes at 4 °C. The supernatant was discarded, and plasmids were purified using a PureLink HiPure Plasmid Filter Maxiprep Kit (Invitrogen, K210017), following the manufacturerʼs instructions.
Third-generation lentiviral vectors were produced as we previously described104. In brief, HEK293T cells (Invitrogen, R700-07) were grown in 15-cm plates (Falcon, 353025) in DMEM (Gibco, 12430054) supplemented with 10% FBS (Gibco, 10438026) until reaching 70–80% confluency. For cell transfection, the following solution was prepared in 500 µl of pre-warmed Opti-MEM (Gibco, 31985062) per plate: 12.2 µg of transfer plasmid, 8.1 µg of MDL, 3.1 µg of Rev, 4.1 µg of VSVG and 110 µL of polyethylenimine (1 µg µl−1; Polysciences, 23966-2). This solution was incubated for 10 minutes at room temperature, vortexed gently and added dropwise onto HEK293T cells for transfection. Medium was changed after 6 hours of incubation and harvested at 48 hours and 72 hours after transfection. Media containing viral particles were sterile filtered and concentrated using a Lenti-X Concentrator (Takara Bio, 631231), according to the manufacturerʼs instructions.
Human neuron–astrocyte co-culture AD model
Human iPSC control lines 3182-3 and 2607 were used in this study, as we first described this line in ref. 91. Maintenance and passaging of human iPSCs were performed as we previously described105. Human primary astrocytes (Thermo Fisher Scientific, N7805200, or ScienCell, 1800) were maintained as described in the user manual. iPSC-derived NGN2-induced glutamatergic neuron generation was performed as we previously described105. In brief, human iPSCs maintained in six-well plates were harvested by incubating in Accutase (Innovative Cell Technologies, AT104) 1 ml per well plus 10 µM ROCK inhibitor THX (RI) (Tocris, 1254) at 37 °C for 20 minutes. Dissociated iPSCs were then collected in a 50-ml Falcon tube and mixed well with DMEM (Thermo Fisher Scientific, 11966025) (preferably 1:3 Accutase: DMEM). iPSCs were centrifuged for 4 minutes at room temperature at 1,000g. iPSCs were resuspended in 1–2 ml of StemFlex (Thermo Fisher Scientific) with 10 µM RI and counted and diluted in StemFlex with THX to a cell suspension concentration of 1 × 10⁶ cells per milliliter. Lentiviruses NGN2-Puro and rtTA (titer 4.40 × 10¹⁰ gc ml−1) at 50 µl per 106 cells of suspension were added. Cells were mixed and dispensed at 120,000 cells per well (six-well size) coated with 1× Geltrex (Thermo Fisher Scientific). Cells were incubated at 37 °C in an incubator overnight. Days in vitro (DIV) 1: media were replaced with induction media (DMEM F-12 with GlutaMAX and sodium pyruvate (Thermo Fisher Scientific, 10565018), 1% N-2 (Thermo Fisher Scientific, 17502048), 2% B-27-RA (Thermo Fisher Scientifiic, 12587010) and doxycycline for a final concentration of 1 µg ml−1). DIV2 and DIV3: media were replaced with induction media containing puromycin (2 µg ml−1) on each day. DIV4: neurons were dissociated with Accutase plus 10 µM RI for 20 minutes, washed off with 1:3 DMEM, resuspended and centrifuged at 1,000g for 5 minutes. Pellet was resuspended at a concentration of 1 × 10⁶ cells per milliliter in neuron media (BrainPhys; STEMCELL Technologies, 05790), 1% N-2, 2% B-27-RA, 1 μg ml−1 Natural Mouse Laminin (Thermo Fisher Scientific, 23017015), 20 ng ml−1 BDNF (R&D Systems, 248), 20 ng ml−1 GDNF (R&D Systems, 212), 250 μg ml−1 dibutyryl cyclic-AMP (Sigma-Aldrich, D0627), 200 μM L-ascorbic acid (Sigma-Aldrich, A4403) and 1× Anti-Anti (Thermo Fisher Scientific) with doxycycline 1 μg ml−1, puromycin 2 μg ml−1, 4 µM AraC (Sigma-Aldrich, C6645) and 10 µM RI. Neurons were re-plated onto 2× Geltrex-coated 96-well-plates (PerkinElmer, 6055302) and seeded at 1 × 10⁵ per well (96-well plate size). DIV5: media were replaced with neuron medium containing puromycin 2 μg ml−1 and AraC 4 μM. DIV6: media were replaced with neuron medium with 4 μM AraC. DIV8: media were replaced with neuron medium with 2 μM AraC. DIV10: human primary astrocytes were dissociated with TrypLE (Thermo Fisher Scientific), washed with DMEM, centrifuged at 400 rcf for 5 minutes, counted and plated into NGN2 neurons culture at 20,000 cells per well (96-well plate size). Human iPSC-derived neuron–astrocyte co-culture was maintained as previously described57 with modifications. In brief, human neuron–astrocyte co-cultures were maintained in neuron media plus 1.5% FBS for 1 week and then FBS was reduced to 0.5% for another week. Media were half-changed every other day. After that, human neuron–astrocyte co-cultures were maintained in neuron maintenance medium (1× BrainPhys Basal (STEMCELL Technologies), 1× B27 with vitamin A (Thermo Fisher Scientific), 1× N2 (Thermo Fisher Scientific), 5 μg ml−1 cholesterol (Sigma-Aldrich), 1 mM creatine (Sigma-Aldrich), 10 nM β-estradiol, 200 nM ascorbic acid, 1 mM cAMP (Sigma-Aldrich), 20 ng ml−1 BDNF (PeproTech), 20 ng ml−1 GDNF (PeproTech), 1 μg ml−1 laminin, 0.5 mM GlutaMAX (Thermo Fisher Scientific), 1 ng ml−1 TGF-β1 (PeproTech), 1× normocin (InvivoGen), 50 U ml−1 penicillin– streptomycin (Thermo Fisher Scientific)) with half-change of media every other day until harvest or other assays. For AD modeling, Aβ1–42 peptide (AnaSpec, AS-72216) was oligomerized to prepare soluble Aβ species as previously described57,106. In brief, soluble Aβ species were added to the neuron maintenance medium at a final concentration of 5 μM and applied to the human neuron–astrocyte co-culture for 7 days, with half-change of media every other day as previously described57.
For mTOR signaling inhibition, Torin1 (Tocris, 4247) or vehicle DMSO was added to the neuron maintenance medium at a final concentration of 250 nM (ref. 59) and applied to the human neuron–astrocyte co-culture 3 days before Aβ treatment. Then, Torin1 or vehicle DMSO was added to the neuron maintenance medium at 250 nM concentration, along with soluble Aβ species at 5 μM concentration, and applied to the human neuron–astrocyte co-culture for 7 days, with a half-change of media every other day. For Torin1 treatment after axon spheroid formation, soluble Aβ species at 5 μM concentration was applied to the human neuron–astrocyte co-culture for 7 days, and then Torin1 or vehicle DMSO was added to the neuron maintenance medium at 250 nM concentration for another 7 days.
For time-lapse imaging of spheroid growth in human neurons, AAV9-hSyn-mCherry (Addgene, 114472) and AAV2-CAG-LAMP1-GFP (home produced as we previously described4) were co-transduced at 2 × 10⁹ vg per 100 μl of medium in 4-month-old co-cultures. Human neuron–glia co-cultures were treated with amyloid at day 150. Time-lapse confocal imaging was performed several hours before the treatment and imaged every day after treatments.
Calcium imaging in iPSC-derived human neurons
AAV1-CAMKII-GCamp8f (Addgene, 176750, 7 × 10¹² vg ml−1) was transduced in 2-month-old iPSC-derived human neurons, along with AAV9-CB7-mCherry (Addgene, 105544, 1 × 10¹³ vg ml−1) at 1 μl per 0.2 Mio cells. Transduced cells were maintained with regular media changes. Calcium imaging was performed 1 month after transduction. Calcium imaging was performed using an Andor Dragonfly spinning disk confocal on a Nikon Ti2-E microscope. A ×20/0.75 NA air objective and a Zyla scientific complementary metaloxide semiconductor (sCMOS) camera were used. Imaging was performed in culture medium, and a stage-top incubator and objective heater (Oko-Lab) maintained the sample temperature at 37 °C. For stimulated calcium imaging, a pair of tinfoil wire electrodes separated approximately 1.5 mm apart were placed in the bottom of the well using a micromanipulator and used for electrical stimulation. Electric stimulation was performed using the trigger out function in the Andor software. GCaMP8f-labeled neurons were imaged through excitation at 488-nm wavelength with the acquisition speed of 20 Hz and 512 × 512 resolution. Stimulation trains of 20-ms pulses were delivered to the electrodes at 50 Hz (20-ms interval) with 300–700-μA currents for 1 second. Electric stimulation was triggered automatically at the 100-frame timepoint, and image for 300–500 frames in total. The calcium responses within the imaging window were monitored upon stimulation.
Calcium imaging raw data were de-noised using DeepCAD-RT107. The denoising model was trained with the different datasets acquired with the same imaging conditions. The denoised GCaMP8f fluorescence intensity was normalized to ΔF/F for analysis. Several regions of interest (ROIs) were selected on each axon. The average ΔF before stimulation was used as the baseline measurement. The raw fluorescence intensity over time (F(t)) contained background noise. To isolate the stimulus-evoked signal, we first calculated the average background fluorescence intensity (F0) using data from before stimulus presentation. We then normalized the signal by subtracting F0 at each timepoint:
This normalized signal was smoothed using a Savitzky–Golay filter with a window length of 21 data points (1 second) and a polynomial order of 3. This filtering reduced noise while preserving the overall shape of the signal. To quantify the rising slope of the calcium response, we identified the peak of the smoothed signal. The timepoint halfway to this peak (({t}_{1/2})) was then determined. A linear regression was performed using the nine data points surrounding ({t}_{1/2}). The slope of this regression line provided an estimate of the rising slope of the calcium signal in response to the sensory stimulus.

To determine the onset time of the response for each ROI after electrical stimulation, we employed an exponential growth model to fit the rising phase of the signal. Before reaching its peak, the normalized calcium trace can be effectively approximated using the following piecewise function:
The curve fitting procedure was performed using the curve_fit function available in the scipy.optimize package. In this context, ({f}_{0}) and ({f}_{max }) represent the baseline and maximum normalized calcium signals, respectively. The parameter (tau) characterizes the timescale of the rising phase, and ({t}_{s}) denotes the response time—the specific timepoint at which the calcium signal initiates its ascent.
The calcium decay time constant (τ) was estimated by fitting 2.5-second calcium trace beginning from the peak to an exponential equation: Y = a × exp(−x / τ).
Viral-mediated Mtor heterozygous knockout in Mtor-floxed 5×FAD mice
mTOR is known to be a regulator of cell growth35,59, and previous studies showed that cell size was indistinguishable between the Mtor heterozygous knockout and WT cells108, which suggests that the effects of Mtor knockout on cell size is Mtor gene copy dose dependent. Thus, we obtained Mtor heterozygous floxed AD mice to achieve conditional Mtor heterozygous knockout, which had no effect on cell body size (Fig. 6o and Supplementary Fig. 10d). To achieve global neuronal Mtor heterozygous knockout in Mtor-floxed 5×FAD mice, 10 μl of AAV-PHPeB-hsyn-cre-eGFP (Addgene, 105540, titer ~1 × 10¹³ vg ml−1) or AAV-PHPeB-CAG-GFP (Addgene, 37825, titer ~1 × 10¹³ vg ml−1) was retro-orbitally injected into 6-week-old Mtor-floxed 5×FAD mice. To achieve sparse neuronal Mtor heterozygous knockout, 1 μl of AAV9-hsyn-cre-2a-tdT (Addgene, 107738, titer ~1 × 10¹³ vg ml−1) was diluted with 3 μl of PBS and injected into the subarachnoid space of one hemisphere at the level of somatosensory cortex in Mtor-floxed 5×FAD mice, as we previously described31. Mouse brains were collected 2 months after virus injection in the AAV-PHPeB experiment or at 2.5 months for the AAV9-hsyn-cre-2a-tdT-injected mice. Brains were sliced, stained and imaged with confocal microscopy as mentioned above and as we previously described31. For sparsely PHP.eB-hSyn-Cre-GFP virus labeling in mouse brains, 3 μl of AAV-PHPeB-hsyn-cre-eGFP (Addgene, 105540, titer ~1 × 10¹³ vg ml−1) was diluted in 30 μl of PBS and retro-orbitally injected.
RNAscope in 5×FAD mice brain slices
5×FAD mice brains were freshly dissected and immediately froze in Tissue-Tek optimal cutting temperature (OCT) compound (Sakura) and kept in dry ice with 70% ethanol for 5 –10 minutes and then transferred to −80 °C for long-term storage. Frozen brain blocks were sectioned at 10-μm thickness by cryostat (Leica). RNAscope was performed using an RNAscope Multiplex Fluorescent Kit V2 (ACD, 323270) according to the fresh frozen tissue protocol. Poly(A) probe (ACD, 318631) or negative control probe (ACD, 320871) was used during probe incubation. Before counterstain with DAPI and mounting media, Atto 657 NHS ester (Millipore, 07376) was diluted 1:100, and brain sections were stained for 10 minutes, followed by three-times PBS washes, 5 minutes per wash. Negative control samples were used to set the baseline parameters for confocal imaging, before imaging the poly(A) probe samples.
NHS ester was used to label the spheroid halo, because when we attempted to perform RNAscope and co-stain with axonal spheroid markers, such as PLD3, SMI312, APP, RAGC, ATP9A, and ATP6V0A1, we found that these antibodies were not compatible with the RNAscope protocol, a well-known limitation of this technique. Therefore, we leveraged the knowledge from pan-expansion microscopy109 that NHS ester can be used to non-specifically label tissues and reveal subcellular structures using confocal imaging. We applied NHS ester after RNAscope, ensuring that the NHS ester staining did not interfere with the poly(A) probe signal from RNAscope. Interestingly, in the cortex of 5×FAD mice, NHS ester highlighted the neuritic plaque nicely, allowing us to use it as a marker for spheroids, especially at the periphery of the halo.
Puromycylation in live mouse brains
Puromycylation was performed as previously described110 with a few modifications. In brief, 25 mg of puromycin (Sigma-Aldrich, P7255) was diluted in 278 μl of DMSO to make the puromycin stock solution. Puromycin working solution includes 10 μl of puromycin stock solution, 10 μl of DMSO and 80 μl of PEG400 (puromycin final concentration at 9 mg ml−1). Anisomycin (Sigma-Aldrich, 9789) stock solution was made as follows: 20 μl of DMSO was added to 5 mg of anisomycin and centrifuged at 200g for 3 minutes. Heat in a 42 °C water bath for 2–3 minutes, until the pipette completely dissolves. Then, 40 μl of PEG400 was added dropwise with agitation. Solution should be kept clear with no precipitation. Anisomycin working solution was made as follows: 30 μl of anisomycin stock solution, 10 μl of puromycin stock solution (or DMSO vehicle) and 60 μl of PEG400. To make Torin1 stock solution, 10 mg of Torin1 was added to 3.292 ml of DMSO and 3.292 ml of PEG400 (Torin1 final concentration at 2.5 mM). Torin1 working solution was made as follows: 30 μl of Torin1 stock, 10 μl of puromycin stock (or DMSO vehicle) and 60 μl of PEG400. All the reagents were freshly made and checked that there was no precipitation during the experiment. Mice craniotomy at the somatosensory cortex was done as we previously described4. After removing dura, vehicle or anisomycin or Torin1 working solution was topically applied to the cranial window. For anisomycin assay, solution was applied for 30 minutes and then quickly removed and replaced with anisomycin plus puromycin solution for 10 minutes. After quick PBS washes, mice were transcardially perfused with PBS and 4% PFA. For Torin1 treatment, drugs were incubated for 2 hours, with reapplication three times to avoid drying. Brains were vibratome sectioned at 50-μm thickness. Sections were incubated for 20 minutes with co-extraction buffer (50 mM Tris-HCl, pH 7.5, 5 mM MgCl2, 25 mM KCl, protease inhibitor (Roche) and 0.015% digitonin (Wako Chemicals, 043-21376)). After three rinses with PBS, sections were incubated in blocking buffer (0.05% saponin, 10 mM glycine and 5% FBS in PBS) for 30 minutes. Then, sections were incubated in blocking buffer with puromycin 647 antibody (Millipore, MAB E343-AF647, 1:1,000), NeuN antibody (Abcam, ab177487, 1:200) or Lamp1 (Developmental Studies Hybridoma Bank, 1D4B, 1:200) for 72 hours at 4 °C. Sections were washed with PBS 3 × 10 minutes and then incubated with secondary antibodies along with puromycin 647 at 4 °C overnight, followed by PBS washes 3 × 15 minutes.
STED imaging
STED imaging was performed as we previously described111. In brief, human postmortem brain tissues underwent processing using immunofluorescence staining and proximity labeling techniques outlined in the ‘Proximity labeling in brain tissue’ and ‘Immunofluorescence of fixed specimens’ subsections until the stage involving secondary antibodies and streptavidin labeling. The axonal spheroids and biotinylated proteins were labeled using STED-compatible secondary antibody Atto 594 (Sigma-Aldrich) (1:100 dilution) and Atto 647N–streptavidin (Sigma-Aldrich) (1:100 dilution). Subsequently, the tissues were mounted with Prolong Gold (Thermo Fisher Scientific) following the user manual and left in the dark at room temperature for 24–72 hours before imaging. STED imaging was carried out using a Leica SP8 STED 3X equipped with a pulsed white light laser (NKT Photonics, SuperK Extreme EXW-12) for excitation and a 775-nm pulsed laser for depletion (Onefive Katana-08HP). The alignment of excitation and STED beams was accomplished using 200-nm Crimson FluoSpheres (Thermo Fisher Scientific, F8782). Sample imaging was performed using the following parameters: Sequence 1: 594-nm laser was at 1.15 µW. Sequence 2: 646-nm laser was at 6.4 µW. Sequence 3: 646-nm laser was at 34 µW. Sequence 4: 594-nm laser was 14 µW. Sequences 3 and 4: 775-nm STED laser was at 33 mW.
Samples for focus ion beam/scanning electron microscopy
Mice brains or fixed postmortem human brains were vibratome sectioned into 50-μm thickness as described in the ‘Proximity labeling in brain tissue’ subsection4. Trimmed tissue samples were fixed in 2.5% glutaraldehyde and 2% PFA in 0.1 M sodium cacodylate buffer, pH 7.4, containing 2 mM calcium chloride for 1 hour and then rinsed in buffer and post-fixed in 1% osmium tetroxide and 1.5% potassium ferrocyanide for another hour. After rinsing well, the samples were immersed in aqueous 1% thiocarbohydrazide for 30 minutes and then well rinsed. They were then placed in 1% osmium tetroxide in water for 1 hour at room temperature, followed by rinsing in distilled water. An overnight en bloc stain in aqueous 1% uranyl acetate was followed by rinsing in distilled water, and then the samples were placed into warm lead aspartate and kept at 600 °C for 1 hour. After 1 hour of rinsing in distilled water, the samples were dehydrated through an ethanol series to 100%, followed by 100% propylene oxide. The samples were infiltrated with Durcupan (Electron Microscopy Sciences) resin over 2 days and then placed in silicone molds and baked at 600 °C for at least 48 hours. The resin block was trimmed to a rough area of interest, and the surface was cleanly cut. The entire pyramid was carefully removed with a fine blade and mounted on an aluminum stub using conductive carbon adhesive and silver paint (Electron Microscopy Sciences) and then sputtered with approximately 15-nm Platinum/Palladium (80/20) using Cressington HR sputter coating equipment (Ted Pella) to reduce charging effects.
A dual-beam focus ion beam/scanning electron microscopy (FIB/SEM) instrument (Zeiss, CrossBeam 550) using a gallium ion source was used to mill, and an SE2 secondary electron detector was used to image the samples. A SmartSEM (Zeiss) was used to set up initial parameters and to find the ROIs by SEM images at 10 kV, 45-μm width and 30-μm height. The actual depth was 22 μm with 10 nm per pixel and 10 nm per slice. A platinum protective layer was deposited at the ROI with the FIB (30 kV, 3 nA) to protect the structure and reduce charging. Milling and highlighting were done at 30 kV and 50 pA, with a carbon deposit (30 kV, 3 nA). A course trench was milled (30 kV, 30 nA), followed by fine milling (30 kV, 3 nA), and, for final acquisition, a cuboid the area of interest was milled at 30 kV and 300 pA. After milling each slice, an image was taken by detecting backscattered electrons of a primary electron beam (acceleration voltage of 1.5 kV, imaging current of 2 nA and aperture diameter of 100 µm) with a pixel dwell time of 3 µs Atlas5 (Zeiss) was used for preliminary SEM stack alignment, and FIB/SEM image stacks were saved as tiff and MRC files. The images were imported into Dragonfly software (Object Research Systems) for further alignment, segmentation and three-dimensional (3D) video.
FIB/SEM image annotation and segmentation
Images from the z-stack at different z-locations were imported into APEER (Zeiss). Spheroids and plaques within the images were then manually annotated. After annotating 37 images, models were trained to predict each object. Then, individual spheroid and plaque segmentation models were downloaded and imported into Vision4D 4.1.0 (Arivis) for object segmentation. The entire z-stack was then segmented in the analysis pipeline via the Deep Learning Segmenter operation with all the z-stacks within the dataset. Next, non-specific and overlapping annotations were manually corrected using the Draw Objects tool. Object color and opacity were modified using the Set Object Style tab to show raw data. The z-stack was then played using the Movie Player and recorded using Capture.
Image analysis and quantification
All analyses were processed with FIJI (ImageJ) software, unless otherwise described.
-
1.
Quantification of PLD3 raw integrated fluorescence intensity in human brain. After PLD3 immunolabeling, we compared the number and intensity of pixels corresponding to the PAAS halo versus the rest of the field of view, representing mostly neuronal soma and neuropil. For this, we used three AD postmortem brains that had been used for PAAS proteomics. Immunofluorescence staining of PLD3 and thioflavin S staining were performed, followed by confocal imaging. Background autofluorescence signals were measured in unstained brain slices and subtracted from all subsequent image quantifications to better reflect true PLD3 signal. PAAS halos were manually circled, and the raw integrated intensity (RawInt) was measured. The RawInt was also measured for the whole field of view. The sum of RawInt derived from PAAS halos was subtracted from the RawInt from the whole field of view. By subtracting the halo RawInt from the total RawInt, we obtained a measurement of the PLD3 labeling outside of plaques, which mainly consists of neuronal cell bodies, neuropil and any minimal background fluorescence.
-
2.
p-mTOR S2448 fluorescence intensity measurement. In human AD or no/mild AD postmortem brains, each zoom 1 z-stack image, containing SMI312-positive axonal spheroids around amyloid plaques, was maximum projected. Then, SMI312-positive spheroid halos were circled, and mean fluorescence intensity of the p-mTOR S2448 channel was measured within the selected circle. In the same field of view, regions without spheroids were considered as background. Three such background regions were selected and circled, and p-mTOR mean intensity was measured. The three ‘background’ p-mTOR mean intensity values from each field of view were averaged. Mean intensity (p-mTOR dystrophy halo) / mean intensity (p-mTOR background) was calculated to represent the p-mTOR expression level in each axonal spheroid halo. Three fields of view were quantified in each patient with severe AD, and 1–3 fields of view were quantified in each patient with no/mild AD. The averaged p-mTOR expression level in each patient was used for statistical analysis.
-
3.
Measurement of the size of individual axon spheroids in human iPSC-derived neurons in the Torin1 treatment experiment. SMI312 was used to label spheroids, and thioflavin S was used to label amyloid plaques. Tiling images were taken in each well from a 96-well plate and were maximum projected. For Torin1 treatment before amyloid plaque and spheroid formation, individual axonal spheroids were circled using the freehand tool in ImageJ, and the circle area was measured. The total number of axonal spheroid halos analyzed ranged from 50 to 150 within each tilling image. Two technical replicate wells were analyzed in each experiment, and three batches of experiments were performed for quantification. For Torin1 treatment after amyloid plaque and spheroid formation, machine-learning-based image analysis software Aivia version 12 (Leica) was used to quantify the size and number of spheroids and amyloid plaques as well as axon density in an automated fashion. The pixel classifier tool was used to classify each channel.
-
4.
Measurement of the percentage of axonal segments with spheroids in human iPSC-derived neurons in the Torin1 treatment experiment. The SMI312 staining revealed both axonal spheroids (the spheroid shape) and axons (the linear shape), therefore allowing us to recognize individual axon segments. To quantify axons with spheroids, we traced individual axon segments with linear and continuous signal across the z-stacks within the field of view. An axon with one or more spheroids formed was defined as axon with spheroid, whereas axon segments without spheroids observed within the z-stack were defined as axons without spheroids. In Fig. 6l, the percentage of axons with spheroids was calculated by comparing the number of axonal segments with spheroids over the total number of axonal segments that were observed within the field of view.
-
5.
Measurement of human neuron cell body size with or without Torin1 treatment. iPSC co-cultures were infected by AAV2-CB7-GFP (Addgene, 105542) at titer ~7 × 10⁹ vg ml−1 1 week before Torin1 and Aβ treatment. Cells were stained with NeuN and GFP antibodies. Large field tilling imaging was performed in each well. Tilling images were maximum projected, and neurons with both NeuN and GFP positive signals were measured by size, using the freehand tool in ImageJ. Three technical replicate wells were analyzed in each experiment, and two batches of experiments were done for quantification.
-
6.
Individual axonal spheroid size measurement in the AAV9-hSyn-cre-2a-tdT infected Mtor-flox 5×FAD mice. Anti-Lamp1 antibody was used for immunofluorescence staining to showcase the spheroid halo around amyloid plaques; thioflavin S was used to label amyloid plaques; and anti-RFP antibody was used to reveal the tdTomato expression in infected neurons. Tilling images were taken at the somatosensory cortex of each animal. Three serial brain sections were used for tilling imaging for each mouse. An individual spheroid was counted when it was both tdTomato positive and Lamp1 positive. The individual spheroid size was measured using the freehand tool in ImageJ to circle the outline of spheroids, where it had the maximum diameter, followed by measurement of the circled area. The total number of axonal spheroid halos analyzed ranged from 50 to 150 in each tilling image.
-
7.
Measurement of spheroid halo size in the AAV-PHPeB-infected Mtor-flox 5×FAD experiment. Anti-Lamp1 antibody was used for immunofluorescence staining to showcase the spheroid halo around the amyloid plaque, and thioflavin S was used to label amyloid plaques. Tilling images were taken at the somatosensory cortex of each animal. Three serial brain sections were used for tilling imaging for each mouse. A customized ImageJ macro was used to segment individual Lamp1-positive spheroid halos and amyloid plaques. Using a customized MATLAB program, the segmented images were processed to measure the area of individual spheroid halos and amyloid plaque area, automatically. The spheroid halo area was excluding the area in the center occupied by the amyloid plaque. The number of axonal spheroid halos and amyloid plaques analyzed ranged from 30 to 70 in each tilling image from the Mtor-flox 5×FAD experiment.
-
8.
Measurement of RNA signals within axonal spheroids. The ImageJ freehand tool was used to circle axonal spheroid structures labeled by Atto 647 NHS ester, and fluorescence intensity from poly(A) probe channel or negative control probe channel was measured. For measuring puromycin signals within axonal spheroids or neuronal cell bodies, similarly, the ImageJ freehand tool was used to circle axonal spheroid or cell bodies labeled by Lamp1 or NeuN, respectively, and fluorescence intensity from puromycin channel was measured.
-
9.
Measurement of NeuN-positive neuronal cell soma area in AAV-PHPeB-infected Mtor-flox 5×FAD mice. A customized CellProfiler program was used for automated measurement. In brief, tilling images were taken from one hemisphere of the somatosensory cortex. Tilling images were maximum projected before importing them into CellProfiler (Broad Institute). The NeuN channel was set as the primary object and was used as the marker for size measurement. Three tilling images were taken from three brain sections of each animal. Three animals were used in each group.
-
10.
Investigation of mTOR heterozygous knockout downstream signaling effectors in mTOR-floxed 5×FAD mice. Similarly, a customized CellProfiler program was used for automated measurement. Tilling images were maximum projected before analysis. To analyze fluorescence intensity in the nuclei, we used DAPI staining as the primary object and measured signals from the NeuN-positive cells. To measure fluorescence intensity from the cell bodies, the NeuN channel was set as the primary object and was used as the marker for fluorescence intensity measurement. We compared mice injected with PHPeB-hSyn-cre-GFP viruses to those injected with control viruses PHPeB-CAG-GFP. The littermates and sex were paired for comparison. Immunofluorescence intensity of TFEB was measured in neuronal nuclei, whereas LC3B, P-p70S6K Thr389 and p70S6K were measured in neuronal soma in an automated fashion.
Statistics and reproducibility
Each experiment was repeated independently for at least three times with similar results. Human or mouse samples were grouped by disease stages or ages. Mice were paired by littermate and sex, as indicated in the figure legends. No statistical method was used to predetermine sample size, but our sample sizes were similar to those generally employed in the field. No data were excluded from the analyses. The investigators were not blinded to allocation during experiments and outcome assessment, but we used codes or software to analyze data in an automated and unbiased way whenever possible. Excel (Microsoft), Prism (GraphPad Software), Qlucore Omics Explorer version 3.6 (Qlucore AB), CellProfiler version 4.2.1 (Broad Institute), MATLAB and RStudio (4.0.2) were used for data analysis and plotting. Statistical methods used and P values are described in the figure legend of each relevant panel. All statistical tests were two-sided, including all figures and tables in the main text, extended data or supplementary data.
Reporting summary
Further information on research design is available in the Nature Portfolio Reporting Summary linked to this article.


Responses