Subregion-specific associations of the basal forebrain with sleep and cognition in Parkinson’s disease

Introduction
Sleep disturbances and cognitive dysfunction are commonly reported non-motor symptoms in Parkinson’s disease (PD)1. Sleep disturbances include difficulty falling or staying asleep, excessive daytime sleepiness (EDS), and abnormal events during sleep2. They can manifest in the early stages of PD and become more prominent and troublesome as the disease progresses3, affecting approximately 60–90% of patients overall4. Meanwhile, approximately 40% of patients with PD have mild cognitive impairment at the time of diagnosis5, and up to 80% eventually develop dementia6. Such abnormalities in sleep and cognition were found to be closely related to the quality of life7 and even to the mortality8,9.
The mechanism underlying sleep disturbances and cognitive decline in PD is multifactorial. Nocturnal parkinsonian motor symptoms, nonmotor symptoms such as nocturia or psychiatric symptoms, and treatment-related factors all contribute to poor sleep quality10, while cognitive decline is attributed to misfolded proteins, genetics, and neuroinflammation11. Moreover, the monoaminergic systems, including dopaminergic and non-dopaminergic neurons, are especially vulnerable to PD pathology; their degeneration results in various sleep and cognitive problems12. Because of such complex nature involving multiple cortical and subcortical structures, it was challenging to specify the neural correlates of sleep disturbance and cognitive decline in PD.
The basal forebrain (BF) is one of the most important modulatory neurotransmitter systems in the brain and is extensively involved in cognition, learning, and the sleep-wake cycle13. Neuropathological and neuroimaging studies have revealed that its cholinergic neurons are vulnerable to PD pathology14. Subsequently, clinical studies focused on the implications of the BF cholinergic dysfunction in cognitive disorders including Lewy body disease spectra15. Meanwhile, other studies intensively explored the association between cholinergic dysfunction, especially in the pontine cholinergic nuclei, and REM sleep behavior disorders in PD16,17. However, the significance of the BF cholinergic system in sleep disruptions among individuals with PD was less recognized, despite its crucial involvement in sleep-wake control, sleep architecture, and daytime sleepiness18,19,20.
Here, we aimed to investigate the association of the BF cholinergic system with sleep disturbances and cognitive dysfunction in PD. Drug-naïve patients with PD were recruited to exclude the effects of anti-parkinsonian medications on sleep. The BF is known to have topographical projections, with each subgroup innervating different parts of the cerebral cortex21. Thus, there is a possibility that the BF subregions are divided according to their functions. We hypothesized that within the BF, distinct subregions regulating sleep and cognition were segregated in PD.
Methods
Participants
We retrospectively reviewed the medical records of 79 consecutive patients who were newly diagnosed with PD between May 2021 and July 2023 at the Movement Disorders Clinics of Gangnam Yonsei Severance Hospital. All patients met the criteria for clinically probable PD and exhibited reduced uptake in the posterior putamen in N-(3-fluoropropyl)-2β-carboxymethoxy-3β-(4-iodophenyl) nortropane (18F-FP-CIT) positron emission tomography (PET). The patients underwent the Movement Disorder Society-Sponsored Unified PD Rating Scale (MDS-UPDRS), brain magnetic resonance imaging (MRI), 18F-FP-CIT PET, detailed neuropsychological tests, and the Pittsburgh Sleep Quality Index (PSQI) within 6 months. Medications consumed at the time of the study enrollment were also investigated. The exclusion criteria were as follows: (1) consuming any anti-parkinsonian medications owing to their effect on sleep; (2) the presence of focal brain lesions, severe white matter hyperintensity22, multiple lacunes, or hydrocephalus observed on brain MRI; (3) dementia at the time of baseline evaluation23; and (4) the presence of other major neurological, psychiatric, or metabolic diseases that may affect sleep as well as brain functional connectivity.
We also enrolled 34 age- and sex-matched healthy controls (HC) who had no history of neurological illness, no abnormal signs on neurological examination, and no cognitive impairment in detailed neuropsychological test (described below). Healthy controls underwent brain MRI, neuropsychological tests, and the PSQI. The list of medications they were consuming at the time of study was also reviewed. These healthy participants were recruited from our healthy control cohort.
Standard protocol approvals, registrations, and patient consents
This study was approved by the Institutional Review Board of the Gangnam Severance Hospital (No. 3-2024-0106 and 3-2020-0186). The need for written informed consent was waived for patients with PD due to the retrospective nature of the study. Informed consent for healthy controls was obtained at the time of enrollment in healthy control cohort. All healthy controls understood and agreed that their clinical and imaging data could be used for research purposes in the future. All procedures were performed in accordance with the ethical standards of the 1964 Declaration of Helsinki and its subsequent amendments.
Assessment of sleep disturbance thorough PSQI questionnaire
The PSQI is a self-rated questionnaire consisting of 19 items that assess sleep quality and disturbances. These items are grouped to yield out seven component scores: subjective sleep quality (C1), sleep latency (C2), sleep duration (C3), habitual sleep efficiency (C4), sleep disturbances (C5), use of sleeping medication (C6), and daytime dysfunction (C7)24. Each component score ranges from 0 to 3 and is summed to yield a global PSQI score. High total scores indicate poor sleep quality. A global PSQI score >5 is suggested as the cutoff value to distinguish between good and poor sleepers24. Sleep duration (C3) refers to the actual number of hours the participant has slept in the past month, whereas sleep efficiency (C4) is the ratio between the number of hours spent asleep (C3) and the number of hours spent in bed. The sleep disturbance (C5) sub-score evaluates whether the participants encountered disruptions during sleep, including waking up in the middle of the night, breathing difficulties, nightmares, or pain. We also investigated whether the participants were on benzodiazepines, nonbenzodiazepines, melatonin, antihistamines, anti-psychotics (due to concomitant psychiatric conditions such as mood disorders), or antidepressants, which are known to affect sleep quality. The frequency of medication consumption was evaluated using the C6 sub-score.
Acquisition and image processing of brain MRI
All structural and functional brain MR images were acquired using a 3.0 Tesla MR scanner (MAGNETOM Vida, Siemens Healthineers, Erlangen, Germany) with Siemens 64-channel head coil. T1-weighted sagittal MR images were obtained with a 3D magnetization prepared-rapid gradient-echo sequence (TR/TE = 2300/2.98 ms, flip angle = 9°, 248 x 256 matrix, 176 slices, 1 mm isovoxel). The resting state-functional MRI (rs-fMRI) images were acquired with multiband gradient-echo with echo-planar imaging sequence (TR/TE = 735/39 ms, multiband factor = 8, flip angle = 52°, acquisition in 2.4 mm isovoxel, reconstruction in 192 x 192 x 64 matrix with voxel size 1.2 x 1.2 x 2.4 mm, 490-time frames). Diffusion tensor imaging (DTI) scans were additionally acquired (TR/TE = 3800/65 ms, flip angle = 90°, b-values = 0 and 1000 s/mm2, 64 directions, 224x 224 x 72 matrix, voxel size 1 x 1 x 2 mm).
Preprocessing structural MR images and measuring the BF volume
T1-weighted MR images were first corrected for inhomogeneity and then processed using FreeSurfer 7.2 (Massachusetts General Hospital, Harvard Medical School; http://surfer.nmr.mgh.harvard.edu) for the segmentation of cortical and subcortical areas and the creation of cortical gray and white matter surfaces. In parallel, MR images were segmented into gray and white matter and then spatially normalized to our in-house diffeomorphic anatomical registration through exponentiated lie algebra (DARTEL) template in 181 × 217 × 181 matrix with 1 mm isovoxels. The process was executed using the DARTEL toolbox in statistical parameter mapping 12 (SPM12, Wellcome Centre for Human Neuroimaging, London, UK) implemented in MATLAB 2021a (MathWorks, Natick, MA, USA), and thereby the gray matter density maps were generated.
We used a standard BF volume-of-interest (VOI) designed with post-mortem MRI and cytoarchitectonic maps of BF cholinergic nuclei in the autopsied brains25. This VOI was transferred to the standard Montreal Neurological Institute (MNI) space with 1 mm isovoxels. Finally, by overlaying the standard BF VOI onto the individual gray matter density map, which was a DARTEL-normalized and modulated gray matter segment of the individual T1 image, we quantified the entire volume of the BF and its specific subregions, encompassing Ch1 to Ch4 (Supplementary Fig. S1). The Ch1 refers to the medial septal nucleus, Ch2 to the vertical limb of the diagonal band of Broca, Ch3 to the horizontal limb of the diagonal band of Broca, and Ch4 to the cholinergic component of the nucleus basalis Meynert. Due to their small sizes, we merged Ch1 and Ch2. Furthermore, Ch4 was further subdivided into anterior lateral (Ch4al), anterior intermediate (Ch4ai), and posterior regions (Ch4p).
Preprocessing resting state fMRI
SPM12 and an in-house software implemented in MATLAB 2021a were used for the preprocessing and surface-based statistical analysis of the rs-fMRI images. The rs-fMRI images were first corrected for the slice time. After removing the first 14-time frames corresponding to the initial 10 s, the remaining time frames were realigned using SPM12, and thereby the translational and rotational head motion was measured for each time frame. The B0 image acquired by the DTI sequence and later corrected for eddy current and distortion by the FSL 6 (FMRIB, Oxford, UK) was co-registered to average motion-corrected fMRI image. Subsequently, all time frames of the motion-corrected fMRI images were adjusted for distortion with the deformation map non-linearly registering the average fMRI image to the co-registered B0 image. Through the utilization of Artifact Detection Tools, outlier time frames with a greater than 0.5 mm of framewise displacement or greater than 3 SD of framewise global signal change were automatically flagged. The signals were spatially smoothed with a FWHM 5 mm Gaussian kernel and temporally detrended. Additionally, we obtained significant principal components extracted from the signals in two noise regions-of-interest (ROIs), such as the white matter and cerebrospinal fluid voxels that were least affected by the partial volume effect, by using the component-based noise correction method with the anatomical noise ROI (aCompCor)5,26. Finally, the signals were denoised by regressing out for the nuisance regressors: 6 translation and rotation parameters and their first-degree derivatives, outliers, and significant principal component weights from aCompCor, and then temporally smoothed with the 0.0083 Hz and 0.1 Hz band-pass filter.
Surface-and volume-based seed-to-voxel analysis of BF connectivity
The BF VOIs in the MNI space were backward transformed to individual fMRI space through the inverse normalization of the BF VOI with individual DARTEL flow fields and subsequently resliced to individual fMRI space with the parameter co-registering the T1 image to the average motion-corrected fMRI image. Using this individual BF VOI, we obtained 3D volumes for the Pearson’s correlation coefficients between each BF subregional VOI to each voxel in the denoised fMRI images, and subsequently normalized the range of coefficient values using the Fisher’s r-to-z transformation. In the FreeSurfer, the connectivity values of each cortical voxel were mapped onto the cortical surface model. These connectivity maps on the individual cortical surfaces were spatially normalized to the template surface. Simultaneously, the connectivity maps in the native fMRI space were first inversely resliced to the individual T1 images and subsequently spatially normalized to the MNI space with 2 mm isovoxel by using the DARTEL flow field normalizing T1 image. Additionally, we measured the subcortical regional connectivity values by overlaying the FreeSurfer-generated subcortical segments onto the connectivity maps in the native fMRI space after coregistration. The mean temporal signal to noise ratio for each BF subregion and mean frame-wise displacement are provided in Supplementary Fig. S2.
Neuropsychological evaluation
The participants underwent a standardized neuropsychological battery called the Seoul Neuropsychological Screening Battery27, in which attention, language, visuospatial, memory, executive, and general cognitive functions were assessed. Standardized z-scores were computed for all relevant tests, employing age- and education-matched norms. The following tests were included in our analyses: digit span forward and backward for the attention domain; the Korean version of the Boston Naming Test for the language domain; the copying item of the Rey-Osterrieth Complex Figure Test for the visuospatial domain; immediate recall, 20 min delayed recall, and recognition items of the Rey-Osterrieth Complex Figure Test and Seoul Verbal Learning Test for the memory domain; and the semantic and phonemic Controlled Oral Word Association Test and Stroop color reading test for the executive domain. The scores in each cognitive domain were classified as abnormal when they were below 1.5 standard deviations (SD) from the norms. For each cognitive domain, a composite score was calculated by adding the z-scores and dividing the total score by the number of tests. Global cognitive z-score was calculated by dividing the sum of z-scores of all items by the total number of items. A diagnosis of PD with mild cognitive impairment by level I criteria (one test in language and visuospatial domain) was made in accordance with the Movement Disorder Society Task Force guideline28.
Statistical analyses
All statistical analyses were performed using SPSS 25 (IBM Corp., Armonk, NY, USA) and MATLAB R2021a. Mann-Whitney U test was used to compare the PSQI sub-scores between PD and HC groups. Partial correlation analyses for parametric variables (PSQI global score and all cognitive z-scores) and Spearman’s rank partial correlation analysis for non-parametric variables (PSQI component scores) were conducted to investigate the association of each subregional BF volume with sleep-related parameters and domain-specific cognitive function after controlling for age at MRI scan, sex, disease duration, total intracranial volume, and use of sleep-related medications. The false discovery rate correction was performed to correct multiple Spearman’s rank partial correlation analyses (7 PSQI component scores across 5 BF subregions) and multiple partial correlation analysis (PSQI global score and 5 cognitive z-scores across 5 BF subregions). General linear models were used to determine whether the cortical and subcortical regions of BF functional connectivity were significantly associated with sleep quality after controlling for the BF volume and the same covariates. Cortical regions of the BF functional connectivity that demonstrated significant correlations with PSQI global score and cognitive score were mapped. Voxel-wise false discovery rate correction was applied to cortical regions, whereas region-wise false discovery rate correction was applied to subcortical regions. False discovery rate-corrected p-value < 0.05 was considered significant.
Results
Demographics and clinical characteristics
We included 79 PD patients with PD (mean ± SD age 70.7 ± 8.0; 41 females) and 34 age- and sex-matched HC (mean ± SD age 68.4 ± 7.7; 20 females). In patients with PD, the mean age at the onset of motor symptoms was 68.9 years, and the mean disease duration was 1.8 years. The mean total MDS-UPDRS part III score was 24.9. The detailed clinical, imaging, and neuropsychological characteristics of the study participants are presented in Table 1.
Sleep disturbance and cognitive dysfunction
The mean of PSQI global scores tended to be lower in the healthy participants than in the PD patients (5.0 in HC and 6.1 in PD, Table 1), although the difference was not significant (p = 0.076). In the HC group, 32.4% were categorized as poor sleepers (PSQI global score > 5), while 46.8% of PD patients were poor sleepers (Fig. 1A). The most frequently reported complaints in the PD group were sleep disturbances (92.4%) and daytime dysfunction (81.0%), but their frequencies did not differ significantly from the HC group (Fig. 1B). The component in which a significant difference was found between the two groups was habitual sleep efficiency (p < 0.001). Additionally, 15.2% of the PD patients indicated having used sleeping medication in the past month, with 8.9% requiring medication three or more times per week. The sub-scores for which the largest percentage reported experiencing severe disability (score of 3) in PD were sleep latency (8.9%) and use of sleeping medication (8.9%). The prevalence of mild cognitive impairment was 27.9% at the time of diagnosis in PD patients. The mean of K-MMSE total score was 27.4 and 28.3 in PD and HC, respectively (Table 1).

A Histogram showing the distribution of PSQI global score among HC (red) and PD patients (blue). Poor sleepers with total PSQI > 5 are marked with darker colors. B Stacked bar chart showing the frequency of severity score in seven components in HC (red) and PD patients (blue). P-values indicate the results of Mann-Whitney U Tests.
Association of BF volume with sleep-related parameters and cognitive function scores
After false discovery rate correction, the PSQI global score was negatively correlated with Ch4ai and Ch4al volume in PD (Table 2, Fig. 2). None of the PSQI component scores correlated with any subregional BF volume. In terms of cognitive function, Ch4p volume was positively correlated with the visuospatial, memory, and executive domain z-scores after correcting for multiple comparisons (Table 2, Fig. 2). Attention and language domain z-scores did not correlate with Ch4p volume. Volumes of the other BF subregions were not correlated with any cognitive impairment. In HC, the volume of BF subregions did not correlate with the PSQI global score, component scores, and cognitive testing scores (Supplementary Table S1).
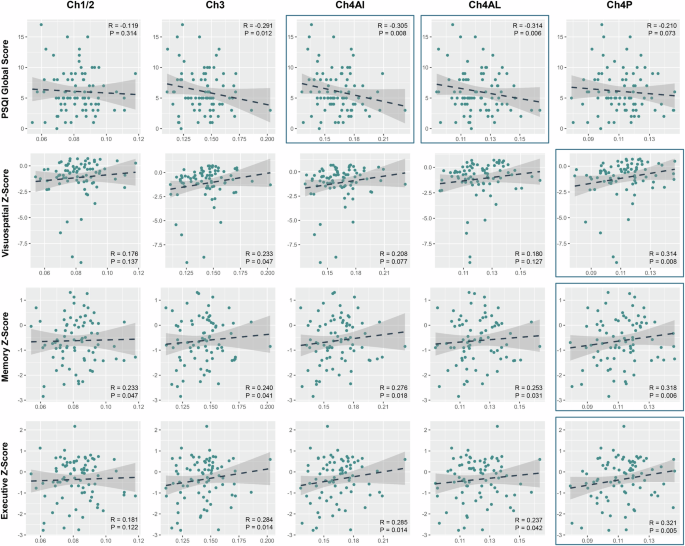
Data are the results of Spearman’s rank partial correlation analysis or partial correlation analysis of the volume of BF subregion with sleep-related parameters and cognitive scores after controlling for age at MRI scan, sex, disease duration, total intracranial volume, and the use of sleep-related medication. Items which had significant correlation with BF subregion after correction for multiple comparisons (false-discovery rate-corrected P < 0.05) are presented.
Association of PSQI global score with BF functional connectivity
The association between functional connectivity of each BF subregion with cortical and subcortical regions and the global PSQI score was investigated. PSQI global score was positively correlated with functional connectivity from Ch4al to the posterior cingulate, inferior parietal, anterior temporal, and medial orbitofrontal cortices (Fig. 3). Functional connectivity from Ch1/2, Ch3, Ch4ai, and Ch4p were not significantly associated with the PSQI global score after voxel-wise correction for multiple comparisons. In HC, no significant correlation of BF subregions with cortical and subcortical structures was found after correcting for multiple comparisons (Supplementary Fig. S3). However, there was no interaction effect of the group on the correlation between PSQI global score and BF functional connectivity (Supplementary Fig. S4).
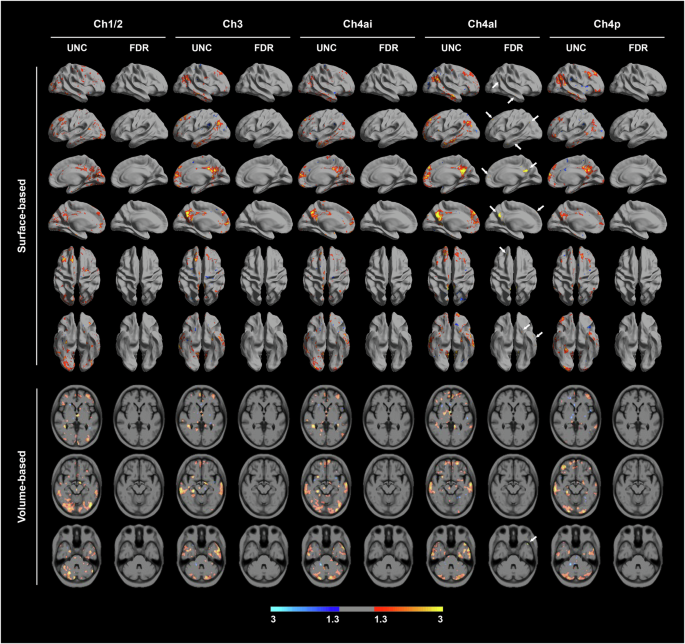
Data are the results of a general linear model for cortical regions of the functional connectivity from each BF seed using the PSQI global score as a predictor. Covariates included age at MRI scan, sex, disease duration, total intracranial volume, the use of sleep-related medication, and total BF volume. False-discovery rate (FDR) correction method was applied to correct for multiple comparisons. Red-to-yellow colors were used to show positive correlation between PSQI global score and BF functional connectivity, while blue colors represented negative correlations. Figures on the left side represent regions of significant functional connectivity from each seed without correction for multiple comparisons. Figures on the right side represent those after correction for multiple comparisons (FDR–corrected P < 0.05).
Association of cognitive score with BF functional connectivity
The association between the functional connectivity of the BF and cognitive testing scores was investigated. Neither domain-specific nor global cognitive scores were associated with functional connectivity from the BF subregions to brain regions in PD patients (Supplementary Fig. S5).
Discussion
In this study, we investigated whether the subregions of the BF are segregated in regulating sleep and cognition by analyzing the BF volume and functional connectivity in patients with PD. The major findings are as follows: (1) reduced volume of the anterior portion of the Ch4 was related to poor sleep quality, while reduced volume of the posterior portion of the Ch4 was related to cognitive dysfunction; (2) poor overall sleep quality was associated with increased functional connectivity from Ch4al to various brain regions including the inferior parietal lobule, posterior cingulate cortex, anterior temporal lobe, and medial prefrontal cortex, corresponding to the default mode network; and (3) cognitive dysfunction was not associated with Ch4p functional connectivity.
Based on the volumetric analysis of BF subregions using the cytoarchitectonic atlas of BF cholinergic nuclei, we discovered that volume reduction in the posterior portion of the Ch4 was associated with cognitive dysfunction, whereas volume reduction and altered functional connectivity in the anterior portion of the Ch4 were associated with poor sleep quality. The role of the BF cholinergic system in cognitive dysfunction in PD has been previously investigated. BF volume was associated with cognitive dysfunction, especially memory, visuospatial, and executive dysfunction29, and predicted cognitive decline30. However, these studies used total BF volume or divided it into the anterior portion including Ch1, 2, and 3, and the posterior portion including Ch4, the nucleus basalis of Meynert. The current study further subdivided Ch4, and intriguingly, we discovered that the subregions of the Ch4 cholinergic neurons were functionally segregated to regulate sleep and cognition. Past studies revealed that Ch4p was preferentially involved in PD31 as well as in Alzheimer’s disease25, and its atrophy predicted global cognitive decline30. Our results elucidated a novel function of the anterior portion of the Ch4 in sleep quality in PD.
The BF, especially Ch4, serves as the primary source of acetylcholine to the cerebral cortex, thereby playing an important role in regulating cortical activity and sleep/wake states. Furthermore, the BF projects to the hypothalamus, thalamus, and sleep-wake related structures in the midbrain-pons32. As Lewy pathology invades both the substantia nigra pars compacta and the BF at the same stage33, many patients with PD inevitably experience disturbed sleep-wake cycles and REM sleep physiology, leading to poor sleep quality and excessive daytime sleepiness at the time of diagnosis. Our results provided the first in vivo evidence that the overall sleep quality is significantly associated with dysfunction of the BF cholinergic system in PD. Among the Ch4 subregions, the anterior part projects to the amygdala, frontoparietal operculum, and medial cortical regions, including cingulate cortex34. The amygdala, anterior cingulate cortex, and medial prefrontal cortex are limbic structures involved in sleep regulation, especially during the REM period35. Therefore, we can infer that unlike the posterior part of the Ch4, which projects to the lateral posterior cortical area, degeneration of the anterior part of Ch4 is closely related to sleep disturbance in PD.
Functional connectivity analyses of the BF revealed that patients with poor sleep quality tended to demonstrate higher functional connectivity from the BF to brain regions of the default mode network (DMN): the inferior parietal lobule, medial prefrontal cortex, posterior cingulate cortex, and hippocampus. The DMN is activated during the resting state and attenuated during cognitive processing36. Conflicting evidence exists regarding changes in functional connectivity of the DMN in sleep disorders. Some studies have demonstrated decreased functional connectivity within subregions of the DMN in patients with disturbed sleep37,38, whereas others have reported increased functional connectivity of the DMN in patients with sleep disorders39, reflecting the heightened sensitivity and self-awareness of those with disturbed sleep39,40. Changes in the DMN functional connectivity in patients with PD have also displayed heterogeneous results, either increased41,42 or decreased43. Abnormalities of the DMN have been mainly studied for their association with cognitive dysfunction44. However, we demonstrated that aberrantly enhanced functional connectivity between the BF cholinergic system and DMN was also associated with disturbed sleep in PD.
The effect of the BF cholinergic system on the DMN is also debatable. A possible role of the BF as part of the DMN was suggested when the BF and DMN were discovered to exhibit the same pattern of local field gamma activity45. Another previous study demonstrated decreased coherence of spontaneous low-frequency blood oxygen level dependent fluctuations in the medial parietal cortex in Alzheimer’s disease where cholinergic innervation was compromised46. However, an animal study discovered that ipsilateral intra- and inter-hemispheric functional connectivity in the default mode-like network of rat brain was decreased when the BF was activated47. A meta-analysis also reported that nicotinic acetylcholine receptor agonist administration was associated with the suppression of DMN regions and enhanced activity in executive control network regions48. Although the exact mechanism remains unclear, we can infer from these studies that the cholinergic system may play a role in DMN regulation. Whether increased functional connectivity between the BF and DMN reflects a compensatory change following BF atrophy and impaired cholinergic innervation to the DMN, or a pathologic process that aims to suppress abnormally heightened DMN activity in PD patients with poor sleep quality, remains an open question. Future research on the BF cholinergic system is necessary to establish a link between sleep and the DMN.
This study had several limitations. First, the study was solely based on a questionnaire rather than on objective investigations, such as polysomnography or actinography. A discrepancy between objective sleep parameters measured using actinography and subjective report of sleep parameters using the PSQI in older adults has been reported49. However, self-reported total sleep time can precisely predict objective total sleep time50. Future studies should encompass objective sleep parameters in addition to questionnaires. Second, the total sleep time and overall sleep quality before the day of the examination were not considered. One night of sleep deprivation can cause robust changes in the resting functional connectivity51,52. Thus, the sleepiness of the patients in the scanner can be used as a covariate in future studies to reduce intrusion of sleep when analyzing functional connectivity. Third, the BF subregions are very small structures and are anatomically very close to each other. We cannot completely eliminate the effect of neighboring subregions when constructing functional connectivity maps. Fourth, functional MRI was acquired with high resolution to measure small BF in native resting-state functional MRI space. However, high resolution of image acquisition yields low signal-to-noise ratio and requires spatial smoothing due to high noise which may cause spatial resolution. Fifth, the increased functional connectivity from the Ch4al in PD needs to be interpreted with caution, as there was no difference in BF subregional functional connectivity between the PD and HC groups (Supplementary Fig. S6), and no interaction effect of the group was found in the correlation between BF functional connectivity and PSQI global score. Studies with larger sample size are required to conclude an aberrantly increased BF functional connectivity related to sleep quality in PD.
In summary, our findings demonstrated that reduced volume of the anterior portion of Ch4 and its aberrantly increased functional connectivity with the DMN were closely related to poor overall sleep quality, whereas reduced volume of the posterior portion of Ch4 was associated with cognitive dysfunction in drug-naïve PD patients. This study suggests functionally dissociated role of the BF cholinergic system in sleep and cognition in PD. Moreover, it offers an insight into how the cholinergic system contributes to the DMN and disruptions in sleep.

Responses