Super-resolved microstructure of pyrolyzing superlight ablators

Introduction
Interplanetary space probes entering celestial atmospheres at hypersonic speeds convert large amounts of kinetic energy into thermal energy behind a strong shock wave. For the fastest re-entry conditions, ablative thermal protection systems (TPS) are adopted as heat shields1,2,3. Ablators use thermo-chemical decomposition to manage aerothermal loads imposed by the entry environment.
Within the lighweight ablator class, superlight ablators (SLA) have been used in the backshell TPS of blunt bodies. SLA are syntactic foams with low density (<0.3 g ⋅ cm−3), low thermal conductivity (<0.5 W ⋅ m−1 ⋅ K−1), and heat capacity comparable to that of fiber-reinforced carbon-phenolic ablators used as forebody heat shields4. The two designations investigated in this study are SLA-220 and SLA-561V. The SLA-561V is made of elastomeric silicone, phenolic and silica microballoons, with structurally supportive glass and carbon fibers. It was adopted as heat shield material for the forebody aeroshell of Mars Exploration Rovers, a solution based on Viking Lander and Mars Pathfinder designs, where peak forebody heat fluxes were on the order of 115 W/cm2. SLA-561V was also selected as the forebody heat shield material for the Mars Science Laboratory to operate at heat fluxes up to 225 W/cm2 2. However, rapid failure observed during arc-jet experiments led NASA to replace it with the Phenolic-Impregnated Carbon Ablator (PICA) for the forebody heat shield design, while maintaining it as backshell material. The SLA-220 is composed of silica microballoons and fibers, held together by a silicone elastomer. Due to its low carbon content, it forms a siliceous char, that maintains RF-transparency during operation4,5. It is therefore a desirable heat shield material solution for communication devices and antennas. As these SLA materials have been selected as backshell TPS for the Dragonfly entry probe, a future mission to Saturn’s moon Titan, the microstructural behavior necessitates further characterization under relevant heating environments.
Improved aeroshell heating predictions critically rely on resolving multi-scale ablation phenomena. For example, future exploitation of CN radiation data, planned for Dragonfly entry, will dramatically benefit from models of ablators’ effective properties that capture changes in material microstructure during pyrolysis6. This calls for non-destructive evaluation techniques such as high-resolution X-ray computed tomography (μ-CT), where 3D microstructures of TPS can be studied at near-micron scale7,8,9,10,11,12,13,14,15,16. Furthermore, in situ experiments performed with μ-CT at synchrotron facilities have matured into invaluable tools for evaluating a variety of materials under simulated environmental conditions, from TPS17, to battery electrodes18,19,20,21, biomass22,23,24 and extreme environmental applications25,26.
This study focused on resolving the effects of high temperature pyrolysis (chemical degradation in an inert atmosphere) on the microstructure of SLA. The approach developed by Dahari et al.27 was extended to resolve large representative volumes of the material microstructure, that are captured during the decomposition process. While performing in situ μ-CT, a trade-off must be made between field of view (FOV) and resolution. Capturing a sample large enough to be representative of the microstructure is key for a quantitative analysis of the material properties. When rapid decomposition is investigated, such as during high-temperature pyrolysis, time-resolved scans lack the resolution to fully resolve all the phases necessary to perform a detailed analysis of the decomposition behavior. Here, we leveraged advances in generative adversarial networks (GAN), that can be trained on high-resolution tomography slices (where all phases are fully captured), to denoise and segment the appropriate phases from the poorly resolved in situ datasets.
GANs operate with a generator model to artificially create image datasets that are scrutinized against the given training dataset by a discriminator. This process iterates until the discriminator is no longer able to distinguish between the artificial and real set, the generator thereby successfully learning to create accurate synthetic images28. GANs have seen use for generating artificial geometries29, denoising and segmentation30,31, have found many uses in the medical and battery imaging communities27,32,33. As we will see (vide infra, Results section), high pixel resolution was also critical to distinguish the numerous low-contrast phases in materials such as SLA.
In this study, GANs were trained to assist in denoising and segmenting previously unresolved phases in a lower-resolution/higher-field of view μ-CT to ultimately be used to connect the morphological evolution of SLA to its pyrolysis. Phase-relevant volumetric swelling, shrinking, porous network development, and tortuosity were quantified based on the super-resolved data.
Results
Material degradation
Scanning electron micrographs shown in Fig. 1 provided a qualitative insight into the evolution of the SLA microstructure. Sparsely distributed fibers are visible amongst silica microballoons in the SLA-220 (Fig. 1a) at both room temperature and after decomposition to 900 °C. The SLA-561V (Fig. 1b) is characterized by large void vacancies left by pyrolysis of the cork phase. Similar to the SLA-220, silica fibers and microballoons remain visible after pyrolysis in SLA-561V.

a SLA-220 and b SLA-561V at room temperature (23 °C) and 900 °C.
Shown in Fig. 2 are cross-sections from μ-CT scans of both the SLA-220 and the SLA-561V materials in their virgin state at room temperature and charred state at 900 °C (Fig. 2a). Their respective TGA decomposition curves are shown in Fig. 2b. The different microstructure and chemical composition of the two materials rendered a remarkably distinct degradation behavior. While SLA-220 contains one pyrolyzing phase, its silicone elastomer matrix, the SLA-561V features three pyrolyzing phases: the phenolic microballoons, the cork filler and the silicone matrix. In both materials silica microballoons and fibers remained below their melting point5,34, although observed deformations suggest that strain or softening conditions were achieved for the microballoons.
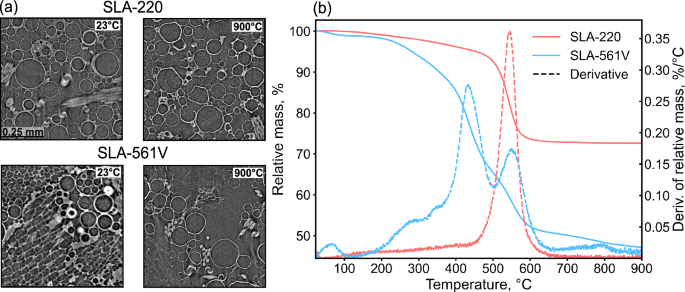
a μ-CT slice cross-sections of SLA-220 and SLA-561V at room temperature (23 °C) and 900 °C. b Thermogravimetric analysis curves of SLA materials at 15 °C/min, overlaid with their respective derivative showing the salient decompositions phases.
Starting with SLA-220, a slow degradation (<5% mass loss) was observed from room temperature to 450 °C, accompanied by no appreciable microstructural change (vide infra, volume fraction results). These early decomposition stages begin with the scission of siloxane bonds and release of light volatiles. Most of the decomposition occurred during pyrolysis of the silicone matrix between 450 and 650 °C, with peak production at 550 °C, consistent with degradation studies of other silicone-based materials35. Carbon monoxide (CO), dioxide (CO2), and hydrocarbons were produced5, contributing to increase internal material pressure, along with continued release of cyclic siloxanes34. Inward deformation of the silica microballoons’ walls was observed in the tomographies collected during this decomposition stage, which was attributed to the concurrent effect of gas pressure generation from the elastomer decomposition and softening of the thin microballoons’ walls. A char yield of 70% was measured for the SLA-220.
SLA-561V featured an early decomposition below 200 °C, attributed to the cork filler and the phenolic microballoons. Indeed, this step was observed during pyrolysis studies of both phenolic-impregnated materials36,37 and cork38, and attributed to outgassing of absorbed H2O.
Cork contributes to 29% of the SLA-561V mass. Its alveolar structure with rectangular cells was clearly resolved in the tomography cross sections Fig. 2a39. Cork is primarily comprised of 40–50% suberin, 15–30% lignin, and 20–30% cellulose and hemicellulose by weight, that contributed to the mass loss observed in SLA between 300 and 500 °C40,41,42. The largest SLA-561V decomposition peak at 430 °C in Fig. 2b is the same found in the TGA of Amorim cork P50 thermal protection material38. CO2, CO, and CH4 along with organic functional groups are the main products. The cellular structure of cork was observed to deform and nearly disappear into a low solid volume fraction char for the pyrolyzed SLA-561V.
Phenolic microballoons contribute to only 6% of the SLA-561V mass and follow the well-known high-temperature decomposition mechanisms of phenolic resin, widely studied in the TPS literature36,43. The peak at 350 °C in the TGA derivative of Fig. 2b was reported for the conformal PICA44. Bessire and Minton36,43 attributed the late decomposition at temperatures above 700 °C to production of H2 during PICA decomposition, which was also observed for SLA-561V. The slight reduction in microballoon count qualitatively observed in the tomography of decomposed SLA-561V was likely due to the charring of the phenolic microballoons.
Compared to SLA-220, SLA-561V has a similar mass percent of silicone elastomer and silica fibers. The large decomposition stage of the silicone in the 450–650 °C, with the peak production at 550 °C, observed for SLA-220, was also seen in the 561 V. The different char yield measured for SLA-561V (50%) compared to SLA-220 (75%) is due to the two additional charring phases (cork and phenolic microballoons).
Super-resolution
The performance of the SuperRes GAN method, applied to in situ tomography datasets, was assessed by comparing quantified volume fractions and surface area of each sample’s constituent phases for the two materials systems (details of implementation are provided in the Methods section). The results are summarized in Fig. 3. Lo-res, Hi-res and Super-res, refer to sample of the in situ data, the high resolution data used in the GAN training and the output results of the GAN inference on the low-resolution data, respectively. For each of the volume fractions of both the SLA-220 (Fig. 3a) and SLA-561V (Fig. 3c), the super-resolved tomographies draw nearer to the value of the high-resolution set. Super-resolved data capture phases such as cork fillers and fibers, which are missed in the low-resolution scans. The void volume fraction represents the total porosity in each set. Error bars were generated from sampling four different locations of the samples, as described in the “Methods” section.

Comparison of volume fraction (left) and surface area (right), between the low, high, and super-resolution samples for a, b SLA-220 and c, d SLA-561V. Volume fraction is shown for the different phases of each material, and surface area represents the fraction of the number of neighboring voxels of different phases by the total number of faces present in the volume.
From the ~92% bulk volume of silica microballoons (Table 1) specified for the SLA-220 composition, a void volume fraction (total porosity) of ~80% is estimated. This value is consistent with that found from our analysis in Fig. 3. For SLA-561V, the two microballoon phases (silica and phenolic) are ~58% in bulk volume fraction, and the cork is ~36% (Table 2). The unfilled hexagonal wall structure of cork contributes to ~75–80% of the total porosity. A variation of up to 9% was found in the volume fraction of fibers in the subsampled sections of both SLA-220 and SLA-561V.
For both materials, results for the surface area (Fig. 3b, d) showed a notable improvement in the contact area between the void and the matrix phases for the Super-res samples. Remarkably, for SLA-561V the cork phase was resolved by the GANs, accounting for up to 36% of the virgin bulk volume of the material45. It is noted that these improvements in volume fraction and surface area quantification were critical to correctly assign constituent material properties to a multiphase system in effective property simulations16 and understanding key steps in the pyrolysis decomposition processes, such as closed porosity being converted into open porosity and providing pathways for gas permeability through the TPS.
To further evaluate the improvements enabled by the GANs, the root mean squared error (RMSE) was calculated between the Lo-res and the Super-res volumes of the virgin and fully pyrolyzed materials. The RMSE quantifies the pixel-wise differences between the Lo-res and Super-res volume fractions of each phase, normalized by the total pixel count to allow comparisons across the datasets, representing represents the proportion of mismatched pixels relative to the total volume. This is written as Eq. (1):
where Ai and Bi are the i-th voxel in the segmented phases from the Super-res dataset and the Lo-res dataset, respectively, and N is the total number of voxels.
For both SLA-220 (Fig. 4a) and SLA-561V (Fig. 4b), RMSE values ranging between ~0.45 and ~0.55 for the void and the matrix phases reveal notable texture difference between Lo-res and Super-res datasets. These RMSE values, together with the observations from Fig. 3a, indicate that while Lo-res data provide a satisfactory volume fraction quantification, they fail at correctly capturing the distribution of constituting phases throughout the volume. In turn, Super-res data enable an accurate quantification of volume fraction at its spatial distribution. This is evident both from the surface area results (Fig. 3b) and the stark quality improvement in segmentation, as shown in the comparison between Lo-res and Super-res slices in Fig. 4c–f.
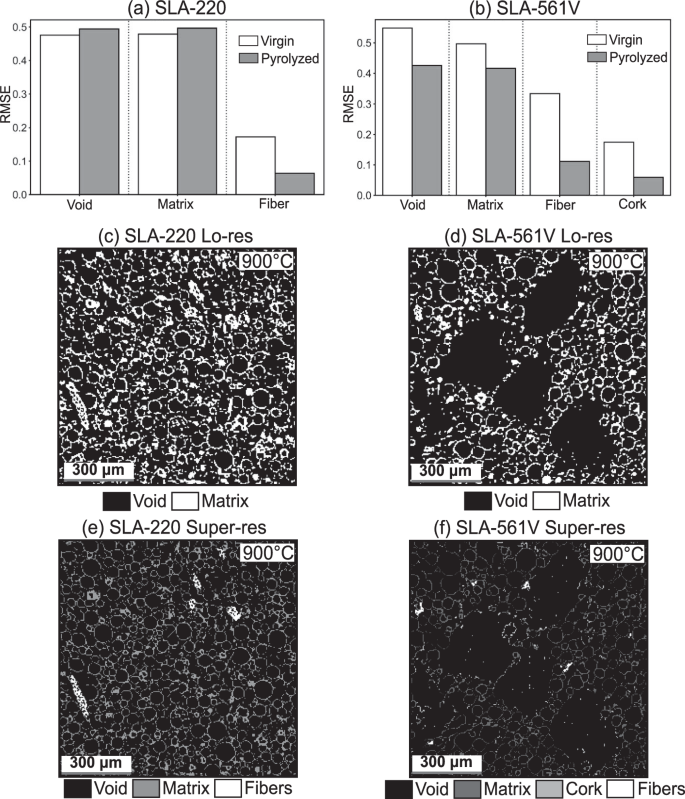
Root mean squared error for a SLA-220 and b SLA-561V across different phases. c, d Segmented Lo-res and e, f Super-res slices for SLA-220 and SLA-561V respectively.
The additional phases (fibers and cork) have lower RSME, because their respective volume fractions are smaller compared to those of void and matrix. These phases were only identified in the Super-res dataset, and missed in the Lo-res data. A decrease in RMSE is observed upon pyrolysis, indicative of material degradation.
Overall the analysis shows that the GAN workflow was particularly useful at resolving early degradation phases (<400 °C), as it identified the previously unlabeled phases that exist in larger volume fractions. Additionally, the consistent differences in the void and matrix RMSEs for both materials show that neighboring borders and edges were significantly improved in the Super-res dataset.
Evolution of constituents’ volume fraction
Represented in Fig. 5 are the changes in solid volume fraction during decomposition, that can be related to the mass loss in Fig. 2b. Note the differences between the virgin solid volume fractions quantified from μ-CT and the percent bulk volume values presented in the “Methods” section Table 2 and Table 1 (ref. 45), for the two material. Indeed, the tabulated quantities represent the bulk volume occupied by the material phase and the porosity it encloses. Here, the volume fraction is referred to the sole solid material, its enclosed porosity segmented.

Tracking of solid phases volume fractions and porosity of a SLA-220 and b SLA-561V as a function of temperature.
For SLA-220 (Fig. 5a) the key changes were observed occurring near the peak pyrolysis temperature at 500–550 °C visually seen in Fig. 6b. In the matrix phase, the reduction in solid volume fraction is attributed to the silicone elastomer pyrolyzing that is covering the silica microballoons and silica fibers. The slight increase in solid volume fraction of the matrix phase (and corresponding decrease in the porosity) near the end of pyrolysis is due to additional silica microballoons entering the evaluated FOV with the loss of the elastomer matrix.

Evolution of phases during key decomposition temperature intervals for a–c SLA-220 and d–f SLA-561V from super-resolved tomography slices.
The solid volume fraction of the SLA-561V phases is seen to respond according to their pyrolysis behavior in Fig. 5b. Significant mass loss began sooner for the SLA-561V at 250 °C due to phenolic resin microballoons and cork in its composition. This early transition is seen in some part in the matrix phase (including both silicone elastomer and phenolic microballoons), and very noticeably in the disappearance of the cork phase. Early phenolic resin pyrolysis is due to incomplete cure reactions and the formation and release of water-vapor and phenol pendant groups43 up to 400 °C. During the same period, suberin, lignin, and cellulose comprising the cork all experience significant mass loss up to 400–500 °C, with continued solid volume fraction reduction of beyond 900 °C40 leaving large voids leftover in Fig. 6e. Similar to the SLA-220, it is believed that some of the silicone elastomer was covering the silica fibers reflecting the change in solid volume fraction from 3% to 1%, in addition to the fibers shifting out of the FOV.
Effective material properties
Tracking and quantifying volumetric shrinking and swelling is critical to understand the mechanical integrity of a TPS material17,35,46 and correctly model thermal degradation processes. Both materials’ change in envelope volume was tracked through pyrolysis in Fig. 7a. SLA-220 remained relatively steady up to 500 °C, where the release of siloxanes from the silicone elastomer and molecules such as CO and CH4 were shed from depolymerization34. For the SLA-220, the change in the overall bulk density remains at 85% compared to its virgin state, a nearly proportional reduction in mass and envelope volume. In contrast, SLA-561V experienced a 74% change in bulk density because of its envelope volume change concluding pyrolysis up to 900 °C. The downward swing in envelope volume is attributed to the near complete elimination of the cork phase that caused the bulk of the material to shrink steadily throughout pyrolysis.
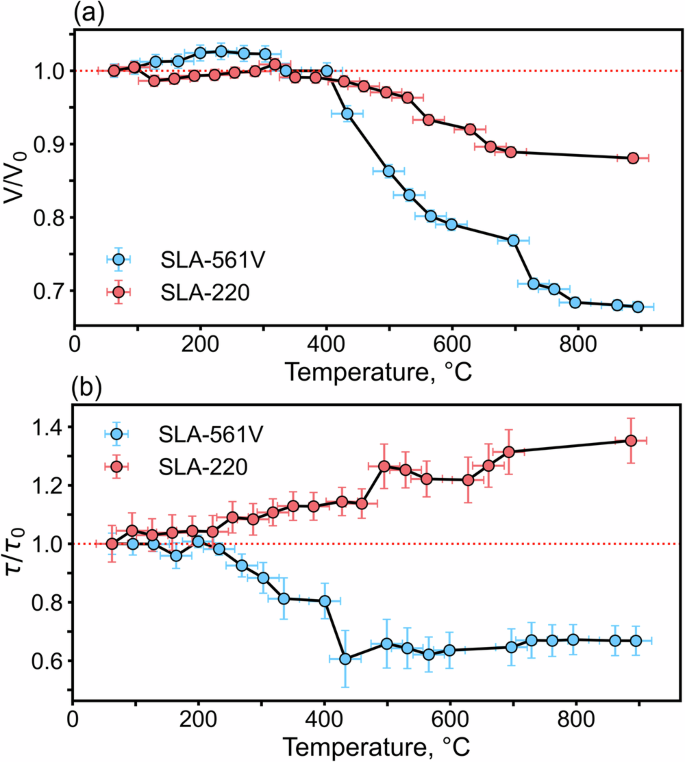
a Change in envelope volume, and b tortuosity factors of the SLA materials as a function of temperature.
Shown in Fig. 7b are the computed tortuosity factors as they evolve with pyrolysis (diffusion through the void phase). The SLA-220 tortuosity shows an increasing trend, indicative of the microstructure becoming increasingly resistant to diffusion. This is attributed to the pyrolysis of the silicone elastomer which fills the gaps between silica microballoons and fibers in the virgin materials. When this smooth pore-filling matrix was pyrolyzed, the silica architecture (fibers and microballoons) was exposed and the SLA-220 became a more tortuous network (also observed qualitatively in Fig. 2).
A similar matrix volatilization process occurs in the SLA-561V, although the pyrolysis of the highly voluminous cork phase and up to 45% by mass of the phenolic microballoons opened shorter (and larger) paths for gas diffusion compared to SLA-220, contributing to an overall decrease in tortuosity compared to the virgin material. Indeed, large void regions can be seen in both Fig. 2 and the 3-D rendering of the SLA-561V in Fig. 9c.
Note that the quantified trends in tortuosity provide insight on the evolution of other key effective properties such as thermal conductivity and gas permeability, that are highly relevant when assessing material performance and developing models for the high temperature response of SLA.
Finally, the porosities of the two materials are quantified in Fig. 8. First, the segmented tomographies (Fig. 8a) had their pores isolated and quantified shown in Fig. 8b (Scipy47). The closed porosity here represents the porosity that was contained inside the silica and phenolic (SLA-561V) microballoons.
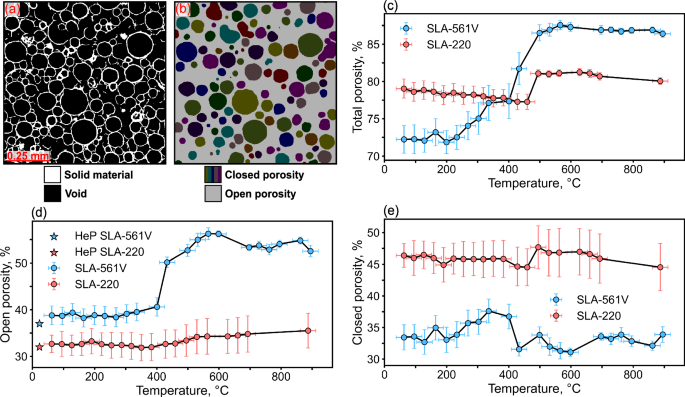
a SLA-220 segmented between solid material and void. b Enclosed microballoons representing closed porosities. c Total (open + closed) porosity, d open porosity, and e closed porosity as a function of temperature.
In the SLA-561V, much of the 15% increase to total porosity (Fig. 8c) was driven by the increase in the open porosity (Fig. 8d) due to the volatilization of the cork phase and opening of phenolic microballoons (25% total solid volume fraction). The total porosity of the virgin SLA-220 was 7% higher than that of the SLA-561V, with a 5% difference in open porosity. The results of the HeP on the virgin materials is shown to be within 1–2% of the μ-CT measurements for both samples. Note that the primary difference in total porosity between the two SLA grades was observed in the closed porosity (Fig. 8e). That open cellular network of the cork in the SLA-561V was counted in the closed porosity measurement, which instead generated from the microballoons phases that constituted 13% of the solid volume fraction. This amounted in the SLA-561V’s initial closed porosity to be 33% compared to the SLA-220’s 46% (16% microballoons solid volume fraction).
After pyrolysis to 900 °C, the closed porosity in the SLA-220 was seen to remain within 1–2% of its initial value as more microballoons entered the FOV with the loss of the elastomer matrix, and few of the silica microballoons breaking at these temperatures. Notably, because of the decomposition of the cork phase, the fully charred porosity of SLA-561V is nearly 10% larger than that of SLA220.
Discussion
In this study, GANs were deployed to denoise and segment two distinct multiphase syntactic foams used in thermal protection, and quantify their morphological behavior as they were pyrolyzed in situ. Time-resolved micro-computed tomographies were collected on both SLA-220 and SLA-561V during thermal decomposition up to 900 °C. High-resolution scans of virgin and fully charred materials were collected in order to train GANs and extract the relevant phases from low-resolution in situ scans. The segmented super-resolved datasets were then used to perform a suite of microscale characterizations of material degradation.
TGA and prior knowledge of chemical composition were leveraged to relate pyrolysis gas release to the morphological evolution. The solid volume fractions of each of the representative phases were tracked and related to the relevant decomposition chemistry. The envelope volume change, as well as effective properties were also quantified.
The implementation of GANs was shown to be indispensable for 1. increasing the overall resolution of otherwise unusable μ-CT scans, 2. segmenting multiphase material systems of similar densities, and 3. scalability for in situ application. This was evidenced when comparing the solid volume fraction and surface areas computed from the original low-resolution (in situ), the high-resolution (used for training), and the super-resolution (low-resolution improved with GANs) scan. The super-resolved samples were brought overall closer to that of the high-resolution scans with particular emphasis on the surface areas of phase interfaces.
Our super-resolved data revealed a distinct thermal degradation behavior for the two SLA formulations investigated, that is tightly connected to the characteristics of the microstructure and constituting phases of the material. The primary mode of mass and solid volume loss for the SLA-220 was through the depolymerization and volatilization of siloxanes released from the silicone elastomer phase. This was most prominent in the 500–600 °C temperature range. Because of the presence of phenolic microballoons and, primarily, a cork filler accounting for about 30% of the material mass, the SLA-561V saw more consistent mass loss throughout, with early decomposition in the 200–350 °C temperature range and two main degradation phases in the 400–500 °C range, attributed to cork, and in the 450–650 °C ranges, attributed to silicone. With the additional pyrolyzing phases, SLA-561V exhibited overall greater mass loss and a larger increase in overall void volume fraction as a result.
Material properties evaluated from super-resolved scans also showed a remarkably distinct behavior. While the SLA-220 exhibited no swelling and a 12% volume shrinkage at 900 °C, the SLA-561V was found to swell (5% volume increase) during the early stages of decomposition and showed a large 32% shrinkage in volume from 450 to 900 °C. Compared to SLA-220, SLA-561V showed a dramatic increase in open porosity, attributed to the volatilization of the cork phase. The different degradation behavior also resulted in opposite trends of tortuosity evolution with temperature, with SLA-220 tortuosity factors increasing during decomposition, while SLA-561V tortuosity decreasing due to the generation of open material porosity.
We conclude that chemical composition of constituents, mass and volume fraction, and distribution of pyrolyzing phases in the microstructure of syntactic foams subjected to high temperature are key to determine their degradation response, evolution of porosity and, in-turn, their effective properties. Compositions containing decomposing fillers such as cork develop open porosities and microstructure that favor transport of gases. The super-resolution GAN workflow combined with in situ μ-CT provided unique insight in the thermal degradation process of superlight ablators. We anticipate the data presented in this work to enable development of high-fidelity ablation response models for SLA, that track the evolution of effective properties during ablation.
Methods
SLA materials
The nominal composition of the SLA-561V and SLA-220 are included in Table 2 and Table 1, respectively45. The samples were cut from bulk blocks of material to 5 × 5 × 4 mm rectangular prisms to fit within the μ-CT FOV. Both blocks were provided directly from the manufacturer (Lockheed Martin Corporation, USA).
SEM and HeP
Post-test scanning electron microscopy (SEM) was performed using a FEI Quanta FEG 450 ESEM (FELMI ZFE, Graz, Austria). All sample images were acquired at 0.12 Torr (low-vacuum water mode), 20 kV, room temperature, with magnification ranging from 200 to 300×. The open porosity of the materials was characterized using helium pycnometry (HeP) by measuring the materials’ solid volume with an AccuPyc II Gas Displacement Pycnometry System (Micromeritics Instruments Corporation, Norcross, Georgia, USA).
Environmental chamber and TGA
The in situ μ-CT experiments were conducted at the beamline 8.3.2, part of the Advanced Light Source synchrotron facility at Lawrence Berkeley National Laboratory (California, USA). The environmental chamber used in these pyrolysis experiments was the same and was operated as described in17. A leak-tight chamber was constantly filled with inert Argon gas that was continuously vented out, along with any pyrolysis products generated from the sample. Six confocal infrared lamps were used to heat up samples at temperatures up to 1100 °C, sufficient to fully char pyrolyzing ablators.
Concurrent temperature measurements of the sample were acquired using a 30 AWG type-K thermocouple resting underneath the sample (as to not cause artifacts in the radiographs). Through constant incremental metering of the two power supplies (two 20A/24V units, Acopian, Pennsylvania, USA) to the infrared heating system (L6409-G, International Light Technologies, Massachusetts, USA), a heating rate of 15 °C/min was achieved up to 900 °C.
Independent measurements of the degradation of both SLA materials were performed via thermogravimetric analysis (TGA), using a Q50-TGA (TA Instruments, New Castle, Delaware, USA) instrument. Measurements were carried out in inert atmosphere (N2) up to 900 °C, using the sample heating rate adopted during in situ μ-CT (15 °C/min).
X-ray micro-computed tomography
The environmental chamber was mounted on the 0°–180° rotation stage of the ALS Beamline 8.3.2 μ-CT setup and placed in-line with the X-ray beam generated by the synchrotron source. For the in situ experiments the beam was operated in white light mode (no dispersion from the monochromator) centered at 30 keV, such that tomographies could be taken in rapid succession at 2 scans/min. The X-ray flux attenuated by the sample was converted to visible light by means of a 0.5 mm LuAG scintillator (Crytur, Turnov, Czech Republic) and collected by a 2560 × 2160 pixels pco.edge 5.5 sCMOS camera (PCO, Kelheim, Germany). In the interest of capturing the entire volume of the sample within the FOV, the in situ tests were captured with a 2 × lens (Mitutoyo, Kawasaki Japan), providing 3.24 μm/pixel resolution. The exposure time was set to 20 ms per frame and a total of 1313 radiographs were acquired over the 180° rotation, along with 100 bright fields. The sample to scintillator distance was kept at 140 mm to reduce phase-contrast and heighten resolution.
To collect tomographic scans needed for the GAN super-resolution task, the monochromator was incorporated at 21 keV in order to increase the contrast between the constituent phases of the sample. A 10 × lens (Mitutoyo, Kawasaki, Japan) was used providing a pixel size of 0.65 μm/pixel resolution. The sample was mounted without the environmental chamber enclosure such that the detector could be positioned closer to the stage (≈38 mm distance) and resolution enhanced. An exposure time of 450 ms for 1313 images with 100 bright fields were used in acquiring these high-resolution scans. Both virgin and charred (post-test) states of the samples were collected to the train the GAN.
Data processing
The collected scans were 9 and 15 GB for each of the in situ and high-resolution datasets before reconstruction, respectively. All tomographies were binned by 2 resulting in a final pixel size of 6.48 and 1.3 μm/pixel for the in situ and the high-resolution samples, respectively. The radiographs were reconstructed using filtered back projection implemented in the ASTRA toolbox48 integrated in Tomopy49. The reconstructions were converted from 32-bit to 8-bit, visualized in FIJI50 and rendered in 3-D using Dragonfly (http://www.theobjects.com/dragonfly). The sample stand was cropped from each dataset to isolate the SLA material. First the low-resolution grayscale datasets collected in situ were thresholded51 to isolate the solid material from the air background. Then the binarized solid mask was dilated with a 3-D kernel size of 5 and underwent a morphological hole filling operation (Scipy47) to create a filled mask to accurately calculate the volumetric change of the material.
GAN implementation
We deployed GANs by using the high-resolution, low-FOV tomographies as training images to denoise low-resolution, large-FOV in situ scans31. This process is summarized in Fig. 9, adapted from and utilizing the SuperRes software developed by Dahari et al.27. First, a single slice of the high-resolution (10 × lens) scan was manually labeled to identify the phases of the material (Fig. 9b). The SLA-220 was segmented into 3-classes: fibers (silica fibers), matrix (silicone elastomer and silica microballoons), and void regions. The SLA-561V was segmented into 4-classes: fibers (silica fibers), matrix (silicone elastomer, silica and phenolic microballoons), cork, and void regions. For both materials, the elastomer and microballoon phases were not distinguishable in the μ-CT because of their visibly unclear physical boundaries and similar attenuation values (similar densities).

a High-resolution/low field of view being used as training data for GAN network to super-resolve (denoise and segment) low-resolution/high field of view sub-volume. b Segmented high and low-resolution slice, with resultant super-resolved slice. c Super-resolution procedure applied to entire low-resolution tomographies. The figure is inspired by Dahari et al.27.
Next, a 128 × 128 × 128 pixel cube was extracted from the low-resolution in situ datasets, thresholded51 and small objects were removed if under 2 pixels in size52. Together with the previously hand-labeled high-resolution slice, this set acted as the training dataset for the GAN model. Following the work of Dahari et al.27, the model was trained with a scale factor of 4, and rendered capable of artificially increasing the resolution and segmenting the low-resolution in situ tomographies.
In total four distinct GAN models were trained following this process, one for each material (SLA-220 and SLA-561V) and temperature range (virgin to mid-pyrolysis and mid-pyrolysis to fully charred) combination. For each material, the low temperature range (virgin to mid-pyrolysis) GAN was trained using slices from high-resolution scan of the virgin sample and applied to denoise and segment in situ low-resolution tomographies collected from room temperature to 450 °C. The high temperature range (mid-pyrolysis to fully-charred) GAN was instead trained using slices from the high-resolution scans of the fully charred sample and applied to in situ scans collected from 450 °C to 900 °C. Renderings of super-resolved samples of the virgin and charred SLA-220 and SLA-561V are shown in Fig. 9c.
Segmentation and analysis were repeated on four 128 × 128 × 128 pixel subsets of each low-resolution in situ tomography, and quantitative properties were computed. Error bars shown in Figs. 5, 7, and 8 represent the calculated variability of morphological and effective properties and are inclusive of possible segmentation errors. While limited, imperfect GAN segmentation can be noticed in Fig. 9b, where the segmented fiber have slight overalp with the matrix phase.
The super-resolved samples were evaluated for solid volume fraction, pore morphology and statistics (Scikit-Image52), as well as effective properties such as tortuosity (TauFactor 253). GPU-enabled computations were performed on systems with up to 7 Nvidia(R) A100 GPUs (41 GB RAM), AMD EPYC 64-core processors, and 2 TB available RAM.


Responses