Superior performance of 18Mn3Cr0.5Mo1V ferrous alloy for strength, ductility, and prolonged corrosion resistance in seawater

Introduction
The sustainability of infrastructures, offshore equipment, and other commonplace structures depends on materials with superior load-bearing capacity and environmental stability1,2,3. A number of advanced commercial alloys, such as stainless steel, titanium alloys, aluminum alloys, and carbon fiber-reinforced composite (CFRP) materials, are available these days, and they are considered candidates for engineering materials based on their superior mechanical properties4,5,6,7,8. Nevertheless, their wider applications are restricted because most alloys follow a mutually exclusive relationship between strength and ductility9,10,11. Moreover, there are limitations in implementing multi-functional performances12,13. From these perspectives, high Mn-bearing ferrous alloys with a face-centered cubic (FCC) structure at ambient temperature, without showing a mutually exclusive relationship, have attracted considerable attention based on the more desirable combination of high-strength, hardness, and ductility in terms of industrial applicability14,15,16.
Despite their superior mechanical properties, their vulnerability to corrosion and the problem of surface degradations have restricted their wider applications17. In the Fe-Mn binary alloy system, the rapid anodic dissolution of Mn with a much lower electrochemical potential (i.e., standard reduction potential of −1.19 VSHE)18,19, from the surface is expected from the Pourbaix diagram of Mn. Moreover, Jeong et al.20 reported that (Fe,Mn)-based scale formed on the surface with an advance state of corrosion was not protective (i.e., porosity showing poor adhesion with the underlying matrix). For these reasons, the development of 24Mn3Cr-based ferrous alloy was proposed to enhance static corrosion, dynamic flowing corrosion, and erosion-corrosion by the formation of a bi-layer scale structure consisting of inner α-Fe2−xCrxO3 and outer FexMn3−xO4 on the surface. Nevertheless, the need to develop structural materials implementing superior and diverse functions has continued with the advances in various industries. The alloys with higher Cr and other alloying elements, such as stainless steel, have been a representative corrosion-resistant alloy (CRA) and have been used for more than 100 years. Nevertheless, stainless steels are vulnerable to localized corrosion, such as pitting and crevice corrosion, particularly when exposed to marine environments with Cl ions21. Furthermore, their strengths are comparatively low (<500 MPa)22, and there is a limit to their applications to large-scale infrastructure from an economic perspective. It is therefore critical to further optimize the alloy type and content to achieve the mechanical properties, corrosion resistance, and even economic efficiency at the same time for alloys used in a variety of infrastructures. In this alloy optimization aspect, the present author proposed an 18Mn-bearing ferrous alloy with enhanced seawater corrosion resistance through the synergistic interaction of micro-alloying (Cr, V, and Mo) with trace quantities. Under the uncertainty as to the precise role of alloying elements and their synergistic interactions on the corrosion behavior in seawater environments, the anti-corrosion mechanism should be explored to interpret it precisely.
In this work, we show that the mechanical performance and corrosion resistance can be greatly enhanced by the optimal design of a multi-component ferrous alloy (Fe-18Mn-3Cr-1V-0.5Mo). In particular, the remarkable improvement in the corrosion resistance is based on the further increase in the Cr-enriched level in the inner scale, ensuring an inhibiting nature, which could be achieved by the following effects. (1) The formation of V-carbide, effective to increase the hardness and wear-resistance, avoiding Cr-carbides to have more Cr available in solid solution for enrichment in the oxide scale. (2) The alloying of Mo, even in trace quantities, promotes the conversion of metastable Cr-containing oxides into more stable and corrosion-resistant trivalent oxide products, such as Fe2CrO4 and Cr2O3, improving further the compactness of the inner layer of corrosion scale with cation selective characteristics.
Results
Microstructure and mechanical performance
As listed in Supplementary Table 1, four types of 18Mn-bearing ferrous alloys were prepared to examine the individual alloying effect of 3Cr, 1V, and 0.5Mo. One sample (target material) containing all three components (Cr, V, and Mo) and three samples without any one of the three components are referred simply to as CrVMo, CrV, CrMo, and VMo, respectively. Two types of commercial structural steels were also used as reference samples to compare the corrosion resistance: carbon steel used for marine applications and anti-corrosive ferritic stainless steel called CS and FSS, respectively.
In contrast to the selected reference samples, the four types of 18Mn-bearing samples consisted of a fully austenite phase with a FCC structure and little preferred orientation. There was no significant difference in the microstructure among the samples except for the grain size, which varied primarily due to V additions and, to a lesser extent, partial Cr incorporation (see Fig. 1 and Supplementary Fig. 1). At higher magnification, it was also noted that there was a difference in the types of precipitates between the samples with and without V. The V-bearing samples (CrVMo, CrV, and VMo) had fine precipitates of V4C3 with several to tens of nanometers in size, distributed along the grain boundary and in the alloy matrix (Fig. 1b and Supplementary Fig. 2). Meanwhile, energy dispersive X-ray spectroscopy (EDS) mapping of other precipitates revealed the co-presence of V, Cr, and C, suggesting a partial incorporation Cr into the carbides (Fig. 1c). Owing to these fine precipitates distributed throughout the matrix, the samples had a finer grain size and higher Vickers hardness values (Fig. 2a) than those of the 18Mn-bearing samples without V, two reference samples, 9Ni steel, and 24Mn-based steels.

a EBSD image quality, inverse pole figure, and phase fraction maps. b, c TEM observations with EDS mapping of precipitates.
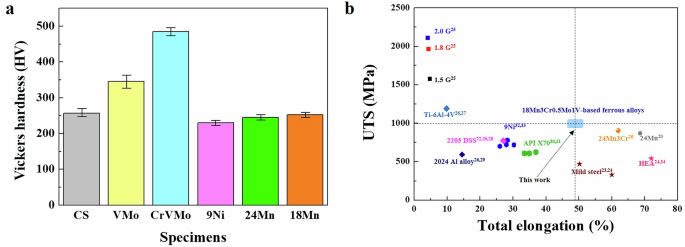
a Vickers hardness measurements of the tested samples (the error bars represent standard deviations of the mean values). b Chart for UTS-elongation of various ferrous alloys (24Mn steel20, 24Mn-3Cr steel20, mild steels (0.17C23/0.18C24), 1.5 Giga steel (0.2–0.3C)25, 1.8 Giga steel (0.3–0.4C)25, and 2.0 Giga steel (0.4–0.5C)25), Ti-6Al-4V alloy26,27, 2205 duplex stainless steel (0.03C-22.42Cr-6.2Ni-2.94Mo)22,26,28, 2024 Al alloy (alloy 2024-T351 plate)26,29, API X70 steel (0.06C-0.5 (Ni+Cu+Cr)30/0.08C-0.138Cr31), 9% Ni steel (0.05C-9Ni32/0.11C-9Ni33), and high entropy alloy (20Co-20Cr-20Fe-20Mn-20Ni24,34).
Figure 2b presents the combination regime of UTS and the total elongation of the samples used in the present study in comparison with some commercial alloys (24Mn steel20, 24Mn-3Cr steel20, low C-based mild steel23,24, and medium C-based ultra-high strength steel25), Ti alloy26,27, duplex stainless steel22,26,28, Al alloy26,29, API-grade ferritic steel30,31, 9% Ni steel32,33 and high entropy alloy24,34) reported previously, evaluated at room temperature. The 18Mn-bearing samples showed a desirable combination of high-strength (~1 GPa) and ductility (~50%) without showing a mutually exclusive relationship between strength and ductility. This corresponds to the highest level compared to structural alloys that have been commercially applied.
Electrochemical corrosion behaviors
Figure 3 shows the changes in the corrosion current density (icorr) and polarization resistance (Rp) of the 18Mn-bearing samples with an immersion time up to 35 days. The icorr values were determined by fitting the experimental linear polarization resistance (LPR) curves, and the fitted curves and values were presented in Supplementary Fig. 3 and Table 2, respectively. In contrast to the Cr-bearing samples (CrVMo, CrV, and CrMo), the CS and VMo samples had much higher icorr values, showing a continuous increase after an initial decrease of approximately 7 days. In particular, the more marked increase in icorr values with a much steeper increasing rate was noticed in the VMo sample. In contrast, the Cr-bearing samples showed gradual decreasing behaviors with very low downward slopes. This indicates that the Cr-alloying in such a small quantity is one of the most effective metallurgical strategies for controlling the corrosion kinetics of 18Mn-bearing alloys in a 3.5% NaCl solution. Among the samples, the CrVMo sample showed the lowest corrosion kinetic parameter after approximately 7 days of immersion.
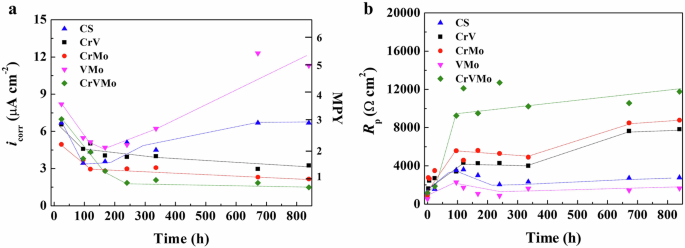
a Change in icorr, obtained by LPR measurements. b Change in Rp, obtained by EIS.
Moreover, the addition of Mo (0.5 wt.%) was found to be a little bit more effective in reducing the corrosion kinetics compared to the addition of V (1 wt.%). The order of the corrosion kinetic parameters followed the same trend as that of the reciprocal value of Rp representing the summation of charge transfer resistance (Rct) and film resistance (Rf), obtained by fitting to the experimental Nyquist plots (Supplementary Fig. 4) of electrochemical impedance spectroscopy (EIS). The various fitted parameters with the equivalent circuit models (Supplementary Fig. 5) are listed in Supplementary Table 3. Although the continuous decrease in Rp (Rct + Rf) was not observed in the samples without Cr (CS and VMo), their Rp values were much lower than those of the Cr-bearing samples. On the contrary, gradual increases in Rp values were noticed in the Cr-bearing samples. This suggests that the 18Mn-bearing sample containing all three components (Cr, V, and Mo) had the highest surface inhibition function against electrochemical corrosion by seawater.
Weight loss-based corrosion behavior
The electrochemical behaviors via LPR and EIS, described above, were in accordance with the weight loss measurements after immersion for 42 days, as shown in Fig. 4. Based on the parabolic kinetics of weight loss, the measured data were fitted with a typical formula, W = A × tn (W, A, t, and n are the weight loss, fitted constant, test time, and fitted kinetic parameter, respectively), and the fitted constant and parameters are listed in Supplementary Table 4. The smaller n value indicates the slower weight loss kinetics (i.e., higher corrosion resistance)35, and the CrVMo and FSS sample with remarkably lower n values can be regarded to have superior corrosion resistance compared to CS and other 18Mn-bearing samples without any one of the alloying components (Cr, V, and Mo). Although the conventional FSS showed slightly lower weight loss than the CrVMo sample developed in the present work, FSS has a much lower strength (yield strength <205 MPa). In addition, FSS is generally susceptible to localized pitting and crevice corrosion attacks, as found from the pitting on the FSS matrix under exposure to a 3.5% NaCl solution (Supplementary Fig. 6).
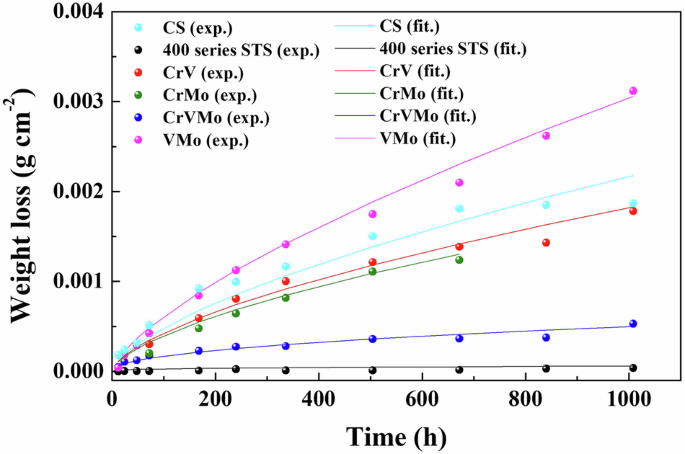
Weight loss of various ferrous alloys, measured after the immersion test (exp. and fit. are the experimental and fitted data, respectively).
Analysis of the corrosion scale (adherent inner rust) on the surface
Effect of Cr addition on the corrosion scale
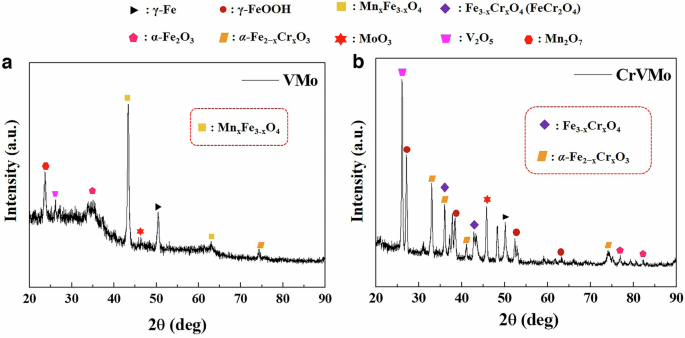
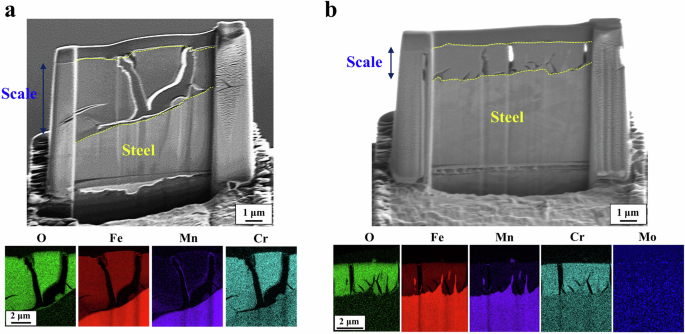
Figure 5 presents the cross-section observations with EDS mapping analysis of the two 18Mn-bearing samples (VMo and CrVMo). Remarkable differences in the corrosion scale were observed between the samples. Compared to the thicker scale with several coarse porosities on VMo, the scale on CrVMo was much thinner and greatly denser though there were coarse pores in the scale. Other than the morphological differences, there were notable differences in the elemental distribution in the scales between the samples. Specifically, Cr was highly concentrated throughout the scale of CrVMo, and its concentration level was divided into two parts (the innermost layer and its upper layer). EDS point analysis, given in Supplementary Table 5, indicated that the Cr concentration was approximately more than 20 wt.% around the innermost layer (point 3, marked in Fig. 5b), which was a much higher level than that around the upper layer. The corrosion scale formed on the VMo sample was composed of several oxides: α-Fe2O3, MoO3, and (Mn,Fe)3O4 (i.e., partial substitution of Mn in Fe3O4), as characterized by X-ray diffraction (XRD, Fig. 6). In contrast, the two types of Cr-substituted Fe oxides, (Fe,Cr)3O4 and α-(FeCr)2O3, and MoO3 were the major phases constituting the scale of the CrVMo sample.
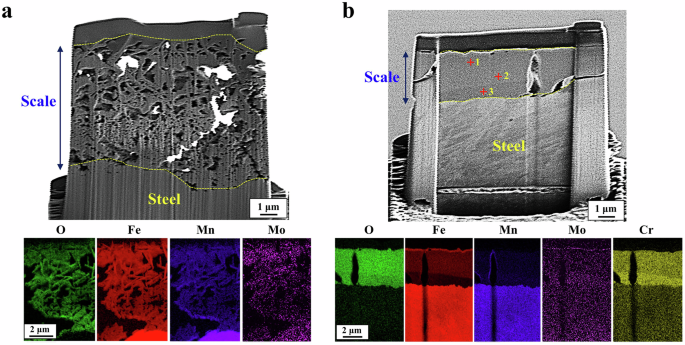
a VMo. b CrVMo.
a VMo (left). b CrVMo (right).
More detailed surface characterization via X-ray photoelectron spectroscopy (XPS), shown in Fig. 7, indicated that the surface of scale on the VMo sample consisted of several types of Fe, Mo, and Mn-based oxides (Fig. 7 and Supplementary Figs. 7 and 8). As the immersion time increased, the proportion of MoO3 increased, while those of the other components decreased. In contrast, the surface of scale formed on the CrVMo sample was composed of Fe, Mo, and Cr-based oxides (Fig. 7 and Supplementary Figs. 7 and 8). In addition to (Fe,Cr)-based oxides characterized by XRD, the presence of CrO3 and Cr2O3 phases was notable. With prolonged immersion, however, the proportions of MoO3, α-FeOOH, (Fe,Cr)-oxide, V2O5, and Cr2O3 increased, and those of rest decreased. Moreover, Fig. 7e, f suggests that (Fe,Cr)-oxide is initially absent in the scale. As the immersion time increases, however, (Fe,Cr)-oxide becomes evident in the scale. The XPS binding energy and full width half maximum values for 7 and 14 days immersions are provided in Supplementary Tables 6 and 7, respectively.
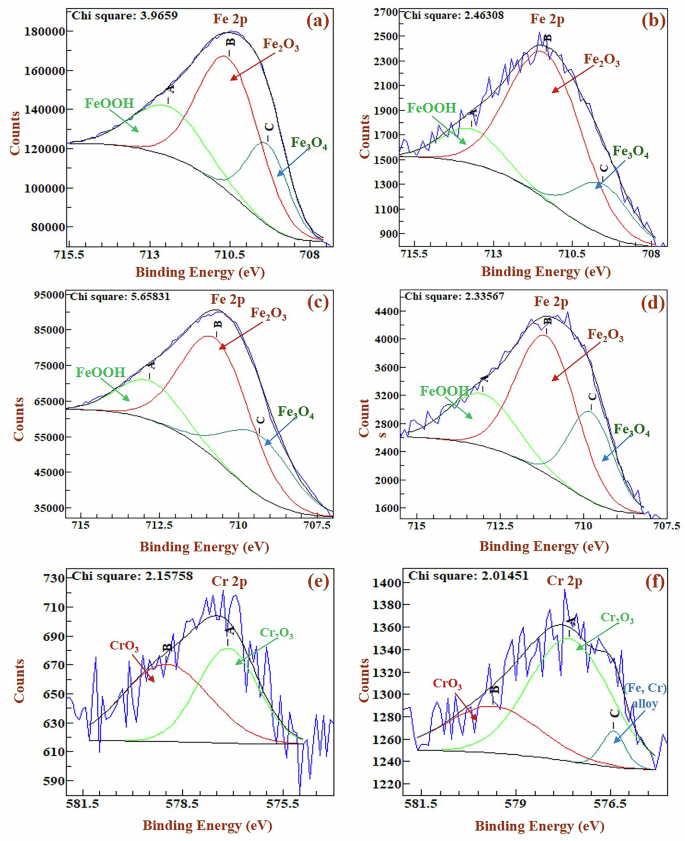
a, c VMo. b, d–f CrVMo. High-resolution Fe spectra on samples after 7 (a, b) and 14 days (c, d) immersion, and Cr spectra after 7 (e) and 14 days (f) immersion.
Effect of Mo/V additions on the corrosion scale
Figure 8 presents the cross-section observation with EDS mapping analysis of the two 18Mn-bearing samples (CrV and CrMo). It appears that the scale formed on the two types of samples was thinner and denser in comparison to that on the VMo sample. Similar to the case of the CrVMo sample, Cr was highly concentrated throughout the scales. The notable differences in the scale morphology among the samples were that the CrV sample had much larger cracks in the scale, and the CrMo sample had a larger number of smaller cracks, mostly at the interface between scale/matrix, compared to the scale of the CrVMo sample. In addition, a bi-layer structure dividing into the innermost part and its upper part according to Cr concentrations, as shown in Fig. 5b, was not observed in the scale of the two samples.
a CrV. b CrMo.
XPS analysis (Fig. 9 and Supplementary Figs. 9 and 10) suggests that the types of oxides present in the scale formed on both samples (CrV and CrMo) were the same, except for the presence of the MoO3 phase in the CrMo sample and the V2O5 phase in the CrV sample. Initially, the CrV sample contains Cr-bearing oxides ((Fe,Cr)-oxides and Cr2O3), while the scale of the CrMo sample includes (Fe,Cr)-oxides, Cr2O3, and CrO3 phases. With prolonged immersion, the proportions of these oxides decrease for both samples. Furthermore, Fig. 10 presents the cationic fractions determined from XPS data, providing significant insights into the distribution of cationic oxidation states in the samples. It clearly indicates that the only CrVMo sample contains the MoO3 and V2O5 phases (Mo+6 and V+5, respectively).
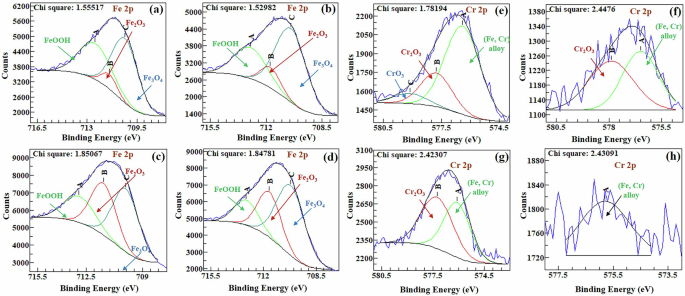
a, b, e, f CrMo. c, d, g, h CrV. High-resolution Fe spectra on samples after 7 (a, c) and 14 days (b, d) immersion, and Cr spectra after 7 (e, g) and 14 days (f, h) immersion.
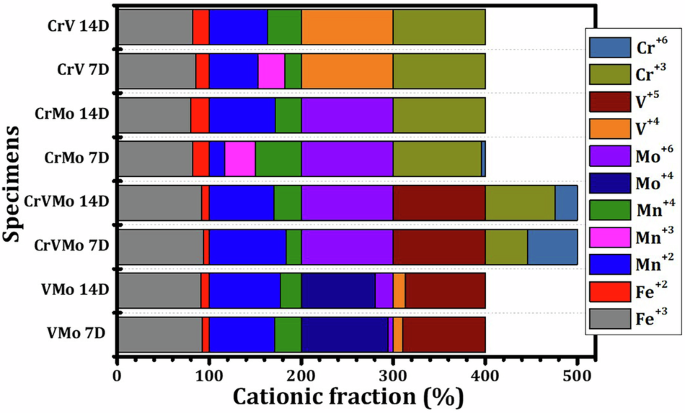
Cationic fraction of four tested samples determined from XPS analysis for 7 and 14 days immersion.
Effect of Cr addition on ion exchange properties
Figure 11 presents the variation of the potential difference in the NaCl solutions of different concentrations. In contrast to the VMo samples, which exhibit an inverse relationship between log (C2/C1) and the potential difference, the Cr-bearing samples display a proportional relationship, indicating cation selective behavior in their corrosion scales. In particular, the CrVMo sample shows the largest slope in the proportional relationship, effectively impeding the penetration of corrosive anion, Cl−. This can be supported by electron probe micro analysis (EPMA) (Fig. 11b), showing that Cl was mostly distributed in the outer part of the scale and decreased remarkably in the inner part formed on the CrVMo sample after immersion for 35 days.
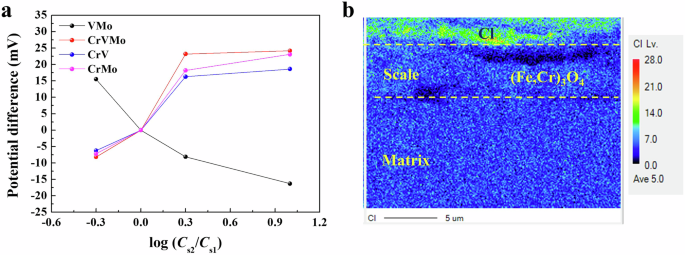
a Electrode potential difference of both sides on the scale in NaCl solutions with different concentrations. b Cl distribution of scale on the CrVMo, measured by EPMA after immersion in a 3.5% NaCl solution for 35 days.
Discussion
In comparison with a variety of commercial material classes, high Mn-bearing ferrous alloys have superior mechanical properties based on a more attractive combination of strength and ductility owing primarily to their inherent high strain hardening effect implemented primarily by the mechanical twinning under deformation9,10,11,36. We show here that the multi-component ferrous alloy with a quaternary combination of 18Mn-3Cr-0.5Mo-1V had not only a high UTS of more than 980 MPa at >47% elongation, but also had a high Vickers hardness >480, and much slow corrosion kinetics (i.e., corrosion rate <5.3 × 10⁻⁴ mg cm−2 h−1) in a 3.5% NaCl solution for 42 days. In this work, the metallurgical strategy of both precipitation hardening and refinement of the grain structure was used by the formation of fine V4C3 and (V,Cr)4C3 (i.e., the partial substitution of Cr in V4C3) precipitates distributed throughout the alloy matrix to further improve the mechanical properties. These microstructural modifications can be realized by adding 3Cr and 1V to the alloy. The contribution of V-addition to the improvement of mechanical properties (i.e., strength and hardness) could be apparent, as reported previously21,37,38. On the other hand, the beneficial effect of V-addition to this quaternary-based ferrous system is not confined to the mechanical properties; it also affects the corrosion behaviors owing to the synergistic interactions with other alloying elements. In this perspective, we reveal here the influence of a combination of micro-alloying (3Cr, 0.5Mo, and 1V) of an 18Mn-bearing ferrous alloy on corrosion protection behavior in a seawater environment (i.e., a 3.5% NaCl solution) is discussed in detail as follows.
Based on the results of the electrochemical polarization and impedance, and weight loss after immersion, it is apparent that even if Mo and V are added to the 18Mn-based alloy, its corrosion kinetics in saline environments can be remarkably increased without 3Cr alloying. The corrosion kinetics of Cr-free 18Mn-bearing alloy became even faster than that of commercial carbon steel. As Mn and V are more electroactive element compared to Fe, their thermodynamic driving force for anodic dissolution (standard reduction potential values for Mn2+ + 2e− → Mn and V2+ + 2e− → V are −1.18 and −1.175, respectively) in the alloy would be much higher18,19,39 (refer to the Pourbaix diagram of Mn and previously reported work18,19,20,40). Therefore, the Cr-free 18Mn-bearing alloy was not expected to have corrosion scale with a protective nature, as evidenced morphologically by the formation of thicker and irregular scale (characterized as (Fe,Mn)3O4) with several coarse porosities (Fig. 5a).
In contrast, the Cr-bearing alloys exhibiting much slower corrosion kinetics have thinner and remarkably denser corrosion scale. Although the scale has some cracks, its adhesion to the underlying matrix may be much stronger, considering the difficulty of scale detachment even after ultrasonic cleaning for more than 1 h (in a preliminary test). The lower corrosion rates caused by the formation of denser and adhesive scale are closely associated with the compactness of particles incorporated with Cr in the scale. Regarding the Cr-incorporation in the scale, a recent study by Jeong et al.20 reported that, in a ternary system consisting of high Mn-low Cr-balanced Fe, the surface in an advanced state of corrosion can be rapidly enriched with Cr by the preferential dissolution of Mn and Fe, leading to the formation of (Fe,Cr)-enriched oxide scale. In a similar but discriminatory manner, a variety of Cr-bearing oxides, Cr-Fe alloy, CrO3, and Cr2O3, can be formed in the scale of the present alloy system (evidenced by XPS analysis). The partial substitution of Fe by Cr in Fe-based oxides (i.e., (Fe,Cr)3O4 and (FeCr)2O3) can also appear as the slight shift of the X-ray diffraction (XRD) peaks to higher 2θ values, leading to the lattice contraction giving rise to the refinement of the particle size in its structure41. Yamashita et al.42 reported also that the formation of Cr-bearing Fe oxide on Fe-Cr alloy could lead to the dense aggregation of small crystals providing high protection ability against the penetration of aggressive corrosive anions. The remarkable densification of the corrosion scale on the Cr-bearing alloy in this work can be understood in this regard. This also suggests that the Cr-alloying in such a small quantity is one of the most effective metallurgical strategies to lower the corrosion rates of 18Mn-bearing alloys. Nevertheless, with the addition of 3Cr alone, there are limitations in achieving a hybrid performance of superior mechanical properties and long-term environmental stability in corrosive saline environments. Therefore, further optimization of alloying will be needed to maximize the synergistic interaction among other elements, enabling 18Mn-bearing alloys to have a lower corrosion rate.
From a metallurgical perspective, Mo alloyed in ferrous alloys can contribute to increase their strength via solid solution strengthening43. In addition to enhancing mechanical property, adding Mo, even in trace quantities (0.5 wt.%), can also contribute to further improve the corrosion resistance of the alloy system studied in this work. Although it is unclear from the XPS analysis whether the slower kinetics of corrosion and scale-forming processes of Mo-added alloy during the early immersion stages are caused by the molybdate ions (MoO42−) adsorbed on the surface, Mo alloyed in this system promotes the change in the fraction of oxides in the corrosion scale with prolonged immersion. In the CrMo sample, metastable CrO3, one of the phases known for its poor corrosion resistance44, comprising a comparatively larger proportion in the scale at an early corrosion stages. Although the fraction of CrO3 decreases with prolonged immersion, the fractions of stable (Fe,Cr)-oxides and Cr2O3 also decrease, while the fractions of Fe-oxides (i.e., Fe3O4 and Fe2O3) and MoO3 increase. Notably, the presence of stable MoO3 in the scale could influence the corrosion behaviors. According to Sun et al.44, the oxidation of metallic Mo into the more stable MoO344,45, as described below (Eqs. (1)–(3)), can promote the conversion of CrO3 into more stable and corrosion-resistant trivalent products of Cr2O3 and (Fe,Cr)3O4, which can enhance the protective performance in the corrosive environments:
The combined addition of Cr and Mo as micro-alloying to ferrous alloys has also been suggested to improve their corrosion resistance46,47. In particular, Sk et al.47 reported that the synergistic interaction between Cr and Mo could enhance the crystallization rate of corrosion scale with smaller crystallites. They also indicated that the optimized addition of Mo with only less than 1 wt.% may replace a much higher percentage of Cr for a similar degree of corrosion protection. Based on the facts, discussed above, this study proposes that the combination of 3Cr-0.5Mo as alloying elements can confer better protection to the 18Mn-bearing ferrous alloy by stabilizing the stable oxide products (i.e., Cr2O3, (Fe,Cr)3O4, MoO3) in the corrosion scale, similar to the case of conventional steel alloys with micro-alloying of Cr and Mo.
The combined addition of V and Cr to an 18Mn-bearing alloy can also lead to the simultaneous improvement of the corrosion resistance as well as the mechanical properties (i.e., hardness and wear-resistance), similar to the effects of Mo described above. Due to the competitive interactions among Cr, V, and C in the alloy, fine precipitates of V4C3 and (V,Cr)4C3 with several to tens of nanometers in size can be formed throughout the matrix. As V has a stronger affinity for C, the formation of Cr23C6 could be avoided in the matrix, which may leave more Cr available in solid solution. Thus, in turn, enhances the Cr-enriched level in the inner scale with fine crystallites, giving rise to protective characteristics in corrosive environments.
However, EDS mapping (Fig. 1c) indicates that completely preventing Cr from entering V-carbides is not feasible. Nevertheless, the partial incorporation does not diminish the primary role of V in suppressing Cr-carbide formation and retaining the majority of Cr in the matrix. On the other hand, the electrochemical and weight loss measurements showed that adding 1 wt.% V is slightly less effective in reducing the corrosion rates than adding 0.5 wt.% Mo. The formation mechanism of V oxides primarily results in the formation of three oxides: VO2, V2O3, and V2O5, with V2O5 being the most stable and protective oxide48. Even so, V-addition also promotes the formation of V2O5, (Fe,Cr)-oxides, and Cr2O3 phases, while reducing the fraction of the CrO3 phase in the corrosion scale, as evidenced by XPS analysis-similar to the effect observed with Mo-addition.
Based on the mechanistic role of micro-alloying, the quaternary combination of 18Mn-3Cr-0.5Mo-1V can impart superior long-term corrosion resistance to the ferrous alloy in seawater environments. Considering only in terms of the weight loss, the ferritic STS with more than 13Cr can be regarded to be a better material. However, the multi-component (Mn-Cr-Mo-V) ferrous alloy developed here can be more suitable for seawater use because there is no risk of local corrosion damages (e.g., pitting and crevice), which is observed frequently in ferritic STS (see Supplementary Fig. 6). This susceptibility to localized corrosion of STS arises from the local breakdown of its passive film (i.e., passivity degradation), in contrast to high Mn-based ferrous alloys-which do not exhibit passivity-where uniform corrosion predominates. Hence, the multi-component ferrous alloy could be more advantageous in terms of the life prediction of the material. Fundamentally, the superior corrosion resistance of such a high Mn-bearing alloy is grounded on the formation of protective corrosion scale composed mainly of trivalent Cr-based oxides (Cr2O3 and (Fe,Cr)3O4) and molybdenum trioxide (MoO3) by the optimal use of micro-alloying. The protective nature is imparted primarily on the impediment of penetration of corrosive species (e.g., Cl anion) into the alloy surface owing to the following two effects of the corrosion scale. One is the densification of particles in the scale, as described above, and the other is its ion exchange property (i.e., cation selective properties).
Regarding the latter described above, it can be understood in a similar context to the cation selectivity of a rust layer (CrxFe1-xOOH) formed on the Fe-Cr binary system43,49. As confirmed by the above XPS results, the Cr-containing samples develop dense, stable oxides, including Cr2O3, (Fe,Cr)3O4, and α-(Fe,Cr)2O3, which enhance cation selectivity by creating a barrier that impedes Cl− penetration. As a result, selective ion transport generates a larger potential drop as slower-moving cations (Fe²⁺, Mn²⁺) migrate more readily than Cl−, hence contributing to the higher observed potential difference. In contrast, non-Cr-containing samples produce corrosion scales mainly consisting of Fe- and Mn-based oxides, which are less stable and more porous. Consequently, both cations and anions can pass through more easily, resulting in a smaller potential drop, lower ionic resistance, and reduced ion-selective behavior. In the double-cell setup, the concentration gradient between the ionic solutions creates a liquid junction potential that depends on the relative mobilities of the ions and the selectivity of the corrosion scale. For the CrVMo sample, the preferential transport of cations (Fe²⁺ and Mn²⁺) over Cl⁻ amplifies the potential difference due to the slower mobility of these cations. Combined with the intrinsic cation selectivity of the CrVMo corrosion scale, this leads to the steepest slope in Fig. 11. Conversely, non-Cr-containing samples exhibit a lower liquid junction potential due to their less selective ion transport across their corrosion films. Their lower resistance allows faster-moving Cl⁻ to pass more freely, thus diminishing the contribution of the junction potential to the overall potential difference.
According to previous studies43, the cation selectivity of ferrous materials becomes more noticeable as the Cr3+ concentration in the corrosion scale increases. Although the substitution of Cr for Fe (i.e., (Fe,Cr)3O4) in the oxide composed of scale may not cause charge variation, the Cr3+ coordinated with O2− in the double chains of vacant sites (i.e., CrOx3–2x complex anion) can become negatively charged, giving cation selectivity43. On the other hand, a much smaller Cr concentration (<3 wt.%) in the (Fe,Cr)-oxide could also change the ion exchange property to an anion selective one50, as shown in the case of Fe-based oxide.
Methods
Materials preparation and characterization
The slabs (four types of 18Mn-bearing ferrous alloys) were prepared using a continuous casting process, and the oxide scale formed on their surfaces was removed during the subsequent grinding process. They were then hot-rolled to a final total thickness reduction of 80%, and subsequently cooled within the temperature range of 800–500 °C at a rate faster than 10 °C s–1, which is in accordance with ASTM A1106/A1106M51. The CS was produced by a typical thermo-mechanical controlled process (TMCP) consisting of a controlled rolling and accelerated cooling process using a water spray.
The difference in the microstructure of the samples (CrVMo and CrMo), depending on V-addition, was examined by electron backscatter diffraction (EBSD) and transmission electron microscopy (TEM)-EDS. EBSD analysis was performed with an acceleration voltage, beam current, and step size of 20 kV, 1 nA, and 40 nm, respectively.
Mechanical tests
The uniaxial tensile tests of the mechanically grounded samples with gage dimensions of 60 mm × 1 mm × 10 mm were conducted using a tensile machine (Galdavini) with a strain rate of 10−3 s−1 at ambient temperature. The tests were repeated three times to ensure repeatability, and the UTS and TE of the samples were determined. The Vickers hardness tests with a 1 kgf denting load were also performed on the surface of each sample after grinding to 2400 grit sand paper. Ten indentations were measured on each sample, and a representative hardness was derived from the average value of the eight indentations, excluding the maximum and minimum indentations.
Electrochemical measurements
Electrochemical tests were carried out with a conventional three-electrode cell in an artificial seawater (ISO 1724452) via a potentiostat (Gamry Reference 600) at 25 °C. A saturated calomel electrode (SCE) and Pt-wire were selected as the reference and counter electrode, respectively. Prior to the electrochemical tests, the samples serving as the working electrode were initially ground to 2000 grit sand paper and cleaned ultrasonically in ethanol for 30 s. For the electrochemical tests, each sample had an exposed area of 1 cm2 in a stagnant solution at room temperature. To evaluate the LPR, the samples exposed to the solution for 1 h to 35 days, were polarized from −20 to 20 mV vs. OCP at a scan rate of 0.17 mV s−1. This test was carried out at least three times to ensure reproducibility, and representative data are presented in semi-log format (in Supplementary file). The icorr, represented as a corrosion kinetic parameter, was determined by fitting the experimental LPR curves to the theoretical Wagner-Traud equation53, given in the following Eq. (4):
where i, icorr, βa, βc, E, and Ecorr are the measured total current density (A cm−2), corrosion current density (A cm−2), anodic Tafel slope (V decade−1), cathodic Tafel slope (V decade−1), measured potential (V), and corrosion potential (V), respectively.
The corrosion rate (MPY, mils per year) was also derived from icorr by the unit conversion, and the changes in icorr and MPY of the samples were plotted with increasing immersion periods.
In addition, EIS was conducted on the samples over the frequency range from 10 mHz to 100 kHz, with an amplitude of ±10 mV AC potential vs. the OCP. The changes in Rp of the samples with increasing immersion periods were determined by fitting the experimental Nyquist plots to an equivalent circuit model composed of the solution resistance (Rs), double layer capacitance at the solution/steel interface (Qdl), charge transfer resistance at the solution/steel interface (Rct), film capacitance (Qf), film resistance (Rf), and depression parameter (n, 0 < n < 1).
Weight loss measurements
For the weight-loss measurements, the samples, 40 mm in width, 40 mm in length, and 5 mm in thickness, were ground to 1200 grit sand paper and cleaned ultrasonically in ethanol. The initial weights were recorded using an analytical balance to a precision of 0.0001 g. Following immersion in stagnant artificial seawater at room temperature for 42 days, the corrosion products formed on the samples were removed ultrasonically in ethanol for 10 min, then re-weighed. For samples containing Cr, however, the corrosion products were removed by immersing them in hydrochloric acid inhibited with hexamethylenetetramine for several seconds in an ultrasonic bath, rather than using ethanol, in accordance with ASTM G1-0354, as the inner corrosion products adhered more strongly to the substrate. Repeatability was ensured using three specimens for each material and obtaining the average values from the three measured values.
Analysis of corrosion scale
The corrosion scales formed on the sample surfaces during the immersion in stagnant artificial seawater at room temperature were observed using the focused ion beam (FIB) technique combined with TEM. The elemental compositions of the scale were analyzed by EDS. To characterize the phases formed in the scales of CrVMo and VMo samples, XRD (Bruker type diffractometer using a Cu anode) was performed. In addition, XPS (VG Scientific Escalab 250) using monochromatic Al Kα radiation was employed to examine the scale formed on the tested samples. The voltage, emission current, and spot size for XPS were 15 kV, 10 mA, and 500 μm in diameter, respectively. A constant analyzer energy mode with a 50 eV pass energy for the high-resolution spectra was used. A spectral data processor v 3.0 was used to deconvolute the spectra by minimizing the χ2-value. The binding energy was calibrated with the C 1s peak at 284.8 eV. The proportion (%) of phases in the scale was determined based on the area fraction of each phase curve (i.e., semi-quantitative analysis on XPS, reported elsewhere44).
Ion exchange property
The corrosion scale formed on the surface of four tested samples after immersion in stagnant artificial seawater at room temperature for 35 d was filtered, washed in DI water, and dried. The scale in the form of powder was applied thinly to the aga, acting as a salt bridge. They were positioned at the center of the double cell, as shown in Supplementary Fig. 5. One side of the cell was filled with 0.001 M NaCl solution, and the other side was filled with a 0.1, 0.05, 0.01, 0.005, 0.001, and 0.0005 M NaCl solution. The electrode potentials of both sides were then measured. When the rust was exposed to the two NaCl solutions with different concentrations, the electrochemical potential difference between both solutions can be yielded by the following Eq. (5)55,56:
where ({alpha }_{{{Na}}^{+}}), ({alpha }_{{{rm{Cl}}}^{-}}), T+, T−, R, T, and F are the activity coefficients of Na+ and Cl−, the transmission number of Na+ and Cl−, gas constant, temperature (K), and Faraday constant, respectively.
In a diluted solution, Eq. (5) can be simplified further as Eq. (6), given below, and the potential difference was plotted with log(C2/C1)55,56:
where Cs1 and Cs2 are the concentrations of solutions on both sides of the cell, respectively.


Responses