Suppressing astrocytic GABA transaminase enhances tonic inhibition and weakens hippocampal spatial memory
Introduction
Tonic inhibition, characterized by persistent inhibitory transmission that modulates neuronal excitability, results from the interaction between tonically released γ-aminobutyric acid (GABA) and high-affinity GABAA receptors (GABAARs) located extrasynaptically1,2,3,4,5,6,7,8. Its importance is underscored by the observation that, in some cases, the charge conveyed by long-lasting tonic GABA currents can exceed that of short-lasting phasic GABA currents produced by presynaptically released GABA binding to synaptic GABAARs with low affinity9. Therefore, understanding the role of tonic inhibition in the brain can provide insights into various pathophysiological states, including neurodegenerative diseases, metabolic disorders, movement disorders, physical trauma and psychiatric disorders10,11,12,13,14,15,16,17,18,19,20,21,22,23,24, where the balance of neuronal excitation and inhibition may be compromised.
So far, the level of tonic inhibition has been readily reduced by suppressing either monoamine oxidase B (MAO-B)10,13,14,15,16,18,20,24,25,26,27,28,29,30,31,32, the key enzyme in the astrocytic GABA production pathway, or bestrophin 110,16,17,32,33,34,35,36,37, the key ion channel mediating tonic GABA release from astrocytes. Through the suppression of MAO-B or bestrophin 1, impaired neuronal excitability can be restored in disease models, such as Alzheimer’s disease models10,14. By contrast, no studies have explored potential manipulations that increase tonic GABA release from astrocytes and tonic inhibition to suppress neuronal excitability, either under physiological conditions or for the treatment of brain disorders, such as epilepsy.
Elevating brain GABA levels is a key therapeutic strategy for counteracting excessive excitatory neurotransmission in many neurological and psychiatric disorders. To this end, suppression of the GABA degradation pathway has been proposed as a feasible and efficient method, particularly by inhibiting GABA transaminase (GABA-T), which is the only enzyme responsible for GABA degradation in mammals38. This enzyme, encoded by the ABAT gene, breaks down GABA that is either produced or taken up by astrocytes and GABAergic neurons17,25,32,39. GABA-T transforms GABA into succinic semialdehyde (SSA) while simultaneously converting α-ketoglutarate into glutamate. A downstream enzyme called SSA dehydrogenase (SSADH), encoded by the ALDH5A1 gene, subsequently converts SSA into succinate. Previous studies have primarily focused on GABAergic neurons, where pharmacological GABA-T suppression increases GABA accumulation and synaptic GABA release, changes that are expected to dampen excessive neuronal activity and provide therapeutic benefits for epilepsy and drug addiction40,41,42,43,44,45. However, although several studies have highlighted a substantial increase in tonic inhibition due to a disruption of the GABA degradation pathway7,46,47,48,49, in-depth research into its neuromodulatory and therapeutic impacts is still lacking, largely because the cellular origin of the enhanced tonic inhibition remains ambiguous.
In the present study, we investigate whether astrocytic GABA-T is responsible for enhanced tonic inhibition upon pharmacological GABA-T suppression. We focused on the dorsal hippocampal dentate gyrus (DG), a region that is not only crucial for spatial learning and memory but also susceptible to modulation by tonic inhibition10,14,22. We found that astrocyte-specific suppression of GABA-T can effectively increase astrocytic tonic GABA release and tonic inhibition, thereby controlling neuronal excitability and related behaviors.
Materials and methods
Animals
Male C57BL/6J mice (8–16 weeks old) obtained from the Institute for Basic Science (IBS) Research Solution Center were used. All the animals were maintained on a 12 h light‒dark cycle in a specific-pathogen-free facility with controlled temperature and humidity and had free access to food and water. All experimental procedures were conducted according to protocols approved by the Institutional Animal Care and Use Committee of the IBS. Every effort was made to minimize the animals’ suffering and reduce the number of animals used.
Viruses
The following viruses were used for this study: Lenti-pSicoR-shSCR-GFP, Lenti-pSicoR-shABAT-GFP, AAV5-pSicoR-shSCR-mCherry, AAV5-pSicoR-shABAT-mCherry, AAV5-gfaABC1D-GFP-myc-Cre, AAV5-gfaABC1D-GFP and AAV5-gfaABC1D-mABAT-2A-GFP. For the control short hairpin RNA (shRNA) (scrambled shRNA, shSCR), a scrambled sequence (5′-TCGCATAGCGTATGCCGTT-3′) was inserted in place of the shABAT sequence.
Primary cultures
Primary astrocytes were obtained from C57BL/6J mouse pups at postnatal days 0 to 2 (P0–2). Due to the very young age of the pups, it was not feasible to determine the sex of the pups from which the cells used in the culture were generated. The hippocampus was carefully dissected and finely chopped. The tissue was then gently triturated with a Pasteur pipette to achieve a single-cell suspension. The dissociated cells were then seeded on 35 mm culture dishes precoated with poly-d-lysine (0.1 mg/ml). The cells were grown in DMEM supplemented with 25 mM glucose, 2 mM glutamine, 10% heat-inactivated horse serum, 10% heat-inactivated fetal bovine serum and 1% penicillinn‒streptomycin. On the third day of culture, the cells were washed with PBS through repeated pipetting, and the medium was then replaced to remove debris and floating cells. The cultured cells were maintained at 37 °C in a humidified incubator with 5% CO2.
Immunocytochemistry
The cultured primary hippocampal astrocytes were seeded onto 12 mm circular cover glasses (Paul Marienfeld, 111520) and treated with 150 μM vigabatrin (VGB, Tocris, 0808) for 24 h. After treatment, the samples were fixed with 4% paraformaldehyde (PFA) in 0.1 M PBS for 15 min. The samples were then washed three times with PBS and incubated for 1 h in a blocking solution containing 0.3% Triton-X and 2% donkey serum in PBS. The samples were subsequently immunostained with a chicken polyclonal antibody against glial fibrillary acidic protein (GFAP) (1:500, Millipore, AB5541) and guinea pig polyclonal antibody against GABA (1:200, Millipore, AB175), both of which were mixed into the blocking solution. The samples were incubated with the primary antibodies at 4 °C for 24 h with gentle rocking. Afterward, the samples were washed three times with PBS and then incubated with an Alexa Fluor 488-conjugated donkey anti-chicken polyclonal antibody (1:500, Jackson ImmunoResearch, 703-545-155) and an Alexa Fluor 594-conjugated donkey anti-guinea pig polyclonal antibody (1:500, Jackson ImmunoResearch, 706-585-148), both of which were mixed with the blocking solution. The secondary antibody incubation was performed at room temperature for 2 h with gentle rocking. Afterward, the samples were washed three times with PBS. During the second round, DAPI (1:1,000, Thermo Fisher, 62248) was added to the PBS to visualize the nuclei of the cells. Finally, the cover glasses were mounted with fluorescence mounting medium (Agilent, S3023) and left to dry. The fluorescence images were captured using a Zeiss LSM900 confocal microscope, and Z-stack images were processed with ZEN Blue (Zeiss, version 3.2) and ImageJ (version 1.54f).
RT‒PCR
The total RNA was extracted from the collected cell pellet using an RNeasy Mini Kit (Qiagen, 74104). The extracted RNA was then converted to complementary DNA using the SuperScript III First-Strand Synthesis System (Invitrogen, 18080051). Subsequently, we performed PCR using QuestTaq PCR premix (Zymo Research, E2051). The procedure started with a 1 min denaturation phase at 95 °C, followed by 30 cycles of the following sequence: denaturation at 95 °C for 30 s, annealing at 55 °C for 30 s and extension at 72 °C for 10 s. Then, a final extension was performed at 72 °C for 7 min. All steps were optimized on the basis of the manufacturers’ protocols. The sequences of the primers used for RT‒PCR were as follows:
mouse ABAT forward, 5′-TGGTACCGGAGTAAGGAACG-3′;
mouse ABAT reverse, 5′-GAGTGTGTGGTCGCTAAGCA-3′;
mouse GAPDH forward, 5′-ACCCAGAAGACTGTGGATGG-3′;
mouse GAPDH reverse, 5′-CACATTGGGGGTAGGAACAC-3′.
Western blot
The protein samples were separated on 10% SDS‒PAGE gels under reducing conditions and then electrophoretically transferred onto polyvinylidene difluoride (PVDF) membranes using the iBlot2 Dry Blotting System (Thermo Fisher Scientific). After an incubation with 5% skim milk in TBST (10 mM Tris, pH 8.0; 150 mM NaCl; 0.5% Tween 20) for 1 h at 25 °C, the membranes were washed once with TBST and incubated with a rabbit monoclonal antibody against GABA-T (1:1,000, Abcam, ab108249) or a rabbit monoclonal antibody against β-actin (1:1,000, Abcam, ab133626) at 4 °C overnight. The membranes were subsequently washed with TBST five times and incubated with horseradish peroxidase-conjugated goat anti-rabbit IgG (1:3,000, BioActs, RSA1221) for 1 h at 25 °C. The membranes were subsequently washed with TBST five times and developed with an enhanced chemiluminescence (ECL) substrate (Bio-Rad, 1705061). The images of chemiluminescence were captured with an ImageQuant LAS 500 chemiluminescence CCD camera (Cytiva).
Stereotaxic injection
The mice were anesthetized with vaporized isoflurane (induction 3–4%, maintenance 1.5–2%) and placed into stereotaxic frames (RWD). The scalp was incised and a hole was drilled into the skull above the hippocampal DG (anterior/posterior, −1.8 mm from the bregma; medial/lateral, ±1.2 mm from the bregma; dorsal/ventral, −1.9 mm from the skull). The virus was loaded into a 33G blunt NanoFil needle (WPI, NF33BL) and injected bilaterally into the DG at a rate of 0.2 μl/min for 5 min (total 1 μl) using a syringe pump (KD Scientific). At the end of the virus infusion, the position of the needle was maintained in the brain for another 10 min to minimize backflow of the virus. All the viruses used were produced by the virus facility of the IBS. A total of 6 weeks after the virus injection, the mice were subjected to ex vivo patch-clamp recordings and in vivo experiments.
Immunohistochemistry
The mice were anesthetized via an intraperitoneal injection of alfaxan (80 mg/kg) and xylazine (20 mg/kg) dissolved in saline. Then, the mice were perfused with saline followed by an ice-cold 4% PFA solution. The extracted brains were postfixed overnight at 4 °C in a PFA solution, transferred to a 30% sucrose solution and incubated at 4 °C for 48 h. The coronal hippocampal sections with a thickness of 30 μm were prepared using a cryotome and stored in storage solution at 4 °C. The sections were washed three times with 0.1 M PBS and incubated for 1 h with a blocking solution (0.3% Triton-X-100, 2% donkey serum in 0.1 M PBS). The sections were subsequently incubated for 24 h at 4 °C with the required concentrations of primary antibodies mixed with the blocking solution under gentle agitation. The primary antibodies used for GABA-T immunostaining in astrocytes were a chicken polyclonal antibody against GFAP (1:500, Millipore, AB5541) and a rabbit monoclonal antibody against GABA-T (1:500, Abcam, ab216465). The sections were washed three times with PBS to remove unbound primary antibodies. After washing, the sections were incubated with secondary antibodies for 2 h at room temperature. The secondary antibodies used for GABA-T immunostaining in astrocytes were donkey anti-chicken Alexa 405 or 594 (1:500, Jackson ImmunoResearch, 703-475-155 or 703-585-155) and donkey anti-rabbit Alexa 647 (1:500, Jackson ImmunoResearch, 711-605-152). Afterward, the sections were washed three more times with PBS to remove unbound secondary antibodies. The sections were mounted with fluorescence mounting medium (Agilent, S3023) and dried. A series of fluorescence images were obtained using a Zeiss LSM900 confocal microscope. Z-stack images were processed with ZEN Blue (Zeiss, version 3.2) and ImageJ (version 1.54 f).
Slice preparation
The mice were anesthetized with vaporized isoflurane before being decapitated to isolate the brain. The isolated brains were then excised and submerged in an ice-cold sucrose slicing solution containing: sucrose 212.5 mM, KCl 3 mM, NaHCO3 26 mM, NaH2PO4 1.25 mM, CaCl2 0.1 mM, MgCl2 5 mM and glucose 10 mM. Next, each brain was glued onto the stage of a vibrating microtome (DSK, Linear Slicer Pro7), and 300-μm-thick coronal slices were prepared. For stabilization, the slices were incubated at room temperature for at least 30 min in an artificial cerebrospinal fluid (ACSF) solution with the following composition: NaCl mM 124, KCl 3 mM, NaHCO3 24 mM, NaH2PO4 1.25 mM, CaCl2 2 mM, MgCl2 1 mM and glucose 10 mM. All the solutions were continuously gassed with a mixture of 95% O2 and 5% CO2.
Tonic GABA current recordings
The slices were transferred to a recording chamber that was continuously perfused with the ACSF solution (flow rate 2 ml/min). The slice chamber was mounted on the stage of an upright microscope (Nikon) and viewed with a 60× water immersion objective (numerical aperture (NA) 1.00, working distance (WD) 2.80) using infrared differential interference contrast optics. The cellular morphology was visualized with an sCMOS camera (Hamamatsu) and Imaging Workbench software (INDEC BioSystems). Whole-cell voltage-clamp recordings were performed on granule cell (GC) somata located in the outer molecular layer of the dorsal hippocampal DG. The holding potential was −70 mV. The patch pipettes (resistance of 6–8 MΩ) were filled with an internal solution containing the following: CsCl 135 mM, NaCl 4 mM, CaCl2 0.5 mM, HEPES buffer 10 mM, EGTA 5 mM, Mg-ATP 2 mM, Na2-GTP 0.5 mM and QX-314 10 mM. The pH was adjusted to 7.2 with CsOH, and the osmolality was measured as 278–285 mOsmol/kg. The baseline current was stabilized with a bath application of D-AP5 (50 μM, Tocris, 0106) and CNQX (20 μM, Tocris, 0190) to isolate GABAAR currents from NMDA and AMPA currents. Electrical signals were digitized and sampled using a Digidata 1440A digitizer and MultiClamp 700B amplifier with pClamp10.2 software (Molecular Devices). The raw data were filtered at 2 kHz. The tonic GABA currents were measured by the baseline shift in response to the bath application of tetrodotoxin (TTX) (1 μM, Alomone Labs, T-550) or bicuculline (50 μM, Tocris, 0109) using Clampfit software (version 10.7). The frequency and amplitude of spontaneous inhibitory postsynaptic currents (sIPSCs) before the bicuculline treatment were detected and measured with MiniAnalysis software (Synaptosoft).
Evoked spike probability
Synaptically evoked spikes in GCs were generated by a 0.1 Hz stimulation of lateral perforant path fibers (100 μs duration; intensities ranging from 100 to 1000 μA in 100 μA increments) using a tungsten bipolar electrode connected to a stimulus isolator (WPI). The evoked excitatory postsynaptic potentials were recorded using glass pipette electrodes (resistance of 6–8 MΩ) filled with an intracellular solution containing the following: K-gluconate 120 mM, KCl 20 mM, NaCl 2 mM, HEPES 20 mM, EGTA 0.5 mM, glucose 10 mM, Mg-ATP 2 mM and Na2-GTP 0.5 mM (pH 7.2 adjusted with KOH). The electrical signals were digitized and sampled using a Digidata 1440A digitizer and MultiClamp 700B amplifier with pClamp10.2 software (Molecular Devices). The raw data were filtered at 2 kHz. The spike probability was calculated as the ratio of the number of successful (spike-generating) stimuli to the total number of stimulations.
Y-maze test
Each mouse was placed in the center of a symmetrical Y-maze with three identical arms, each 30 cm long and 16 cm high. It was given free access to the arms for a 10 min session. The test was video-recorded using EthoVision XT (Noldus), and the results, including the total number of arm entries and alternation behavior, were analyzed later. The percentage of spontaneous alternation was calculated as follows:
Spontaneous alternations (%) = number of spontaneous alternations/(total number of arm entries − 2) × 100.
An entry was counted only when all four limbs of the mouse were inside the arm.
Novel place recognition test
Each mouse was habituated to an open field (40 × 40 cm with 40 cm high walls). Each mouse was exposed to two identical objects for a brief period (10 min) in the open field, with a simple visual cue placed on the wall to provide a spatial reference. The time spent exploring each object was recorded during the acquisition trial. After 1 h in the home cage, one of the familiar objects was moved to a novel place in the same arena. The mouse was then exposed to both the unchanged object and the relocated object for 10 min during the retrieval trial. Memory was measured as the proportion of time the animal spent exploring the relocated object versus the unchanged object. The discrimination index was calculated as follows:
Discrimination index (%) = (time exploring the newly placed object − time exploring the familiar object)/(time exploring the newly placed object + time exploring the familiar object) × 100.
As some mice exhibited a biased preference for contacting one of the two identical objects during the acquisition trial, changes in the discrimination index from the acquisition trial to the retrieval trial were calculated.
Statistical analysis
For data presentation and statistical analyses, we used GraphPad Prism (GraphPad, version 10.0.2). When comparing two groups, either the unpaired or paired t-test was used if the data passed both the normality test and the equal variance test. If the data from two groups did not pass the normality test, the Mann‒Whitney test was used. If the data from two groups passed the normality test but failed the equal variance test, Welch’s t-test was employed. For comparisons involving more than two groups, we used ordinary one-way analysis of variance (ANOVA) with Tukey’s post hoc test when the data passed both the normality test and the equal variance test. When the data did not pass the normality test, the Kruskal‒Wallis test with Dunn’s post hoc test were used. For comparisons with two independent variables, we used two-way ANOVA with Šídák’s multiple comparisons test for the post hoc analysis to correct for multiple comparisons. For repeated-measures data, we applied a two-way repeated-measures ANOVA with uncorrected Fisher’sleast significant difference (LSD), allowing more sensitive post hoc comparisons without correction for multiple comparisons.
Results
Silencing the GABA-T gene increases both phasic and tonic inhibition in dentate GCs
We designed and developed a shRNA to genetically suppress the expression of ABAT in mice and to recapitulate the increases in both phasic and tonic GABA-mediated inhibition observed with pharmacological GABA-T suppression (Fig. 1a). We treated cultured mouse hippocampal astrocytes with Lenti-pSicoR-ABAT shRNA (shABAT)-GFP and subsequently evaluated the knockdown (KD) efficiency through RT‒PCR and western blot analyses. These analyses revealed KD efficiencies of 70% and 76%, respectively, with shABAT (Fig. 1b,c). Using this shABAT, we aimed to achieve a non-cell-type-specific KD of GABA-T in the dorsal hippocampal DG to measure phasic and tonic GABA currents. To this end, we administered AAV5-pSicoR-shABAT-mCherry via injection at specified coordinates mediolateral [ML] ±1.2, anteroposterior [AP] −1.8, dorsoventral [DV] −1.9. The KD efficiency of the shABAT virus in dorsal hippocampal tissue was 81%, which was comparable with the KD efficiency observed in cultured astrocytes (Fig. 1c and Supplementary Fig. 1a). A total of 6 weeks after the injection, we prepared hippocampal slices and performed whole-cell voltage-clamp recordings on GCs within this region (Fig. 1d). As expected, the general GABA-T KD group presented significantly greater tonic GABA currents than did the control group treated with the shSCR (Fig. 1e,f). While the amplitude of sIPSCs remained unaffected, we observed a considerable increase in the frequency of sIPSCs after exposure to shABAT (Fig. 1e,f). These findings underscore that the general GABA-T KD using the shABAT can readily enhance both phasic and tonic GABA inhibition.
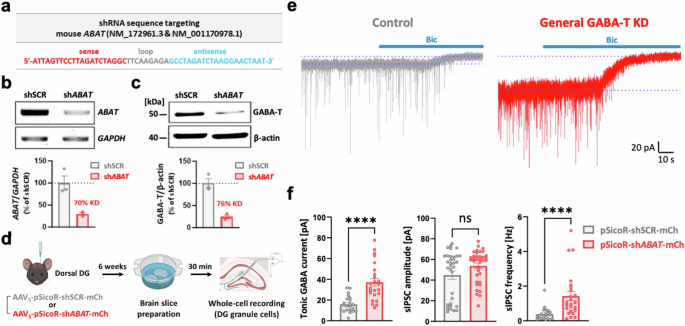
a, Mouse ABAT shRNA (shABAT) sequence (the sense in red, loop in gray and antisense in blue). b, Top: RT‒PCR analysis of ABAT and GAPDH mRNA levels in cultured mouse hippocampal astrocytes infected with either Lenti-pSicoR-shSCR-GFP or Lenti-pSicoR-shABAT-GFP. Bottom: comparative bar graphs presenting the ratio of ABAT/GAPDH expression. Each dot indicates a different culture batch. c, Top: western blot analysis of GABA-T- and β-actin-immunoreactive proteins from cultured mouse hippocampal astrocytes infected with either Lenti-pSicoR-shSCR-GFP or Lenti-pSicoR-shABAT-GFP. Bottom: comparative bar graphs presenting the ratio of GABA-T/β-actin expression. Each dot indicates a different culture batch. d, A workflow illustrating the nonspecific silencing of the GABA-T gene in the dorsal hippocampal DG, followed by brain slice preparation and whole-cell voltage-clamp recordings in GCs. e, Representative traces of GABAAR-mediated phasic and tonic GABA currents from the control (shSCR) and general GABA-T KD (shABAT) groups. f, A comparative bar graphs of the tonic GABA current (left), sIPSC amplitude (middle) and sIPSC frequency (right). sIPSCs recorded before the bicuculline (Bic) treatment were analyzed. n = 5 mice per group. The data are presented as the mean ± standard error of the mean. The individual dots refer to cells, unless otherwise specified. The P values were obtained via Welch’s t-test for f (left) as well as the Mann‒Whitney test (middle and right). ****P < 0.0001, nonsignificant (ns) indicates a P > 0.05.
Astrocytic GABA-T mediates GABA clearance
Before examining the link between astrocytic GABA-T and tonic inhibition, the pivotal function of astrocytic GABA-T in the regulation of GABA clearance must be confirmed. Therefore, we treated cultured mouse hippocampal astrocytes with VGB, the first Food and Drug Administration-approved GABA-T inhibitor50. Then, we performed immunocytochemistry for GFAP and GABA, as previously described26,51. As a result, we observed a clear increase in the GABA intensity within GFAP+ areas upon VGB (150 μM) treatment (Fig. 2a,b). These findings indicate that astrocytic GABA-T plays an important role in regulating intracellular GABA levels.
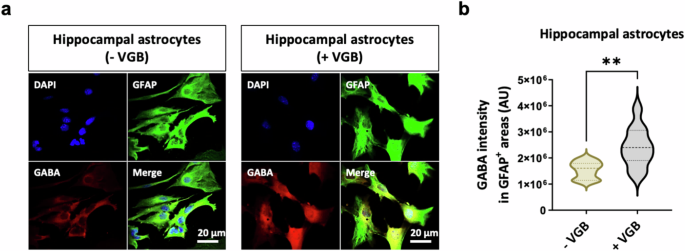
a, Immunostaining for GFAP and GABA in cultured mouse hippocampal astrocytes cultured in the absence or presence of 150 μM VGB for 24 h. b, Violin plots showing the average intensity of GABA staining in GFAP+ areas. The data are presented as the mean ± standard error of the mean. The P value was obtained via Welch’s t-test for b. **P < 0.01.
Suppressing GABA-T in astrocytes leads to increased tonic inhibition but not phasic inhibition in dentate GCs
Traditional irreversible GABA-T inhibitors, such as gabaculine and VGB, have been shown to increase both the intracellular and extracellular GABA levels in cultured human astrocytes52. This intriguing observation, along with our data (Fig. 2a,b), led to the hypothesis that astrocytic GABA-T could be an important contributor to the observed increase in tonic GABA currents after pharmacological GABA-T inhibition. We investigated this hypothesis by performing a general GABA-T KD, followed by an astrocyte-specific GABA-T rescue achieved through genetic manipulations. This approach was necessary because pharmacological GABA-T inhibition is not cell-type specific. By coinjecting AAV5-pSicoR-shABAT-mCherry and AAV5-gfaABC1D-GFP-myc-Cre into the dorsal hippocampal DG53,54, we were able to achieve Cre-dependent termination of shABAT expression exclusively in astrocytes (Fig. 3a,d). Unlike green fluorescent protein (GFP), which was localized in the cytosol of astrocytes, the Cre-conjugated GFP (GFP–Cre) fusion protein was localized in the cell nucleus of astrocytes because of its nuclear localization signal peptide (Fig. 3b). We performed immunohistochemistry with antibodies against GFAP and GABA-T to verify the changes in astrocytic GABA-T levels as a result of astrocyte-specific GABA-T manipulation (Fig. 3b). We found that the general GABA-T KD significantly reduced the levels of GABA-T in astrocytes. Moreover, this reduction in astrocytic GABA-T levels was reversed by rescue of astrocytic GABA-T (Fig. 3b,c), highlighting the efficacy and specificity of our genetic manipulation. Next, we conducted whole-cell voltage-clamp recordings on GCs to measure both tonic and phasic GABA-mediated currents at 6 weeks after the virus injection (Fig. 3d). Upon the astrocyte-specific rescue of GABA-T, the tonic GABA currents in GCs, which were elevated due to the general GABA-T KD, nearly returned to the control levels (Fig. 3e,f). This observation suggests that the suppression of astrocytic GABA-T selectively increases tonic inhibition. Notably, the amplitude and frequency of sIPSCs remained unchanged, indicating that astrocytic GABA-T is not involved in modulating phasic inhibition in GCs (Fig. 3f).
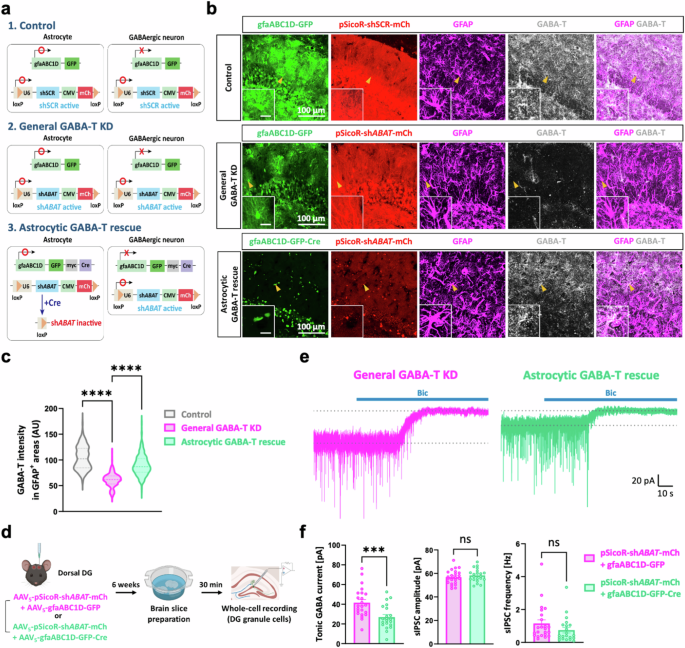
a, A scheme of the Cre-dependent termination of shABAT expression specifically in astrocytes. b, Immunostaining for GABA-T and GFAP in the control, general GABA-T KD and astrocytic GABA-T rescue groups. The GFP–Cre signal is localized in the nucleus, and the mCherry (mCh) signal indicates the expression of the shRNA. The magnified inset image shows the astrocyte indicated by the yellow arrowhead (inset scale bar, 20 μm). c, The violin plots comparing the average intensity of GABA-T staining in the GFAP+ areas among the three groups. d, A workflow illustrating the silencing of the GABA-T gene (either including or excluding astrocytes) in the dorsal hippocampal DG, followed by the brain slice preparation and whole-cell voltage-clamp recordings in GCs. e, The representative traces of GABAAR-mediated phasic and tonic GABA currents from the general GABA-T KD and astrocytic GABA-T rescue groups. f, Comparative bar graphs of the tonic GABA current (left), sIPSC amplitude (middle) and sIPSC frequency (right). sIPSCs recorded before the bicuculline (Bic) treatment were analyzed. n = 5 mice per group. The data are presented as the mean ± standard error of the mean. The individual dots refer to cells, unless otherwise specified. The P values were obtained via the Kruskal‒Wallis test for c and an unpaired t-test for f (left and middle), as well as a Mann‒Whitney test for f (right). ***P < 0.001, ****P < 0.0001; nonsignificant (ns) indicates a P > 0.05.
The overexpression of GABA-T in astrocytes reduces tonic inhibition in dentate GCs
We specifically overexpressed mouse ABAT (mABAT) in astrocytes by injecting AAV5-gfaABC1D-mABAT-2A-GFP into the dorsal hippocampal DG to further investigate the causal relationship between astrocytic GABA-T and tonic inhibition (Fig. 4a,b). This approach resulted in a 3.7-fold increase in GABA-T levels compared with those in the control (Supplementary Fig. 1b). Compared with basal levels of tonic inhibition, astrocytic mABAT overexpression reduced tonic inhibition in GCs (Fig. 4c,d). However, the amplitude and frequency of sIPSCs were unaltered by astrocytic mABAT overexpression (Fig. 4c,d). Collectively, these results reveal that astrocytic GABA-T strongly impacts the degradation of GABA, thereby playing an important role in regulating tonic inhibition.
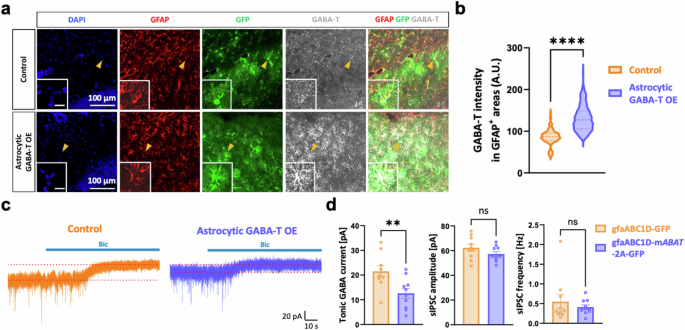
a, Immunostaining for GABA-T and GFAP in the control and astrocytic GABA-T-overexpressing (OE) groups. The GFP signal indicates the expression of the virus. The magnified inset image shows the astrocyte indicated by the yellow arrowhead (inset scale bar, 20 μm). b, Violin plots comparing the average intensity of GABA-T staining in GFAP+ areas between the two groups. c, Representative traces of GABAAR-mediated phasic and tonic GABA currents from the control and astrocytic GABA-T OE groups. d, Comparative bar graphs of the tonic GABA current (left), sIPSC amplitude (middle) and sIPSC frequency (right). sIPSCs recorded before the bicuculline (Bic) treatment were analyzed. n = 3 mice per group. The data are presented as the mean ± standard error of the mean. The individual dots refer to cells, unless otherwise specified. The P values were obtained via unpaired t-tests for d (left and middle) and Mann‒Whitney tests for b and d (right). **P < 0.01, ****P < 0.0001; nonsignificant (ns) indicates a P > 0.05.
Synaptic GABA spillover does not contribute primarily to the enhanced tonic inhibition observed upon GABA-T suppression in dentate GCs
An alternative possibility is that suppressing GABA-T in GABAergic neurons could enhance tonic inhibition through action-potential-dependent synaptic GABA spillover. We used TTX, an inhibitor of voltage-gated sodium channels that mediate action potentials, and measured TTX-sensitive and TTX-insensitive tonic GABA currents in dentate GCs following general GABA-T KD to explore this hypothesis. We observed a significant increase in TTX-insensitive tonic GABA currents in the general GABA-T KD group compared with the control group, whereas TTX-sensitive tonic GABA currents were not statistically different between the control and general GABA-T KD groups (Fig. 5a,b). Both the control and general GABA-T KD groups presented a reduced inhibitory postsynaptic current (IPSC) frequency after TTX treatment without a change in amplitude, but the reduction was significant in the general GABA-T KD group (Fig. 5c). In summary, these findings indicate that the enhanced tonic inhibition following general GABA-T KD is mainly action-potential independent.
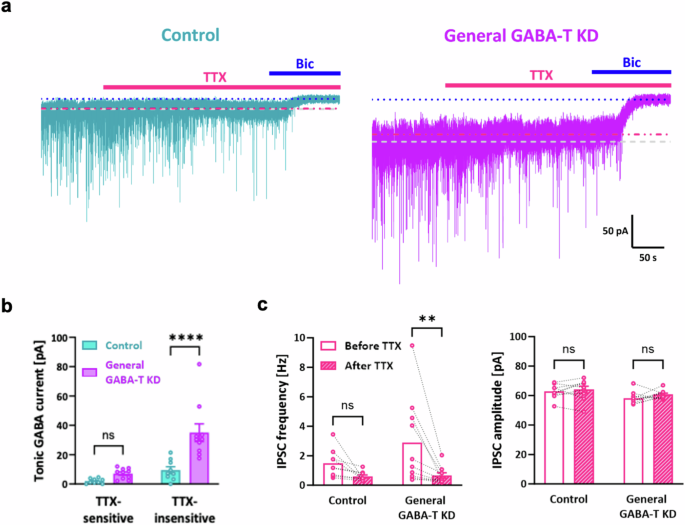
a, Representative traces of GABAAR-mediated phasic and tonic GABA currents from the control and general GABA-T KD groups treated with TTX and bicuculline (Bic). TTX-sensitive tonic GABA currents were measured by the baseline shift from the gray dotted line to the red dotted line. TTX-insensitive tonic GABA currents were measured by the baseline shift from the red dotted line to the blue dotted line. b, Bar graphs comparing TTX-sensitive and TTX-insensitive tonic GABA currents between the control and general GABA-T KD groups. n = 3 mice per group. c, Paired scatter plots showing the IPSC frequency (left) and IPSC amplitude (right) in the control and general GABA-T KD groups before and after TTX treatment. n = 3 mice per group. The data are presented as the mean ± standard error of the mean. The individual dots refer to cells, unless otherwise specified. The P values were obtained via two-way ANOVA (Šídák’s multiple comparisons test) for b and a two-way repeated-measures ANOVA (uncorrected Fisher’s LSD) for c. **P < 0.01, ****P < 0.0001; nonsignificant (ns) indicates a P > 0.05.
Suppressing astrocytic GABA-T impairs spatial long-term memory by reducing the spike probability of dentate GCs
We evaluated the probability of action potentials in response to electrical stimulation of perforant pathways to examine the effects of astrocytic GABA-T inhibition on synaptically elicited action-potential firing (Fig. 6a), as previously described10,22. This assessment was achieved by whole-cell current-clamp recordings of the dentate GCs of the mice injected with the viruses used for astrocyte-specific GABA-T manipulation within the dorsal DG (Fig. 6a). The spike probability was diminished in the GABA-T KD group compared with that in the control group (Fig. 6b,c). Interestingly, this reduction was fully reversed by blocking GABAARs or rescuing GABA-T specifically in astrocytes (Fig. 6b,c). These results indicate that astrocytic GABA-T suppression leads to increased tonic inhibition and a subsequent reduction in neuronal excitability and synaptic transmission.
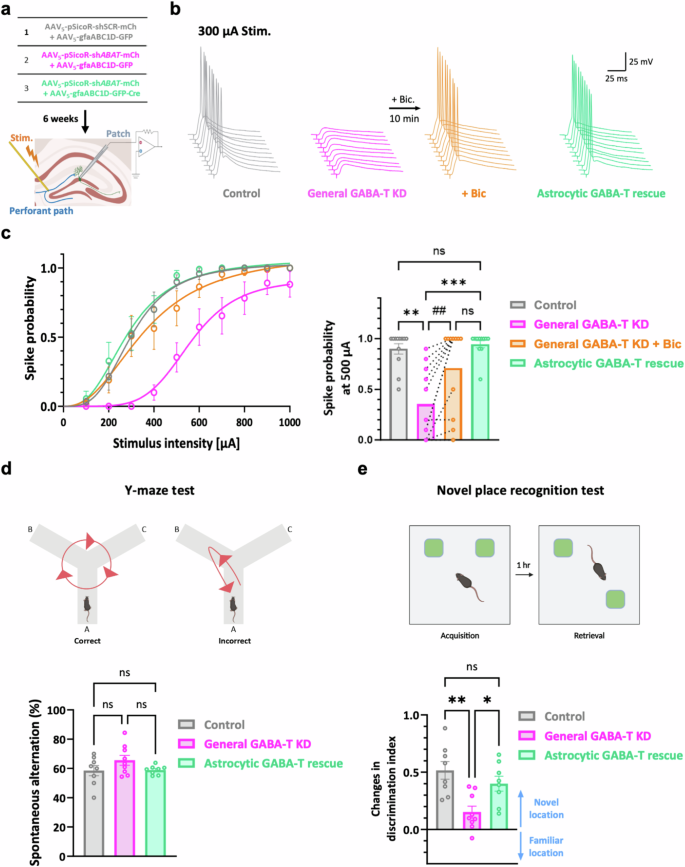
a, A workflow illustrating the silencing of the GABA-T gene (either including or excluding astrocytes) in the dorsal hippocampal DG, followed by measurements of the evoked spike probability. b, Representative traces of evoked excitatory postsynaptic potentials (EPSPs) in DG GCs at 300 μA electrical stimulation of the perforant path. c, Left: a summary graphs showing the spike probability versus the stimulus intensity. Right: a comparison of spike probabilities at 500 μA stimulation. n = 4 mice per group. d, Top: a schematic representation of the Y-maze test. Bottom: comparative bar graphs showing the percentage of spontaneous alternations. Each individual dot represents one animal. e, Top: a schematic representation of the novel place recognition test. Bottom: comparative bar graphs showing changes in the discrimination index. Each individual dot represents one animal. The data are presented as the mean ± standard error of the mean. The individual dots refer to cells, unless otherwise specified. The P values were obtained via the Kruskal‒Wallis test for c (right; for the comparison marked with #, a paired t-test was employed) and ordinary one-way ANOVA for d and e. *P < 0.05; **P < 0.01; ##P < 0.01; ***P < 0.001; nonsignificant (ns) indicates a P > 0.05.
We evaluated the changes in spatial memory-related behaviors resulting from genetic manipulations of GABA-T in the dorsal DG (Supplementary Fig. 2a,b) by performing a Y-maze test to assess spatial working memory and a novel place recognition test to assess spatial long-term memory 6 weeks after the virus injection. Spatial working memory, as evaluated by the spontaneous alternation task, was not affected by genetic GABA-T manipulations (Fig. 6d). This result implies that spatial working memory may not be sensitive to changes in tonic and phasic GABA-mediated inhibition within the dorsal DG. By contrast, the novel place recognition test revealed that the general KD of GABA-T impaired spatial long-term memory, as evidenced by a considerable decrease in the discrimination index (Fig. 6e). Importantly, this impairment was fully reversed by the astrocyte-specific rescue of GABA-T (Fig. 6e). These results suggest that the enhanced tonic inhibition as a consequence of astrocytic GABA-T suppression may negatively affect spatial long-term memory. Taken together, our findings emphasize that the inhibition of astrocytic GABA-T in the dorsal DG can critically modulate spatial long-term memory without noticeably influencing spatial working memory, revealing the selective impacts of astrocytic GABA-T on these distinct memory processes.
Discussion
Here, we described the causal relationship between the disruption of the astrocytic GABA degradation pathway and enhanced tonic inhibition. We found that suppressing GABA-T in astrocytes but not GABAergic neurons is an effective approach to increase tonic inhibition. Suppressing astrocytic GABA-T alone was sufficient to dampen the excitability of GCs in the dorsal DG and impair spatial long-term memory. Our study suggests that cognitive functions could be dynamically regulated by altering GABA clearance in the brain via astrocytic GABA-T.
While enzymes associated with the production of astrocytic GABA can control neuronal excitability, our findings reveal another notable and opposing mechanism in which the degradation of astrocytic GABA also plays a crucial role in regulating neuronal excitability. Mechanistically, tonic GABA release from astrocytes can reduce the membrane resistance of neurons through the prolonged opening of extrasynaptic GABAARs, thereby reducing the excitatory postsynaptic potential and neuronal excitability17,32. One approach to enhancing astrocytic tonic GABA release is the overexpression of astrocytic MAO-B13,27. However, this approach may also increase the amount of H2O2 as a byproduct of the MAO-B reaction, which might inadvertently result in neurodegeneration18. Our study proposes to address this issue by suppressing astrocytic GABA-T to increase astrocytic tonic GABA release without unwanted side effects such as increased H2O2 production.
Unlike physiological conditions, we used an internal solution with a high Cl− concentration to examine the effects of astrocytic GABA-T suppression on neuronal firing. Under these experimental conditions, the GABAA current reversal potential (EGABA) was depolarizing, rendering the baseline tonic GABAA conductance excitatory. However, as astrocytic GABA-T suppression substantially increased tonic GABAA conductance, the initial excitatory effect of depolarization appeared to eventually be overridden by inhibition55. This shift can be explained by shunting inhibition, whereby the increase in tonic GABAA conductance diminishes the effectiveness of excitatory inputs through increased membrane conductance. Consequently, astrocytic GABA-T suppression probably increases ambient GABA to levels where shunting inhibition dominates, even with a depolarizing EGABA, thereby decreasing the spike probability. This experimental setup underscores the robustness of shunting inhibition mediated by astrocytic GABA-T suppression in modulating neuronal excitability.
Interestingly, both GABA-T and SSADH, which are located in the mitochondria, exhibit higher mRNA expression in astrocytes than in other brain cells56,57,58. Given the augmented tonic inhibition observed in SSADH-knockout mice48,49, astrocytic GABA-T and astrocytic SSADH may have similar roles in modulating tonic inhibition. Thus, our findings with astrocytic GABA-T should provide a relevant framework for understanding the potential role of astrocytic SSADH. GABA needs to be taken up into the mitochondria to be metabolized by GABA-T and SSADH. However, the specific mechanism by which GABA is transported into the mitochondria is not yet clear. Assuming the presence of a GABA transporter within the mitochondrial membrane, the inhibition of this transporter could enhance astrocytic tonic GABA release. This exciting possibility warrants future investigations.
The importance of glial GABA-T in brain function has been highlighted in a sleep study using a Drosophila model, which revealed that a loss of glial GABA-T increases both the daily sleep duration and sleep consolidation, potentially through increased tonic GABA release from glial cells59. In terms of cognitive functions, we have shown that astrocytic GABA-T suppression in the dorsal DG impaired long-term spatial memory. However, spatial working memory was intact even after genetic GABA-T modulations. This pattern of cognitive effects is similar to the findings of previous studies, which reported that nectin-3 KD in the dorsal DG specifically disrupted long-term spatial memory without altering spatial working memory60,61. Spatial working memory may rely more on other brain regions, such as the medial prefrontal cortex (mPFC) and ventral hippocampus, which have been identified as crucial regions for the encoding of spatial working memory62,63,64,65,66. As the GABA-T KD was confined to the dorsal hippocampus in our study, it may not have impacted the functionality of the mPFC and ventral hippocampus, thereby leaving spatial working memory undamaged. However, further studies are needed to fully elucidate the distinct physiological roles of astrocytic GABA-T in other brain regions, including the mPFC and ventral hippocampus.
Changes in GABA-T expression levels have been explored in subjects with various neuropathological conditions. For example, pathological aggressive behavior in BALB/cJ mice is associated with a 40% reduction in 1H-MRS GABA levels and a 20-fold increase in ABAT expression in the ventral anterior cingulate cortex compared with those in BALB/cByJ mice67. Another study revealed that the mRNA expression of ABAT and ALDH5A1 was markedly decreased in the striatum, hippocampus and cerebellum of rats with depression induced by chronic unpredictable mild stress68. Investigating whether variations in astrocytic GABA-T expression levels contribute to these neuropsychiatric disorders could be enlightening, especially through targeted overexpression or gene silencing of GABA-T in astrocytes in different brain regions. Our research should provide insights into such pathogenic mechanisms.
Our AAV-based astrocytic GABA-T inhibition could be applied in a brain region-specific manner to address the imbalance between excitation and inhibition. However, the dual nature of astrocytic GABA-T inhibition must be considered. Although the inhibition of GABA-T in astrocytes shows promise in reducing neuronal excitability in the dorsal DG, our findings indicate a potential trade-off with spatial memory function. This paradox underscores the complexity of developing therapeutic strategies targeting astrocytic GABA-T. Therefore, carefully weighing the benefits of reduced neuronal excitability against the potential risks of side effects is essential.
Our findings indicate that targeted suppression of astrocytic GABA-T not only enhances tonic GABA release from astrocytes but also influences the excitatory/inhibitory balance in the brain, with consequential effects on behavior. These findings suggest that astrocytic GABA-T modulation holds promising potential for the development of novel therapeutic strategies aimed at treating cognitive and neurological disorders through the regulation of astrocytic GABA metabolism.

Responses