Symptomatic associations and sexual differences in depression and communication
Introduction
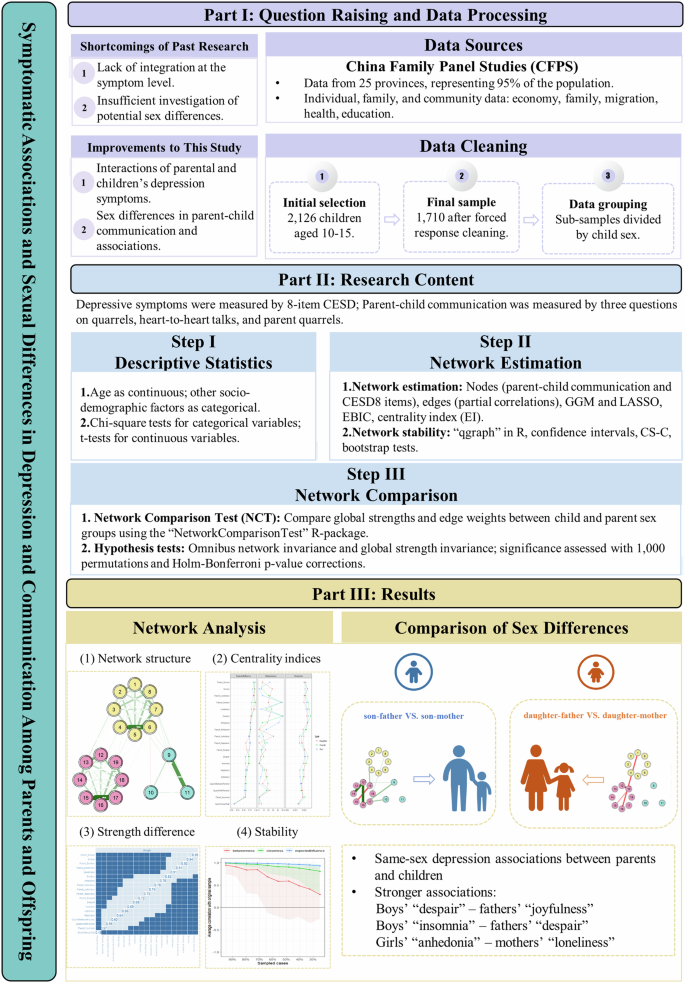
As a primary trigger for mental health disability globally, depression is a growing public health issue of concern among children and adolescents1,2,3, especially after the COVID-19 pandemic4,5. As an affective disorder, depression is often characterized by enduring sensations of sadness, disruption in sleep patterns, diminished interests in activities, and often encompasses thoughts of self-harm, which not only impairs the capacity for routine daily tasks6,7 but also can lead to academic underperformance7,8,9,10,11, further sleep disturbances, expensive treatment costs, cognitive dysfunctions12,13,14,15,16,17, and a high risk of suicide attempts or death18,19,20,21,22. The global point prevalence of elevated depressive symptoms among adolescents increased from 24% (95% CI: 0.19–0.28) between 2001 and 2010 and continued to increase to 37% (95% CI: 0.32–0.42) between 2011 and 202023. In China, there is an equal level of concern surrounding depression issue among children and adolescents. Several systematic reviews and meta-analyses reported the prevalence of depression among Chinese children and adolescents ranged from 19.85% to 24.3%24,25,26,27.
Previous studies have addressed the significant role of the quality of parent-child communication in influencing the emergence and persistence of depression in childhood and adolescence28,29,30. Within a family, parent-child communication encompasses easy self-disclosure, heartfelt conversations, mutual trust, and the occasional conflicts31. A series of studies have reported that poor parent-child communication is associated with the incidence of mental health symptoms in adolescents, such as depressive symptoms and suicidal ideation32,33,34. While high-quality parent-child communication could better deal with problems and developmental demands, which are negatively correlated with children’s depressive symptoms35. A systematic review examining depressive symptoms suggested that increased conflicts between parents leads to a higher risk of children developing depression36. Similarly, another meta-analysis reported that poor parent-child communication (r = 0.43) was highlighted as influencing depression among Chinese secondary school students37.
Furthermore, considering parents provide both the rearing environment and genes to offspring, as previous research has confirmed a positive association exists between parental and their subsequent offspring’s depression38,39,40,41. These multiple studies support the theory of intergenerational transmission of mental health issues. The transgenerational theory of depression relates to the work of Hammen42, who proposed that the evidence around parental depression concluded that children whose parents experience depression are more likely to experience it themselves, more so than other serious psychiatric disorders. This is related to the stress from depression, and parents lacking the coping mechanisms to pass along to their children when they are faced with their own experiences of stress, resulting in depressive symptoms. The theory has been applied to maternal depression, directly linking mother’s parenting style to offspring depression43,44, including a 20-year longitudinal study45. Furthermore, another meta-analysis from 16 studies between 2002 and 2020 suggested an association between paternal depression and an increased risk of offspring depression (OR = 1.42; 95% CI: 1.17–1.71), which provides robust longitudinal evidence supporting such correlation does exist over a relatively long term40.
Although significant progress has been made in the study of the relationships between parent-child communication and parental depression symptoms, and the relationships between parent-child communication and child depression symptoms, and the relationships between parental and child depression symptoms independently, there is still a lack of research analyzing the interplay and dynamic relationships between these three factors at the same time, especially considering the sex of the child in relation to the sex of the parent. Additionally, few studies have conducted a sex-based comparison of the different impacts of fathers and mothers on children, or how these influences from parents vary between boys and girls35,46. The lack of exploration in previous studies poses considerable challenges when trying to comprehensively understand and elucidate the impacts and mechanisms of how parent-child communication and parental depression symptoms affect child depression symptoms.
We employed a network analysis approach to investigate the dynamics between parent-child communication, parental and child depression symptoms, and to compare the variations in these patterns based on the sex of both parents and children47,48. This methodology enabled us to observe and predict the relationships and interaction patterns within these factors. In a network, each of these depressive symptoms and parent-child communication items constitutes a node correlated to others, and each edge between these nodes is viewed as the correlation between them, whose weight is defined by its partial correlation coefficient47. The centrality of each node is indicated by the expected influence (EI) index via which the most central items can be identified in a network49. Given its ability to capture and articulate the correlations and structures of various variables47,50, the network analysis method offers an innovative and comprehensive approach. It facilitates the exploration of the pivotal roles of specific elements, the connections between them, and the mutual dynamics within the context of parent-child communication, paternal depression symptoms, and child depression symptoms51. Moreover, it enables us to detect possible significant differences in network structures grouped by sex of parents and children, which might further provide fresh insights into how communication styles and depressive symptoms of fathers and mothers influence sons and daughters differently and would extend the theory of generational depressive symptoms.
This study aimed to examine the associations between depressive symptoms of parents and children and parent-child communication across different sex pairs of parents and children. Additionally, the second aim was to compare the results of different sex pairs to find the significant differences in network interactions. The objective was to retrospectively explore these associations using a national census and the network approach, for a comprehensive understanding of the social issue. It was hypothesized that (1) there are significant associations between parent-child communication and depressive symptoms of both parents and children and (2) these associations present different patterns across different sex pairs of parents and children.
Results
Descriptive statistics
The sociodemographic characteristics of the children are presented in Table 1. The age range was between 10 and 15 years (mean = 12.43, SD = 1.69). Of the 1710 valid child samples, 902 (52.74%) were male and 808 (47.26%) were female. Among the total sample, 801 (46.8%) children reported that they exercised monthly or less, 634 (37.1%) weekly, and 274 (16%) exercised daily or more. In terms of parental education, the χ2 analysis revealed no significant difference in the educational level of both fathers and mothers between male and female children. As for the distribution of annual family income per person, a significant majority, 56.6%, were below US$2487. Meanwhile, 22.0% of the samples fell into the range of US$2487 to US$3971, and a smaller portion, 10.7%, lay between US$3971 and US$6228 annually. Additionally, the annual family income per person showed no significant differences between male and female children as well, according to the χ2 analysis. Among all the sociodemographic variables included, only children’s exercise frequency demonstrated significant differences in child sex (p < 0.05). The flow chart demonstrates the sample selection and analysis process of this study (Fig. 1).
The sample selection and analysis process of this study.
Network structure
The network structure between child and parental depression symptoms and parent-child communication is displayed in Fig. 2 (left panel). In addition, the circular pie chart serves to demonstrate the predictability of the individual items. It is observed that the mean predictability for the nodes was 0.37, signifying that, on average, 37% of the variance in each node could be accounted for by its adjacent nodes. In the overall sample, a significant correlation was observed between parent-child communication and child depression symptoms. Parental arguments were positively correlated with children’s symptoms of “exertion”, “sorrow”, and “despair”. Furthermore, arguments between parents and children were positively correlated with children’s “anhedonia” and “exertion”, as well as “sorrow”. Parent-child heart-to-heart talks were positively correlated with children’s “joyfulness”, where the more frequent the talks, the happier the children were. Additionally, a correlation existed between parental depression symptoms and child depression symptoms: parents’ “exertion” was positively correlated with children feeling the same; parental feelings of being in “despair” positively correlated with similar feelings in their children; and parents’ symptoms of “happiness” positively correlated with their children’s “happiness.” Centrality indices of each node in the networks among three groups (all children, sons, and daughters with parents) are shown in Fig. 1 (right panel).
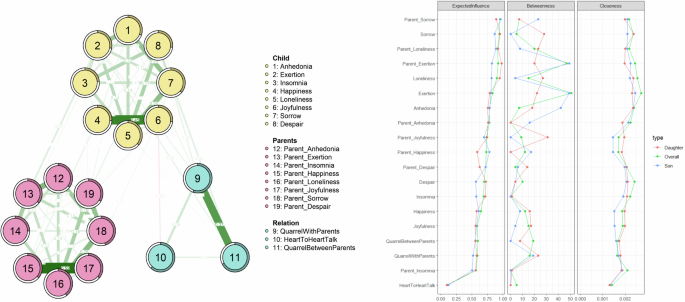
1-Anhedonia: “I felt depressed,” 2-Exertion: “I felt that everything I did was an effort,” 3-Insomnia: “My sleep was restless,” 4-Happiness: “I was happy,” 5-Loneliness: “I felt lonely,” 6-Joyfulness: “I enjoyed life,” 7-Sorrow: “I felt sad,” 8-Despair: “I could not get ‘going,’” 9-Quarrel with parents, 10-Heart-to-heart Talk between children and parents, 11-Quaeer between parents, 12-Parental Anhedonia: “I felt depressed,” 13-Parental Exertion: “I felt that everything I did was an effort,” 14-Parental Insomnia: “My sleep was restless,” 15-Parental Happiness: “I was happy,” 16-Parental Loneliness: “I felt lonely,” 17-Parental Joyfulness: “I enjoyed life,” 18-Parental Sorrow: “I felt sad,” 19-Parental Despair: “I could not get ‘going.’” In the depression-communication network structure, green and red edges represent positive and negative correlations, respectively.
The partial correlation between parent-child communication and parental and child depression symptoms are presented in Fig. 4 (top panel). When analyzing the children’s symptoms by sex, a different dynamic emerged in the relationship between parent-child communication and parental and child depression symptoms in boys and girls (Fig. 3 (1–3)). During parent-child communication, boys tended to self-report feeling “anhedonia”, while girls responded with feeling “exertion” and “sorrow”. Parents’ “happiness” positively correlated with the boys’ “happiness” and “joyfulness”, while parents’ “joyfulness” positively correlated with the girls’ “happiness”. Additionally, there was a positive correlation between parents’ having “insomnia” and girls experiencing the same symptom, as well as between parents’ “despair” and girls feeling “anhedonia”. Heart-to-heart talks between parents and children were only positively correlated with boys’ “joyfulness”. Furthermore, statistical tests from the network comparison showed significant differences in these relationships’ associations: specifically, there were stronger correlations between boys’ feelings of “anhedonia” and arguments with parents, between boys’ symptoms of “despair” and parents’ symptoms of “joyfulness”, as well as between boys’ feeling of “exertion” and parents’ “anhedonia”, when compared to girls. Conversely, a stronger association was observed between girls’ “happiness” and parents’ feeling of “joyfulness” when compared to the boys’ network (Fig. 3 (3)).
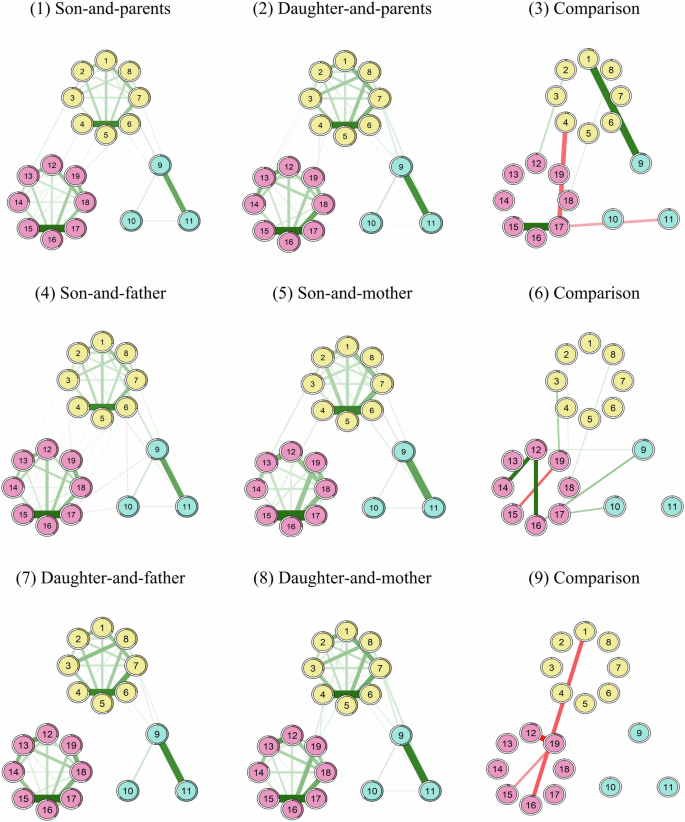
1-Anhedonia: “I felt depressed”, 2-Exertion: “I felt that everything I did was an effort”, 3-Insomnia: “My sleep was restless”, 4-Happiness: “I was happy”, 5-Loneliness: “I felt lonely”, 6-Joyfulness: “I enjoyed life”, 7-Sorrow: “I felt sad”, 8-Despair: “I could not get ‘going’”, 9-quarrel with parents; 10-Heart-to-heart Talk between children and parents, 11-Quaeer between parents, 12-Parental Anhedonia: “I felt depressed”, 13-Parental Exertion: “I felt that everything I did was an effort”, 14-Parental Insomnia: “My sleep was restless”, 15-Parental Happiness: “I was happy”, 16-Parental Loneliness: “I felt lonely”, 17-Parental Joyfulness: “I enjoyed life”, 18-Parental Sorrow: “I felt sad”, 19-Parental Despair: “I could not get ‘going’”. In the depression-communication network structure, green and red edges represent positive and negative correlations, respectively; In figures (3), (6), and (9), green edges indicate stronger connections in son-and-parent, son-and-father, and daughter-and-father compared to daughter-and-parent, son-and-mother, daughter-and-mother respectively. Red edges show weaker connections in the same comparisons.
Network stability and centrality
The application of the case-dropping subset bootstrap method revealed the consistency of EI metrics (Fig. 4 middle and bottom panel, Supplementary Fig. 3). The EI index demonstrated an excellent level of consistent stability across all of the network structures (CS-C = 0.75), while the levels of stability for betweenness (CS-C < 0.2) and closeness (CS-C ≈ 0.206) were inconsistent and less than optimal. Second, non-parametric methods were employed to estimate the confidence intervals (CIs) of the edge weights. The findings indicated that all network models exhibited an acceptable level of precision in their edges (Supplementary Fig. 1). Third, the outcome of the bootstrapping that tested for differences further indicated that several comparisons in edge weights across all network models were statistically significant (Supplementary Fig. 2).
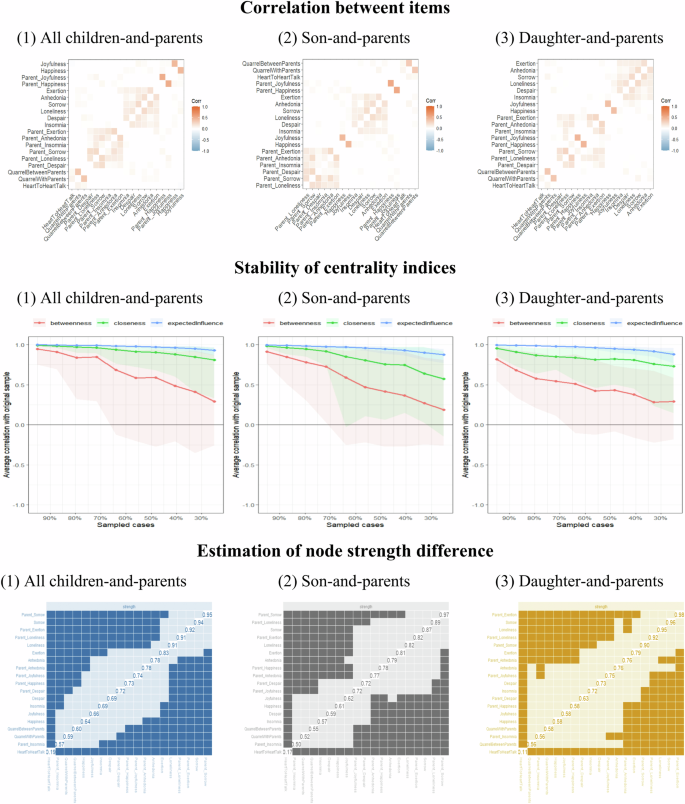
Correlation between parental and children’s symptoms and communication items; Stability of centrality indices and estimation of node strength difference among three groups (all children, sons, and daughters with parents).
Additionally, in order to examine whether our results could remain consistent under the influence of non-respondents, we employed the kNN-based imputation method, which has become a prevalent imputation technique and has been proven to be effective and reliable in various research fields52,53,54,55. After using a T-test to compare the results of network analysis on imputed samples with those on complete samples (Supplementary Table 1), it was ensured that there was no significant difference between these two samples (p > 0.05, Supplementary Table 1).
Moreover, we further studied the possible influence that the number of siblings might have on parent-child communication as a potential covariate. The analysis showed that the new network (Supplementary Fig. 7), incorporating this covariate, significantly correlated with our original network (rho = 0.71, p < 0.001), indicating that it did not have a significant effect on our results.
Network comparison between the influence of fathers and mothers on children
The network models comparing the influence of fathers’ and mothers’ symptoms on children were also analyzed. Although there was no significant statistical difference in the overall network strength, between the networks of parents with boys (p = 0.09, Supplementary Fig. 5) and parents with girls (p = 0.72, Supplementary Fig. 6), statistically significant differences were detected in the edge weights of the networks’ symptomatic influence on boys and girls (p < 0.05). In the differential results of parental influence on boys (Fig. 3(6)), boys’ symptoms of “despair” and fathers’ “joyfulness”, as well as boys’ self-reporting of “insomnia” and fathers’ symptoms of “despair”, both had stronger relationships when compared with mothers’ depressive symptoms. Additionally, parent-child heart-to-heart talks and fathers’ “happiness”/“despair”, and arguments with fathers were strongly associated with fathers’ symptoms of “loneliness”/“anhedonia”. However, when compared with fathers’ depressive symptoms, mothers’ “loneliness” had stronger associations with girls’ “anhedonia” and arguments with mothers resulted in a differential parental influence on girls (Fig. 3 (9)).
Discussion
This study, using network analysis, investigated the associations between parent-child communication and depressive symptoms in both children and their parents. Furthermore, the different dynamics of these associations, when grouped by sex of parents and children, were also explored. The results revealed that adversarial and negative forms of communication, such as parent-child arguments and arguments between parents, were positively correlated with children’s depressive symptoms. Second, positive communication through parent-child heart-to-heart talks was positively associated with children’s positive psychological well-being and life experiences. Third, there were same-sex depression associations between parents and children, such as boys’ “despair” and fathers’ “joyfulness,” boys’ “insomnia” and fathers’ “despair”, and girls’ “anhedonia” and mothers’ “loneliness”. These results have practical significance when analyzing the etiology of children’s depression from the perspectives of the familial environment and parent-child relationships, as well as in the prevention and intervention of child depression.
In general, depressive symptoms of children were found to be significantly correlated with parent-child communication and parental depression symptoms. Specifically, negative symptoms in parents were associated with similar states in children, and likewise, where positive symptoms in parents correlated with positive states in their children. As for the results of parent-child communication, the literature indicates that negative and confrontational communication, as well as positive communication between parents and children, are both associated with child depression symptoms. The outcomes of interactions between child depression and parental depression symptoms were consistent with previous empirical evidence that greater parental depressive symptoms are associated with higher risks of depression symptoms in children38,39,40,56,57. This study therefore supports the transgenerational theory of depression, where symptoms in parents also correlate with symptoms of depression in their children. To explain the interactions between parent-child depression symptoms, a systematic review of genetically informative literature reported reliable evidence of genetic transmission of depression from parent to child41. Besides genetic transmission, parental influences on children may be a result of both the shared environment via household parenting factors and, to a reduced degree, the unshared environment, through specific parent-child interactions41. Concurrently, prior research has indicated that within families where parents report depression, there is a higher incidence of conflicts and a noticeable decrease in unity, emotional expressiveness, and structure, associated with elevated stress and a lack of support, all of which contribute to the increased dysfunctional behavior observed in their children58,59.
Moreover, our results about parent-child communication also align with prior research findings in a Chinese migrant children study, where interparental conflict was positively related to depressive symptoms60. In the same study, the relationship was reported to be partially and serially mediated by parent-child communication and self‐esteem. In addition, earlier studies have also reported that positive parent-adolescent interactions, such as open communication, are positively associated with child outcomes, including adolescent’s self-esteem and educational success61 and negatively associated with a child’s problematic internet use, anxiety and depressive symptoms62,63, suggesting that positive family communication is crucial in reducing anxiety and depression in adolescents. Hence, an environment fostering open dialog is likely to positively influence the mental well-being of early adolescents, enabling them to comfortably engage in candid discussions of their thoughts and challenges with their parents and to utilize parental support as they acclimate to new experiences35. Another possible explanation for this mechanism supported by correlational analyses could be the significant negative association between child depressive symptoms and parental emotional availability29,64,65.
Simultaneously, results revealed significant sex differences in the associations between child and parental depressive symptoms, and parent-child communication. There were stronger correlations between boys’ feeling of “anhedonia” and arguments with parents, between boys’ symptoms of “despair” and parents’ “joyfulness”, as well as between boys’ feeling of “exertion” and parents’ “anhedonia”, when compared to girls. Conversely, a stronger association was observed between girls’ symptoms of “happiness” and parents’ “joyfulness” compared to boys. Notably, results from a near-term study indicated that the association between parental communication and adolescent depressive symptoms can be moderated by sex66, and showed relevant sex differences as well. Earlier research showed that boys tend to experience more negative feelings when communicating with their parents compared with girls, which leads to less communication with their parents to avoid punishment67,68. This is especially relevant in the context of Chinese parenting, which often emphasizes obedience of children, parental strictness, and harsh discipline69. Meanwhile, boys are encouraged to tackle difficulties independently when facing challenges, while girls are expected to seek support from parents to solve them70,71. However, there was a stronger correlation between girls’ happiness and parents’ joyfulness, which was consistent with previous studies. Although previous studies have suggested that daughters would be more strongly affected than sons by parental depression and/or its correlates (e.g., family functioning and problems in parent-offspring interaction), this study proved the specific association of depression symptoms between daughters and parents. First, females, including young girls, tend to be more sensitive and responsive to the emotional state of others including their parents72. According to biological studies, there are sex differences in neurotransmitter systems44, sex hormones73 and the structure of the brain regions involved in emotional processing23, which may lead to various effects among girls and boys. Second, girls are often encouraged to be more emotionally expressive and empathetic, which may lead to a greater impact on parental mental health72. Furthermore, according to attachment theory, girls may form stronger emotional bonds with their parents, which can result in a heightened influence of parental emotions on their emotional states74. These findings suggested the different associations of depressive symptoms between son-parent and daughter-parent, which is important for us to better understand this issue.
To investigate the distinct impacts of fathers’ and mothers’ depressive symptoms on boys and girls independently, we also conducted a network comparison analysis. The findings suggest that in parent-child relationships, the interactional impact is more pronounced within same-sex dyads. The results indicate that in the boys’ network, there was a stronger association between boys’ symptoms of “despair” and fathers’ “joyfulness”, as well as between boys’ “insomnia” and fathers’ “despair.” In the girls’ group, a more significant relationship was observed between girls’ symptoms of “anhedonia” and mothers’ “loneliness.” These patterns parallel the results of an earlier study that found father-child communication predicted depressive symptoms in boys, but not in girls75. Another previous study also found a similar mode, that communication between adolescent girls and their mothers, as well as between adolescent boys and their fathers, was respectively associated with a reduction in depressive symptoms as they transitioned into early adulthood76. Beyond that, results from a more recent study based on CEPS, also a nationally representative survey, further discovered that only positive paternal relationships predicted less depressive symptoms in Chinese boys, while mother-adolescent relationships had a significant impact on girls’ depressive symptoms, suggesting that fathers play more important roles in decreasing male adolescents’ depressive symptoms than mothers72. One possible explanation for this pattern is that male children tend to perceive a more positive interaction with their fathers than with their female counterparts, which could provide them with greater support in alleviating depressive symptoms77,78. Conversely, daughters were observed to express higher levels of intimacy and discuss personal matters more frequently with their mothers than fathers79,80,81. As mothers offer a range of support, including emotional solace and social backing, this can mitigate depressive symptoms in their daughters72,73,82. It is likely, then, that the mother-daughter relationship exerts a stronger influence on the emotional well-being of female children when compared to the father-daughter relationship83.
In Chinese culture, there may be more open communication about emotions and personal struggles within same-sex parent-child relationships, leading to a greater sharing of depressive symptoms35. At the same time, sons often identify with their fathers and daughters with their mothers, adopting their behaviors, attitudes, and emotional responses. This identification can lead to a stronger correlation in depressive symptoms between them. Furthermore, there may be specific expectations placed on fathers and sons or mothers and daughters that can lead to shared stressors and emotional responses. Moreover, hormonal and neurobiological factors that influence mood regulation may be similar between fathers and sons or mothers and daughters, potentially leading to a stronger relationship in depressive symptoms when they share the same environment or stressors44. It is important to note that these factors can interact in complex ways, and the relationship between depressive symptoms in parent-child dyads can be influenced by a multitude of individual, familial, and environmental factors. Additionally, cultural context plays a significant role, and the dynamics within father-son and mother-daughter relationships can vary greatly across different societies and communities23.
This study applied network analysis to explore the associations between parent-child communication and depressive symptoms in both parents and children. While traditional path analysis provides clear statistical inference about the significance of individual paths, network analysis focuses more on the overall structure and strength of connections47,84. Compared with traditional path analysis, network analysis is based on the Gaussian model to explore the potential associations between psychopathological symptoms and variables, providing a comprehensive view of the entire system85. This method could capture vital correlations between these variables, which is helpful for target prevention and intervention. Moreover, it is useful for comparing the differences in network structure among various groups, which could improve understanding of these psychological disorders86. In summary, network analysis offers a more flexible and comprehensive approach to understanding complex systems with interrelated variables.
Although this study is innovative in applying network analysis to explore the topic, there remain a few limitations to be noted. Given that this study only adopted the cross-sectional data from the 2020 census of the CFPS database, the longitudinal dynamics of the relationship patterns among parent-child communication and depression of parents and children should be a point for further investigations using longitudinal analysis methods that follow the specific participants over time, as the current census does not allow for participants to be identified if they took a previous census. Additionally, considering the self-report nature of the CESD, it cannot be used as an isolated diagnostic measure of depression87, which requires further research based on a clinically diagnosed population. Moreover, the variables selected for parent-child communication in this study are limited and may not comprehensively and systematically reflect the specific aspects of parent-child communication. Other covariates, such as the marital status of parents and the number of cohabited family members that may influence the parent-child communication, were not examined in our study due to missing samples and variables in the dataset, remain unknown and to be further studied. Furthermore, although previous studies have investigated psychiatric symptoms with network analysis and found interesting results (Grygiel et al., 2024; Jin et al., 2024; Li et al., 2024), several limitations of this method should be considered. First, if each item within a scale is intended to measure a distinct aspect of a broader concept, isolating them in network analysis may be appropriate. This allows for the examination of how different facets of the concept relate to each other and other variables in the network. However, if these items are not appropriate to be isolated, it would cause bias to some extent. Second, if the items within a scale are assumed to be homogeneous and measure the same underlying construct, it might be reasonable to represent them collectively in the network. However, this assumption should be empirically tested, for example, through factor analysis. Based on the current findings, it is proposed that future research should further explore the causal models of parent-child communication and depression symptoms of parents and children to introduce a more comprehensive and systematic set of variables to depict the modes of parent-child communication.
In conclusion, this network analysis, for the first time, revealed associations between parent-child communication and depressive symptoms in both parents and children. Moreover, significant sex differences in these associations were observed among parents and children’s networks, and the same-sex dyad of parents and children had stronger interactional associations. Therefore, it is recommended to consider parent-child communication factors when preventing or intervening in cases of child depression when identified in clinical practice. Furthermore, when child depression is identified, the focus should be on improving communication between the child and parent to buffer against depressive symptoms.
Methods
Participants
The total samples were derived from the 2020 database of the China Family Panel Studies (CFPS) census, a comprehensive, longitudinal, and mostly nationwide social survey focusing on various social phenomena in contemporary China, initiated and managed by the Institute of Social Science Survey (ISSS) at Peking University. As a biennial survey, CFPS encompasses 25 out of the 31 provinces and autonomous regions in China, representing approximately 95% of the national population. It aims to gather data at the individual, family, and community levels, particularly in areas such as economic activities, family background, migration, health, and education88. The 2020 episode of the CPFS survey was conducted from July to December 2020. Before participating in the CFPS survey, each subject in this study executed a documented informed consent agreement. The ethical sanction for conducting the survey was granted by the Biomedical Ethics Review Committee of Peking University, under the approval code IRB00001052–14010. It is affirmed that all procedures in this study adhered to pertinent norms and directives.
The initial sample selection comprised children aged 10 to 15 years from a total of 28,530 samples, of which 2126 participants met the inclusion criteria. However, the final sample size was reduced to 1710 following data cleaning based on the need for a forced response to all variables from the Center for Epidemiological Studies’ Depression Scale (CESD) and parent-child communication items. The remaining sub-samples were divided into two groups based on child sex.
The sociodemographic characteristics were divided into individual attributes and family background. Individual attributes for parents and children included age and sex. Exercise frequency of children only was also collected as an individual attribute. Family background encompassed the annual family income (per person), the educational attainment and the age distribution of their parents. Notably, all missing, invalid, or inapplicable values of these sociodemographic variables were uniformly relabeled as ‘Unknown’ in the data that consisted of 1710 children and their parents.
Depression
The assessment of children’s and parents’ depression symptoms in CFPS was the Center for Epidemiological Studies’ Depression Scale (CESD), a scale established by Radloff89 in 1977, which remains among the most prevalent self-assessment methods for evaluating an individual’s mental health status. Specifically, in the 2020 database of the CFPS, the CESD-8 version of this scale was adopted, comprising 8 original items with each rated on a four-point Likert scale (“Rarely,” “Little,” “Occasionally” and “Most”), this included: (1) Anhedonia (“I felt depressed”); (2) Exertion (“I felt that everything I did was an effort”); (3) Insomnia (“My sleep was restless”); (4) Happiness (“I was happy”); (5) Loneliness (“I felt lonely”); (6) Joyfulness (“I enjoyed life”); (7) Sorrow (“I felt sad”); and (8) Despair (“I could not get ‘going’”). Additionally, the scores for the items “Happiness” and “Joyfulness” were reversed in our analysis. This reversal aligns the scoring interpretation of these two items with the other six items, ensuring consistency in the scale’s meaning: higher scores indicate a greater tendency towards depression. The reliability and internal consistency of the CESD scale were demonstrated by its Cronbach’s alpha score of 0.775, indicating its reliability90. The effectiveness of CESD in China has also been validated91,92, making it a common instrument for gauging depression among Chinese populations93.
Parent-child communication
The measurement of parent-child communication in our study is described by three single items recorded in the CFPS-2020 database: the frequency of quarrels between children and parents in the last month (times per month), the frequency of heart-to-heart talks between children and parents in the last month (times per month), and the number of quarrels between parents in the past month (times per month). In our analysis, we converted these three variables into binary (0-1) variables based on whether their values were greater than zero. Therefore, if the frequency of quarrels between children and parents, the frequency of heart-to-heart talks between children and parents, and the number of quarrels between parents equalled to zero, these variables would be converted to “0.” If the three variables were larger than zero, they would be converted to “1.”
Descriptive analysis
Variable “age” was treated as a continuous variable, while the remaining sociodemographic factors were categorized as discrete, and divided into two or more categories. For the analysis, categorical variables were examined using Chi-square tests, whereas continuous variables were evaluated using independent-sample t-tests. This approach was employed to explore the variations between male and female children. Statistical significance was set at 0.05 based on two-tailed tests.
Network estimation
In the network analysis, each measurement of parent-child communication and items of the CESD-8 scale were defined as a “node” and the relationships among these items were “edges.” Network models, based on partial correlations, were utilized to examine the relationships between parent-child interactions and depressive symptoms in both children and their parents. The construction of these network models employed the Graphical Gaussian Model (GGM) in conjunction with the graphical least absolute shrinkage and selection operator (LASSO). The selection of model parameters was guided by the Extended Bayesian Information Criterion (EBIC). In this network, the one-step expected influence (EI) of each node was the primary centrality index to identify important items or symptoms, which was calculated as the aggregate of the weights of all its direct connections, encompassing both positive and negative associations94. A higher EI value for a node indicates that the node holds a higher centrality in the network. It is important to note that the nature of the connections (negative or positive partial correlations) between nodes was taken into account while computing the EI. Specifically, for a weighted network with (n) nodes, the one-step EI of node (i) is calculated as:
where ({w}_{{ik}}) stands for the weight of edge that connects nodes (i) and (k). ({w}_{{ik}}=0) when there is no edge between nodes (i) and (k). The analyses were conducted using the “qgraph” package in R47,85. To evaluate the reliability and robustness of the network model, confidence intervals (CIs)95, the correlation stability coefficient (CS-C)47,96, and bootstrapped difference tests were applied84.
Specifically, the process first executed 1000 bootstrap iterations for each estimated network, facilitating the generation of a 95% confidence interval (CI) for every edge weight within the network (a tighter confidence interval indicated a more precise estimation of edge weight). Subsequently, bootstrapped difference tests were carried out for comparisons of interested edges, which involved calculating the difference between the bootstrap values of two distinct edge weights and then forming a bootstrapped CI around these difference scores84. The significance of the discrepancy between the weights of the two edges was implied if the bootstrapped CI did not include zero. Additionally, case-dropping subset bootstrap, including a total of 1000 bootstrap iterations for each network, was applied to assess the stability of centrality indices, where different fractions of cases or individuals were randomly dropped from the complete dataset, and the network models were recalculated based on these reduced subsets. In each iteration, the CS-coefficients were used to compare the centrality indices from the subsets with the original indices. It indicates the maximum percentage of cases that can be removed while still achieving a correlation of at least 0.70 between the centrality indices calculated from the subsets and the original ones with 95% probability. Subsequently, the average value of CS-coefficients obtained from each bootstrap iteration was calculated. A high mean CS-coefficient is indicative of considerable stability in the centrality indices. To ensure dependable interpretability, it is recommended that the average CS-coefficient of a centrality index should not fall below 0.25, and ideally, it should exceed 0.5084.
Network comparison
To investigate the presence of differences in network characteristics based on the sex of children and parents, we tested whether the global strengths and edge weights in the networks of children’s sex and parents’ sex groups were significantly different. This analysis employed the Network Comparison Test (NCT), a permutation-based test designed to evaluate disparities between two networks, which was conducted using version 2.2.2 of the “NetworkComparisonTest” R-package86,94, where test statistics are used for comparing a pair of networks were defined. These statistics focused on two primary network attributes: global strength and edge weight. Specifically, for a pair of networks (a) and (b),
where ({w}_{{ij}}^{a}) and ({w}_{{ij}}^{b}) stands for the weight of the edge connecting nodes (i) and (j) in network (a) and (b) respectively. Two hypothesis tests were performed for each network pair comparison: (1) an omnibus network invariance test, with the null hypothesis ({H}_{0}:M=0), positing the equality of all corresponding edges in both networks. (2) A global strength invariance test, with the null hypothesis ({H}_{0}:S=0), suggesting identical overall connectivity in both networks. The test statistics derived from the estimated networks were contrasted against the distributions of corresponding values generated from 1000 permutations under the null hypothesis94. A p-value greater than 0.05 in either test would imply that no significant differences were detected in the strengths of corresponding edges or in the overall connectivity of the two networks, which would uphold the null hypothesis. The strength differences per edge across the networks were also compared, adjusting for multiple comparisons by applying the Holm-Bonferroni method for p-value corrections.
Responses