Systematic quantification of hydrogen in pipeline steel by atom probe tomography after ambient charging and transfer

Introduction
Hydrogen (H), as a carbon-free energy carrier, holds significant potential for global decarbonisation1,2. Storage and transportation of H is crucial to the emerging H economy, and utilising established gas pipeline networks is a potentially cost-effective strategy for both large-scale storage and transmission of H3,4. Unfortunately, high-strength steel pipelines are substantially challenged by the risk of hydrogen embrittlement (HE), which can greatly reduce material ductility, potentially leading to catastrophic structural failure of components that could cause unpredictable and premature failure under operational conditions5,6,7,8. Thus, HE becomes an inevitable concern when steel pipelines are exposed to high-pressure H gas or to sour gas containing hydrogen sulphide (H2S), which leads to H generation through acidic corrosion of steel9,10. Additionally, the exterior of pipeline steel may suffer due to H produced electrochemically under cathodic protection via application of cathodic polarisation11. Thus, these issues motivate thorough understanding of the relationship between the distribution of atomic H and the HE mechanisms that affect the susceptibility of pipeline steels, before injecting H into the pipeline networks.
The HE phenomenon was identified over a century ago12; however, despite the various models proposed, there remains a lack of consensus regarding the underlying mechanisms of embrittlement7,13. Numerous microstructural features, including dislocations, grain boundaries, and precipitates, have been reported to serve as potential H trapping sites14,15,16,17,18, with embrittlement intensifying as H content increases. To understand HE of pipeline steel, laboratory-based H charging is usually performed, often through either electrochemical or gas phase methods19,20,21, though plasma-based H implantation has also been studied22,23. Due to strict safety protocols associated with gaseous H charging (especially at high pressure)24, majority of H-related studies have been conducted using electrochemical charging. Detailed characterisation is necessary to reveal the distribution of H and its behaviour within the microstructure and various approaches have been employed, such as scanning electron microscopy (SEM)25,26, transmission electron microscop27,28,29, secondary ion mass spectroscopy30,31,32, silver reduction and decoration33,34, and scanning Kelvin probe force microscopy35,36. Additionally, thermal desorption spectroscopy offers quantitative measurement of bulk H content, providing insight into the interaction of H within the microstructure37,38. However, all these characterisation methods are limited by spatial resolution and cannot precisely locate individual H atoms in three dimensions (3D).
Direct 3D observation and quantification of H at the atomic scale is possible with atom probe tomography (APT)39,40,41. However, the presence of residual H2 in the ultra-high vacuum analysis chamber of the atom probe instrument can obscure the detection of H coming from the specimen itself42,43,44. The nature of the method of specimen preparation, either by electrochemical polishing or in-situ focussed ion beam (FIB) milling21,45,46, will also influence the situation, as well as the nature of material itself47. These aspects make it difficult to distinguish the origin of the H signal and whether it is truly from the specimen, or whether it comes from either field ionisation of the residual gas in the analysis chamber that has adsorbed onto the specimen surface or was introduced during specimen preparation.
One alternative approach commonly used to mitigate this issue is to charge APT specimens with deuterium (D) as a proxy instead of H, as D has a relatively low isotopic abundance and has been used in several previous studies16,21,45,48,49,50,51,52. Due to the mass-to-charge overlap of the 1H2+ and D (2H+) signals in the time-of-flight mass spectrum, voltage mode acquisition is preferable over laser mode to minimise interference45,53,54. The laser is a pulse of thermal energy that reduces the barrier for field evaporation under lower electrostatic field conditions generated only from the applied standing voltage. As atoms (ions) are removed from the specimen tip by the process of field evaporation, the tip radius increases, and the applied standing voltage is increased to maintain the electrostatic field required for a set detection rate at constant laser pulse energy (given the direct relationship between field from the applied voltage and specimen tip radius40). In laser-pulsed APT, however, there is reduced propensity for post-ionisation of field evaporated residual H2 gas in the (albeit ultra-high) vacuum chamber, as compared to voltage pulsing. In other words, field-induced dissociation (following: ({{H}_{2}}^{2+}to {H}^{+}+{H}^{+})) is less common with laser pulsing and the field-evaporated H2 gas is singly ionised and detected at a mass-to-charge ratio of 2 Da. As explained above, this signal interferes with field-evaporated deuterium (2H+) and creates the problem of peak overlap in the APT mass spectrum. For voltage pulsing, on the other hand, where the probability for field evaporation to occur is raised above the threshold by increasing the total electrostatic field (from the applied standing voltage + pulse voltage), the challenge is that each pulse imparts an electrostatic pressure (Maxwell stress55,56) that has the potential to breach the mechanical strength of the material, especially at cryogenic temperature, such that the specimen may fracture/fail if it is brittle (or embrittled).
Evaporation rate, pulse frequency, and electrostatic field intensity are also other factors that influence H detection in APT, where higher rates and frequencies can reduce the noise from background H by accelerating ion evaporation and reducing residual H adsorption42,43. Furthermore, optimised workflows (specimen preparation, H/D charging, and transfer) have also been identified21,45,46, where cryogenic vacuum transfer was most often involved. In these scenarios specimens are immediately cryogenically cooled after H/D charging53,57, but this will likely ‘cryo-fix’ both trapped and un-trapped (diffusible) H/D within the specimen and the total H/D content may not represent that intended or expected for in-service conditions of real applications.
In this work, we have investigated a typical X65 steel commonly encountered in the gas pipeline industry. To address the abovementioned issues, quantitative APT measurements of H/D concentration in the specimen (microstructure features, bulk/whole and matrix) after ambient temperature charging (electrochemical) and transfer have been statistically compared with the uncharged condition on the premise that the difference should represent trapped H/D. A series of workflows have been designed with different specimen preparation processes (electropolishing and FIB lift-out) and H/D charging conditions (different electrolytes and charging potentials), where it is expected that diffusible H will have already escaped from the specimens58.
Results and discussion
Experimental workflows for H and D charging and atom probing
Taking inspiration from Breen et al. 45, a series of workflows were developed varying the sample preparation and charging conditions (electrolyte, potential and duration), each involving a quick transfer from the APT load-lock chamber to analysis chamber (<15 min), where subsequent APT experiments were conducted in voltage mode (W1-W6). These workflows, are presented in Fig. 1 and elaborated below:

(Note: specimens for W3 – W6 were all electrochemically charged for 5 min, except W5).
Workflow 1 (W1): Electropolished specimens were directly loaded into the APT load-lock chamber, quickly transferred to the analysis chamber, and the APT experiment was run in voltage mode.
Workflow 2 (W2): FIB-prepared specimen was directly loaded into the load-lock chamber, quickly transferred to the analysis chamber, and the APT experiment was run in voltage mode.
Workflow 3 (W3): Electropolished specimens were electrochemically charged in an acidic electrolyte (H2O + H2SO4) for 5 min across a series of experiments with varied charging potential (−1.2 V, −1.7 V).
Workflow 4 (W4): Electropolished specimens were electrochemically charged in a solution containing thiourea, either an alkaline electrolyte (H2O + 0.1 M NaOH + 0.5 g/L thiourea) at −2.2 V or an acidic electrolyte (H2O + 0.05 M H2SO4 + 0.5 g/L thiourea) at −1.7 V for 5 min. Thiourea (CH4N2S) has been used as a ‘poison’ to prevent recombination of atomic H (liberated by the H evolution reaction) into molecular H2 gas during charging in the electrolyte, which enhances the atomic H uptake during the electrochemical charging process59.
Workflow 5 (W5): Electropolished specimens were electrochemically charged in an alkaline electrolyte (H2O + NaOH) across a series of experiments with varied charging potentials (−1.2 V, −1.7 V, −2.2 V) and durations (5 min, 30 min and 1 h, at −2.2 V).
Workflow 6 (W6): Electropolished specimens were electrochemically charged in an alkaline electrolyte with heavy/deuterated water (D2O + NaOH) for 5 min across a series of experiments with varied charging potentials (−1.2 V, −1.7 V, −2.2 V).
In addition to that described in the workflows above, other charging parameters were also attempted, but only the optimised range of parameters have been reported for the purpose of revealing the H/D absorption and APT field evaporation behaviour of specimens under ambient charging and transfer conditions. It is noteworthy that low concentration acidic charging (0.05 M H2SO4) did not result in any noticeable damage or corrosion to the APT specimens, which can be attributed to the cathodic protection of the working electrode during H charging. Furthermore, several experiments involving high-concentration acidic charging (0.5 M H2SO4) were also conducted, all of which led to specimen dissolution. Specimens from W1 were used as a reference for the un-charged condition, for relative comparison with H/D charging.
APT mass spectra for uncharged, H-charged, and D-charged specimens
Representative mass spectra from atom probe experiments of uncharged, H-charged, and D-charged specimens are shown in Fig. 2. Further examples are given in the supplementary information (Supplementary Figs. 1, 2 and 3). The frequency of counts in these spectra have been normalised for direct comparison. The H signal was consistently detected across all datasets collected from W1 to W6, observed as the distinct peak at the mass-to-charge ratio (m/z) = 1 Dalton (Da) in the form of atomic 1H+, even in the uncharged specimen (W1). Notwithstanding the limits of understanding about the origin of this signal47, this is well-known to occur because of the influence of electrostatic field. Under the condition of same carbon content, H-charged specimens exhibited consistently higher normalised counts of H+ at 1 Da (up to 4 times greater than the uncharged/electropolished specimen), which is attributed to H-charging. For the D-charged specimens, an additional peak at 2 Da was observed that was not present in either uncharged or H-charged specimens. Since residual H was only expected to be detected as a single-charge ion using voltage pulsing, the peak at 2 Da is attributed to D+ with certainty. This therefore validates successful D-charging, ambient transfer and detection of D as 2H+ using voltage pulsing mode, similar to Haley et al. 60, and the D:H ratio was determined to be 0.2. It indicates that D-charging is an effective approach for APT analysis of X65 steel to mitigate peak overlap caused by ‘background’ H that was not specifically introduced into the specimen by charging. Figure 2 also shows peaks related to oxides, namely O+ (16 Da), FeO2+ (36 Da), FeO22+ (44 Da) and FeO+ (72 Da), which were observed in the mass spectra from both H-charged and D-charged specimens. This suggests an oxide layer may have formed on the needle surface during electrochemical charging, which may trap H/D and affect the assessment of H/D61.

Normalised APT mass spectra for uncharged, H-charged, and D-charged specimens.
H/D distribution measured for uncharged, H-charged, and D-charged specimens
Figure 3a, b display APT analyses of H distribution in an uncharged specimen containing cementite with a carbon concentration consistent with the stoichiometric (Fe3C) value of around 25 at.%. Notably, the 1D composition profile shows distinct segregation of H, up to 3 at.%, within the cementite phase. Figure 3d reveals H segregation at a grain boundary (GB), which was identified as such due to the variation in location of low-density crystallographic poles at positions 1 and 2 (Fig. 3c), above and below the boundary, which is taken as evidence of the change in crystallographic orientation. Proximity histogram analysis62,63 based on the 1 at.% C iso-concentration surface (Fig. 3e) shows an increased H concentration, from 0.05 at.% up to 0.10 at.%, within the GB. These observations, that carbon enriched microstructural features in steel correlate with a marginal increase in H (and D) concentration, have been variously reported in the literature41,45,46,48,50,51,64,65,66,67,68,69,70,71,72 but a generalised explanation has yet to be established. For Ti-Mo carbides, the H/D trapping behaviour has been attributed to microstructural accommodation via carbon vacancies72. Crystalline defects have also been inferred as responsible for H trapping at decomposed cementite, however, a relationship between the local electrostatic field and H concentration was also quantitatively determined45. Therefore, the influence of the electrostatic field on the detection of H in relation to the spatial location of C cannot be ignored and deserves further attention. This relationship is likely due to the fact that the evaporation field of C is relatively high73, which means that as surface atoms are progressively field evaporated as ions during an atom probe experiment, C atoms require a relatively higher evaporation field compared to surrounding atoms. Until this condition is met, C atoms are retained on the specimen tip surface and the increasing local electrostatic field could either directly attract ‘background H2’ residual in the vacuum chamber and/or cause attraction by surface migration induced by the field gradient74, such that H and C are eventually field evaporated with spatial correlation. This relationship is observed in Supplementary Fig. 4a, c.
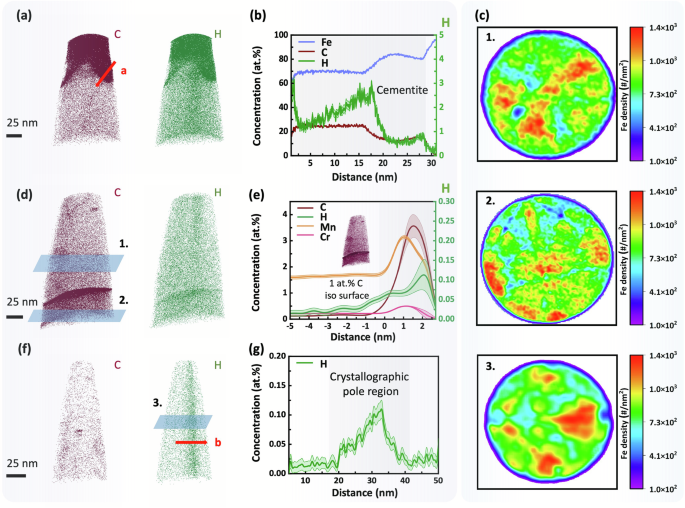
a 3D elemental maps of C and H in a specimen containing cementite. b 1D concentration profile in the direction of the arrow shown in (a). c 2D concentration maps of Fe taken at positions 1 and 2 shown in (d), and position 3 shown in (f). d 3D elemental maps of C and H within a specimen containing a grain boundary. e Proximity histogram taken from a 1 at.% C iso-concentration surface. f 3D elemental maps of C and H in a specimen with a prominent crystallographic pole. g 1D concentration profile in the direction of the arrow shown in (f).
In the current work, H segregation was also observed in uncharged specimens without carbon-enriched regions, as shown in Fig. 3f. The 2D density map of Fe at position 3 in Fig. 3c reveals that the low-density region on the right-hand side of the map, which indicates a crystallographic pole from the BCC ferrite lattice, is correlated with the location of H segregation (Fig. 3f) in the reconstructed atom probe data. The H concentration measured up to 0.11 at.% within in this region, as indicated in Fig. 3g. Partitioning of solutes in relation to the crystallography of the specimen is well-known to occur in APT due to electrostatic field enhancement at atomic terraces, especially around low-order crystallographic poles that have larger lattice spacing, which can lead to trajectory aberrations (also known as local magnification)62 and field-induced surface atom migration74,75.
To contrast with the uncharged specimens shown in Fig. 3, we now present APT data from H/D-charged specimens that contain cementite and GB in Fig. 4. For cementite, Fig. 4a shows the analysis of a carbon-enriched region from a H-charged specimen. The 1D composition profile follows the direction of arrow a, which indicates another cementite boundary with a carbon concentration of approximately 25 at.% (consistent with Fig. 3a), and H segregation of up to 3.5 at.% compared with the ferrite matrix containing only 0.05 at.% H. This result is similar to that for cementite from the uncharged specimen (Fig. 3a, b) and cannot be relied upon as concrete evidence of successful H charging because the H could have originated from other sources (e.g., residual H2 gas in the APT analysis chamber).
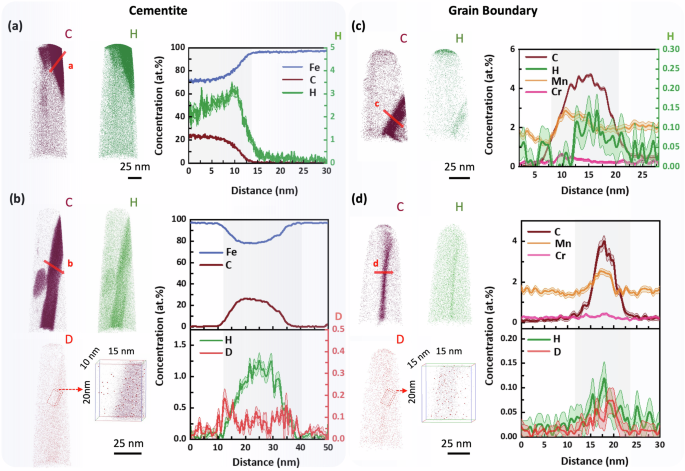
3D elemental maps of C, H, and D in H-charged and D-charged specimens containing cementite, with composition profiles along arrows (a, b). 3D elemental maps of C, H, and D in H-charged and D-charged specimens containing grain boundaries, with composition profiles along arrows (c, d).
Figure 4b shows APT data of cementite from a D-charged specimen, with a 1D composition profile corresponding to the direction of arrow b. Consistent with Fig. 4a, there is H enrichment measured inside the cementite plate but with a slightly lower concentration of about 1 at.% (compared to 2–3 at.% after H-charging, Fig. 4b). This D-charged specimen exhibits ~0.2 at.% D enrichment in cementite, where the D segregation is more clearly shown in the magnified region of interest from the 3D map in Fig. 4b. The partitioning of D to the cementite plate confirms effective D-charging utilising ambient transfer conditions.
Figure 4c presents APT data of a GB from an H-charged specimen, with a 1D composition profile corresponding to the direction of arrow c. Similar to the findings in cementite, H enrichment is also observed within the GB, with the concentration reaching up to about 0.15 at.%. Additionally, the D-charged specimen shows approximately 0.07 at.% D enrichment at the GB, which is more distinctly seen in the magnified region of the 3D map. This D segregation within the GB further confirms the success of D-charging utilising ambient transfer conditions and is consistent with the result reported in Figure 8a by Breen et al. 45.
Given that H segregation can be observed by APT in both uncharged (Fig. 3) and H/D-charged (Fig. 4) specimens, and the segregation characteristics of other elements (Mn, Cr) were consistent (further examples are shown in the supplementary information: Supplementary Figs. 5 to 10), we now systematically assess the measurement of H/D concentration associated with carbon-rich microstructural features to better understand their influence on the HE behaviour of X65 pipeline steel. In this regard, the concentrations of H and D at random grain boundaries and within cementite were determined from proximity histograms based on carbon iso-concentration surfaces, as shown in the plots presented in Fig. 5. For cementite (Fig. 5a), variations in H concentration revealed that H-charged specimens (mean = 2.20 at.%) showed significant difference from uncharged (mean = 1.85 at.%) and D-charged (mean = 1.83 at.%) specimens, but there was no notable difference in the H concentration between uncharged and D-charged. The D concentration measured in the D-charged specimens was about 0.043 at.%.
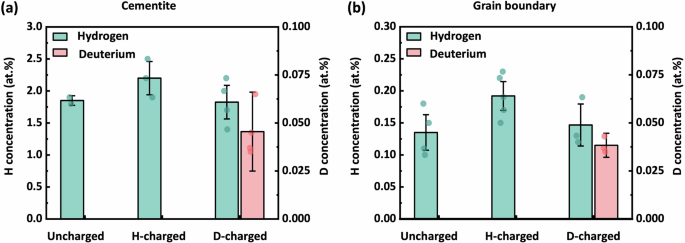
a Cementite. b Grain boundaries.
For the GBs (Fig. 5b), a similar trend was observed. The H-charged specimens had a greater mean H concentration (0.192 at.%) compared to uncharged (0.135 at.% H) and D-charged (0.147 at.% H) specimens, with no significant difference between uncharged and D-charged conditions. The D concentration in the D-charged specimens was approximately 0.038 at.%. These observations indicate the H trapping capacity in cementite aligns closely with that in GBs, and generally speaking, is consistent with the similarity in trapping activation energy values for cementite (9–49 kJ/mol) and for GBs (20–58 kJ/mol) reported in the literature18,76.
Nevertheless, the effects of specimen preparation route and H/D charging conditions (e.g., charging potential, electrolyte, etc) on the measured H/D concentration need to be systematically quantified. To this end, the experimental workflows described in the methods section were assessed by analysis of the H/D concentration in the ferrite matrix within a localised volume (~8000 nm3) of APT data from specimens in the uncharged, H-charged and D-charged conditions. These local data volumes were carefully selected to exclude any microstructural features, artifacts, and surface oxides. Compared to the uncharged specimen shown in Fig. 6a, the local mass spectrum of the H-charged specimen (Fig. 6b) exhibits a more pronounced H+ peak at 1 Da. By removing data heterogeneities and examining only the ferrite matrix, this result confirms the effect of H charging on the microstructure composition. Whilst H is present in the microstructure in the uncharged condition, electrochemical charging and ambient transfer can introduce additional H that can be measured by APT. Similarly, a peak at 2 Da can still be observed in the D-charged specimen as shown in Fig. 6c. Since there is no obvious signal detected at 2 Da in both the uncharged and H-charged specimens (Fig. 6a, b), the peak at 2 Da in the D-charged specimen (Fig. 6c) is attributed to D and not H2+. The latter is not expected using voltage pulsing experimental conditions45.

a Uncharged. b H-charged. c D-charged.
Influence of sample preparation on H measurement (W1 and W2)
Electropolishing of specimens is associated with the formation of gaseous species, where the oxygen evolution reaction occurs at the dissolving anode (APT specimen), indicated by the bubbling of O2. The use of perchloric acid (HClO4) in this process also facilitates reactions with the Fe metal, as demonstrated by the following equations45:
Given Eqs. (1) and (2), and the potentials typically employed for APT specimen preparation by electropolishing, atomic H can be generated and adsorbed on the steel surface via Eqs. (3) and (4), which make it possible for H to be introduced into the material. Figure 7a compares the H concentration in the matrix and in the ‘bulk’ APT data volume, from electropolished specimens (W1) and FIB-prepared specimens (W2). The results show significantly (statistically) less H content in both the matrix and bulk for the FIB prepared specimen (0.010 at.% and 0.021 at.%, respectively), compared to electropolishing specimens (matrix H = 0.016 at.%, bulk H = 0.038 at.%). This difference corroborates findings reported by Breen et al. 45., and provides additional evidence that H can be introduced into the APT specimen during electropolishing. The measured H concentration in the FIB-prepared specimen, therefore, might represent spurious field-induced detection of H+ originating from residual H2 in the analysis chamber of the atom probe instrument. Whilst the results presented here indicate that not all the available H traps are saturated via the electropolishing process, this could potentially impact the effectiveness of trapping from D charging, where the aim is to introduce a proxy for H that does not suffer from the same peak interference issues during APT mass spectrum analysis.
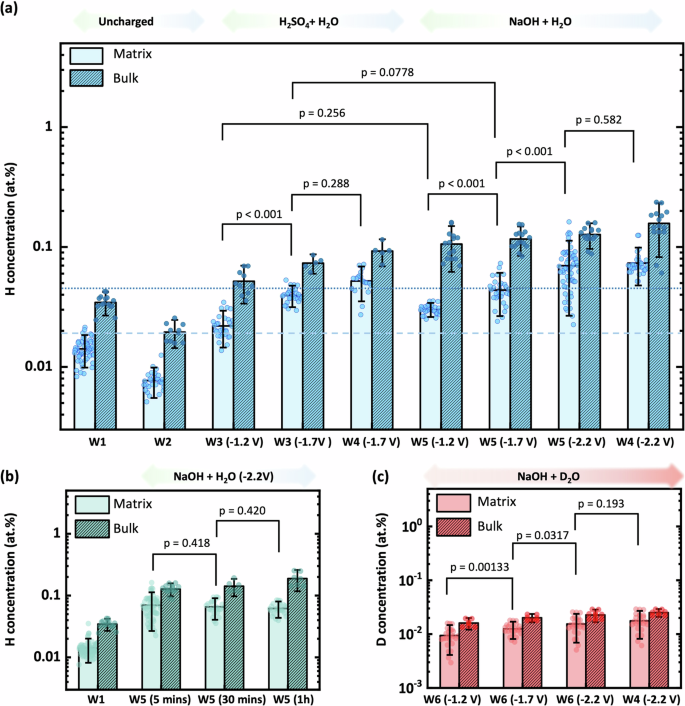
a H concentration in the matrix versus bulk H concentration. The dashed and dotted lines delineate the benchmark value of H concentration measured without H-charging (W1), in the matrix and bulk respectively. b Effect of charging time on H concentration for specimens charged in an alkaline electrolyte at −2.2 V for 5 min, 30 min, and 1 h. c Effect of charging potential on D concentration for specimens charged in an alkaline electrolyte for 5 min. Error bars for the ‘matrix’ values represent the standard deviation of concentration measurements from multiple positions selected across different specimens, whereas the error bars for the ‘bulk’ values represent the standard deviation of concentrations measured from different whole specimens. Annotated p values (determined from independent samples t-tests) that are <0.05 indicate a statistically significant difference between mean H/D concentrations from different charging conditions.
Acidic charging (W3) versus alkaline charging (W5) and different charging conditions
H/D charging in an acidic electrolyte solution is recognised as an aggressive/corrosive condition and often leads to noticeable HE77. In our experiments (W3 to W5), we charged APT specimens at different potentials and with varying electrolytes to quantify the difference in H concentration levels. Figure 7a compares the results from APT measurement of H concentration in the matrix, away from the influence of any microstructural features or crystallographic effects, with that from the bulk (whole) APT data volume, under different charging conditions. Both acidic and alkaline charging effectively introduced H in greater concentration compared to the benchmark of the uncharged specimen (0.016 at.% H). Additionally, H concentrations in the matrix increased with greater (negative) charging potentials in both acidic and alkaline cases, as the differences in H concentrations among groups with different charging potentials were statistically significant, with p < 0.001.
Notably, when specimens were subjected to the same charging potential, the measured H content of the matrix was similar for both acidic and alkaline charging solutions (p = 0.256 for W5 (−1.2 V) compared to W3 (−1.2 V), and p = 0.0778 for W5 (−1.7 V) compared to W3 (−1.7 V)), which was different to our expectation that acidic conditions would introduce more H into the material given the results from recent tensile testing where acidic charging showed more pronounced ductility loss (decreased elongation and reduction in area77). Considering that ‘trapped’ H in the matrix is reversible, it is likely that H has diffused out of the specimen during ambient transfer, which is discussed further on. However, there was a systematic increase in the total H concentration of the bulk APT data volume for alkaline charging compared to acidic, which suggests that the pH of the charging solution affects the surface concentration of H, beyond the spurious effect of electropolishing (considering the effect of residual H2 gas in the analysis chamber as constant) in introducing H into the APT specimen. Therefore, whilst acidic H charging can cause a greater impact on larger scale samples77, it seems that the surface-to-volume ratio plays a more influential role for nanoscale APT specimens, where the passive oxide/corrosion layer formed on the specimen surface is likely more persistent (not as easily removed) during alkaline charging and leads to greater H trapping and/or partially prevents diffusive escape of H. In contrast, acidic charging may entirely remove the oxide layer, resulting in lower bulk H concentration levels for APT specimens. It is noted that formation of an oxide layer during charging is not expected according to the Pourbaix diagram (potential vs pH) for Fe at ambient temperature78, where none of the Fe-oxides are stable at the charging potentials used here. We also note that the potential influence on the ingress of H during charging from a thin oxide layer formed after electropolishing, is expected to be minimal. Whilst a peak for O+ at 16 Da was identified in 4 out of the 7 uncharged specimens (see Fig. 3 and Fig. S1), this peak was much smaller for the H/D-charged specimens (see Fig. 3 and Figs. S2 and S3). Additionally, peaks for Fe-oxides (e.g., 44 and 72 Da, Supplementary Table 1) were not detected for the uncharged specimens. Notwithstanding, the effect of an oxide layer on the specimen needle with regards to its influence on the H concentration measured by APT is a complex topic that requires further investigation, which we will address in future work.
Effect of thiourea addition on hydrogen concentration (W4)
The uptake of H during the H evolution reaction is highly dependent upon the balance of the adsorption and absorption processes. During the cathodic reaction, the following key reactions occur79,80: reduction of H+ and the release of gaseous H2, shown in Eq. (3). This reaction is accompanied by a reversible process of H adsorption on the metal surface, as shown in Eq. (4). The adsorbed H on the steel surface does not compromise material integrity until it is absorbed into the matrix, which is described by the reversible Eq. (5).
The role of a H adsorption reagent, commonly referred to as ‘poison’, is crucial as it can enhance the rate of H adsorption on the (steel) surface by inhibiting the recombination of atomic H atoms (H+) into molecular H (H2), thus facilitating H uptake. Figure 7a shows the effect of thiourea; a common employed ‘poison’77,80; on the measured H concentration in atom probe specimens (W4) from both alkaline and acidic charging solutions using charging potentials of −1.7 V and −2.2 V, respectively. Contrary to expectation, the results did not reveal any statistically significant differences in the H concentration, either in the ferrite matrix (p = 0.288 for comparison between W3 (−1.7 V) and W4 (−1.7 V), and p = 0.582 for comparison between W5 (−2.2 V) and W4 (−2.2 V)) or the whole ‘bulk’ APT data volume, when compared to the identical charging condition without thiourea. These findings indicate, under these experimental parameters, the addition of thiourea does not significantly impact H adsorption/absorption behaviour at the surface of the X65 steel APT specimens. Given that thiourea is known to affect H uptake and increase HE effects from our previous work in this material system (X65 pipeline steel)58, the result in this study can be attributed to diffusive escape of un-trapped H (or H in shallow traps) at room temperature during ambient transfer after H charging. This demonstrates the limitation of the nanoscale dimensions of the APT specimen tip with regards to ambient transfer. Conversely, however, the nanoscale tip dimensions of the APT specimen have also been proven here to be quite amenable to saturation of deep H traps by electrolytic charging since there is a statistically significant increase in the measured concentration of H compared to the uncharged APT specimens, all under ambient transfer conditions. Furthermore, since the uncharged specimens were prepared by electropolishing, these results also indicate that electropolishing preparation alone does not saturate the APT specimen with trapped H.
Influence of charging time on H measurement
The duration of H exposure could be a critical factor in assessing the susceptibility of large-scale specimens to HE. Generally, prolonged charging times in an acidic electrolyte result in a more pronounced HE phenomenon77. To investigate the impact of charging time on H concentration at nanoscale and avoid possible specimen dissolution in an acidic electrolyte over a longer time, we conducted experiments on APT specimens charged in alkaline solutions at various intervals (W5): 5 min, 30 min, and 1 h. The corresponding results for H concentration in the bulk and matrix are presented in Fig. 7b.
There was no significant difference in H concentration observed between specimens subjected to alkaline charging as the charging time extended from 5 min to 1 h (p = 0.418 for 30 min compared to 5 min, p = 0.420 for 1 h compared to 30 min), which corroborates with the tensile testing results from previous work77. Moreover, like the results from Fig. 7a, there was a statistically different amount of H measured in the bulk and the matrix, consistently higher in the former compared to the latter. These findings suggest that, within the context of nanoscale measurements conducted using APT, alkaline charging time does not noticeably influence H concentration levels, but surface oxide could play a role as discussed previously. Furthermore, recently published results in the literature report a threshold time at which diffusible H content reaches a maximum, and then decreases gradually, even under constant H charging81.
Measurement of D in the bulk and matrix (W6)
Figure 7c presents the results from D-charged specimens in an alkaline charging solution using varying potentials. The matrix measurements show a trend like that of the H-charging results in Fig. 7a, i.e., as the magnitude of the applied negative potential increases from −1.2 V to −2.2 V (p < 0.05 for all comparisons). The D concentration ranged between ~0.01 to 0.02 at.%, which was slightly lower than compared to the concentration of H (~0.03 to 0.06 at.%) after H-charging. Importantly, however, compared to the ~0.001 at.% background signal measured at 2 Da in the mass spectrum of the ferrite matrix of the uncharged specimens, these results confirm successful D charging. Notably, the D concentration in our matrix measurements is similar to that previously reported in the literature for steel (up to ~0.02 at.% representing non-segregated D41,45,51,67), although via ambient charging and transfer in this work compared to cryo-vacuum transfer.
Investigation into the effect of thiourea on deuterium charging found no significant impact (Fig. 7c), mirroring the results from the H charging experiments using an alkaline electrolyte (Fig. 7a). Unlike the H-charging results, however, a statistically similar concentration of D was measured in the matrix relative to the bulk, which is attributed to a difference in trapping of H versus D in the surface oxide and microstructural features.
In this study we conducted systematic APT measurements of H/D in X65 pipeline steel specimens that were prepared by electropolishing or FIB milling, electrochemically charged in different electrolytes using various conditions, followed by ambient transfer. Data from multiple workflows were comparatively analysed and measured with statistical rigour. The major findings can be summarised as follows.
-
H was shown to segregate to carbon-rich microstructural features, including defects and APT artifacts such as crystallographic poles, even in uncharged and D-charged specimens. These observations reinforce the fact that merely observing H segregation at potential trapping sites in APT data may not serve as definitive evidence for H charging and trapping behaviour.
-
Concentrations of H and D have been quantified with statistical confidence in microstructural features (GB and cementite) and the matrix of electrochemically charged specimens when compared with the uncharged specimens. This finding demonstrates that H/D can be effectively introduced into the material and measured by APT using ambient transfer procedure.
-
Both acidic and alkaline charging effectively introduced H concentration in both matrix and bulk analyses as H concentration tended to rise with increasingly negative charging potentials. However, there was no obvious H concentration difference in the matrix when comparing acidic and alkaline charging under same charging potentials. Additionally, employing a poison during charging or extending the charging duration did not markedly affect the H concentration in the (APT) specimens, indicating the limitation of the nanoscale dimensions of the APT tips with regards to ambient transfer.
In conclusion, APT enables the direct observation and quantification of H/D within X65 pipeline steel but the influence of contaminant H should be carefully considered. We have provided detailed descriptions of various charging workflows that are a useful guide for optimised conditions for H/D charging incorporating ambient transfer protocol. This offers a relatively amenable approach for APT experiments to understand material HE behaviour at the atomic scale.
Methods
Material
Commercial pipeline steel API 5 L X65 manufactured by Baosteel and having a wall thickness of 25 mm and an internal diameter of 660 mm, was used in this study. This steel had been hot rolled in the austenitic regime followed by controlled cooling to produce pro-eutectoid ferrite and pearlite by phase transformation, as characterised previously77. The chemical composition of the steel as measured by optical emission spectroscopy is presented in Table 1.
Specimen preparation
Pieces from small sections of service pipeline were initially cut using water jet cutting followed by rough grinding to remove the surface coating. Samples for the electrochemical potentiodynamic polarisation test were cut into blocks with the dimension of 10 × 10 × 5 mm3 using a diamond saw, then connected with a copper wire cold-mounted in epoxy resin leaving a working surface area of 1 cm2. Prior to the test, specimens were mechanically ground using a series of silicon carbide abrasive papers from 200 grit down to 1200 grit and then ultrasonically cleaned in ethanol. Specimens for APT experiment were prepared from the sheet material using the diamond saw to create ‘matchstick’ blanks with the dimension of 0.2 × 0.2 × 10 mm3. Sharp, needle-shaped specimens ready for APT experiments were then prepared using a standard two-stage electropolishing process to obtain specimen tips with a final radius of less than ~50 nm. The first stage was rough polishing conducted by dipping the blanks in and out of a solution of 10% perchloric acid in acetic acid using a potential of 20–30 V to reduce the thickness of the end of the blank specimen to below ~1 μm. The second/final stage was fine polishing, which was carried out in a solution of 2% perchloric acid in 2-butoxyethonal with a potential of 10–20 V, to finalise the shape and end radius of the specimen tip. FIB preparation of APT specimens was carried out using a conventional lift-out and annular sharpening method82 with a Quanta 3D FIB-SEM instrument.
Electrochemical hydrogen charging
To introduce H or D into the material, a customised electrochemical charging cell was developed for ease of handling and rapid transfer of APT specimens, as shown in Fig. 8a. The H-charging was performed on needle-shaped specimen tips (working electrode) using a platinum wire and an Ag/AgCl electrode as the counter electrode and reference electrode, respectively. The sample holder at the working electrode was designed and built to hold up to 4 specimens for simultaneous charging of electropolished APT needle specimens under the same conditions, as schematically depicted in Fig. 8b. In all charging experiments, a BioLogic potentiostat was used for electrochemical measurements, and the assembled connections of the charging cell are shown in Fig. 8c. Complementary polarisation tests were conducted with the charging setup to provide information about how the X65 pipeline steel behaves under different charging potentials. After the cold-mounted sample was immersed in the electrolyte solution, the potentiodynamic polarisation test was immediately conducted with a fast scan rate of 50 mV/s from −3 V to 3 V to identify the H evolution reaction (HER) potential range. As shown in Fig. 8d, the HER regime can be observed, in this case in a solution of 0.1 M NaOH, where the voltage range was found to be from −1.2 V to −2.2 V and caused stable bubble formation and measurable current. Thus, three potential levels of −1.2 V, −1.7 V and −2.2 V were selected for H/D charging of APT specimens in this study.
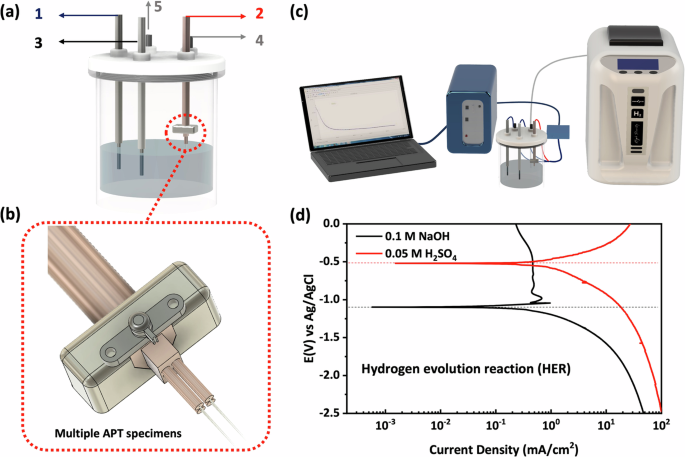
a Schematic of the H/D charging cell. 1: Platinum counter electrode (+). 2: Working electrode (-). 3: Ag/AgCl reference electrode. 4: H gas inlet tube. 5: Gas outlet tube. b Multiple APT specimens mounted on a Cu holder. c Schematic of H/D charging setup. d Polarisation curve of X65 pipeline steels measured at scan rate of 50 mV/s.
H-charging was performed at room temperature and the charging solution was constantly purged with ultra-pure H2 gas produced by a hydrogen generator (PerkinElmer PGX-H2 Plus) to mitigate the influence of dissolved oxygen, namely (i) consumption of atomic H by the oxygen reduction reaction83, and (ii) the potential to act as a gas inhibitor and block adsorption sites and thereby prevent H ingress84. Purging with H2 during electrochemical charging had no effect on the measured H concentration, as can be seen from Fig. 5, in which comparison of uncharged and D-charged specimens shows no significant difference. After the charging was completed, samples were immediately withdrawn from the charging cell, washed with ethanol, and dried under nitrogen gas. Specimens were subsequently loaded directly into to the atom probe instrument and quickly transferred through the vacuum system to the analysis chamber (and the cryogenically cooled specimen position) in less than 15 min to attempt to minimise diffusive escape of H from the material.
Atom probe experiments and data analysis
APT experiments were carried out on a Cameca LEAP 5000 XR atom probe instrument in voltage mode with a base set-point specimen temperature of 50 K, analysis chamber pressure less than 7 × 10⁻¹¹ Torr, voltage pulse fraction of 20%, detection rate of 0.5% and pulse repetition rate (frequency) of 200 kHz. Voltage pulsing was chosen over laser pulsing to increase post-ionisation and minimise the detection of H2+ ions, and thus avoid complications associated with signal overlap and peak interference at 2 Da in the mass spectrum for deuterium-charged specimens. All APT run parameters were intentionally kept consistent throughout the experiments to ensure that any observed variations in H and D measurements could be attributed to differences in the workflow rather than changes in APT testing conditions. Subsequently, the collected APT data was reconstructed using default parameters and analysed using commercial software packages, specifically IVAS 3.8.4 and AP suite 6.1. The evaporation field strength was determined using charged state ratios (CSRs) according to Kingham’s theory85 following the equations and parameters provided by Tegg et al. 86. In this work, the CSRs were determined using the ratio of C++to C+, rather than Fe++ to Fe+, due to low detection of Fe+. Except for cementite, therefore, the evaporation field strength calculated using C++/C+ ratio for relatively lower C concentration regions (matrix, grain boundaries, etc) may not be as accurate given the resultant fluctuations (Supplementary Fig. 4).
To measure and compare the relative change of H/D concentration, mass spectrum counts for all datasets (uncharged, H-charged, and D-charged specimens) were normalised by their respective total ion counts. Peaks were assigned using a consistent labelling scheme (Supplementary Table 1) and H/D concentrations were quantitatively measured at microstructural features (cementite and grain boundaries), and in the matrix (below the surface and excluding any microstructural features such as grain boundaries or carbides, or regions of non-uniform Fe density that arise as an APT artifact from the trajectory of ions near low-order crystallographic poles where there is local field enhancement from the facets of the atomic terraces at the specimen tip surface62), and bulk (the whole APT data volume). The bulk volume of reconstructed data included all ions collected from the very beginning of the experimental measurement. Data for concentration measurements were taken from consistent voltage ranges to minimise the impact between data sets of the effect of higher background and artificial H signals with increasing standing voltage42,87. Matrix analyses for measurement of H/D concentrations were confined to data collected between 5 and 8 kV and taken from a boxed region of interest having dimensions 20 × 20 × 20 nm3. Bulk measurements were made from the whole dataset collected up to a probing voltage of 8 kV. Error bars were determined from the measurements of H/D concentrations in both the matrix and the bulk. For the matrix error, the standard deviation was calculated from measurements taken at multiple, randomly selected positions in the data volumes across different specimens. For the bulk error, the standard deviation was calculated from measurements of the whole data volume from multiple specimens (at least 5), assessing the overall variability in H/D content across samples.
An independent samples t-test, conducted in R studio, was utilised for further statistical comparison of H/D measurements in the matrix of H-charged and D-charged groups. This test compares the means of two independent groups, in this case between H/D-charged specimens with different charging conditions. The assumptions for this test include independence of observations, normally distributed data within each group, and homogeneity of variances. The p value is calculated to assess whether the means of two groups are statistically different from each other. The significance level for all statistical tests was set at 0.05, with a p value less than 0.05 indicating a statistically significant difference (95% probability) between the group means.


Responses