Systemic risk approach to mitigate delay cascading in railway networks

Introduction
The functioning of modern societies counts on the reliable performance of various socio-technological systems, such as trade networks1, financial networks2,3, supply chains4, energy production5, and human mobility6. Failures in these networked systems usually come at tremendous social and monetary costs since their consequences may affect the entire system: they are systemic7,8. An example is the 2003 Northeast Blackout in the United States, where the interconnected power grid failure affected 55 million people across eight states and cost an estimated 6 billion dollars. In the context of transportation, the Association of American Railroads estimated that rail service interruptions in transportation systems could cost the US economy up to 2 Billion dollars per day. Large-scale rail disruptions can lead to severe economic damage by disrupting cargo and passenger transport9, especially in densely urbanized countries where railway transport has developed into an inextricable asset for societal and economic well-being.
The importance of railways and public transportation for sustainability is well-documented in contemporary research. Studies critically review the relationship between public transportation and sustainability, highlighting the significant role of public transit in mitigating the social, economic, and environmental impacts of automobile-oriented transportation systems10. Mosaberpanah11 emphasizes the need for fundamental changes in transportation technology, operation, and design to promote public transportation and address the environmental and social costs of current transportation trends. Scientists explored the sustainability of railway systems, advocating for the use of sustainable materials and efficient maintenance strategies to reduce the environmental impact of rail transport12. Yuan13 underscores the complexities of achieving sustainability in railway projects due to varying stakeholder concerns and calls for comprehensive approaches to address economic, environmental, and social dimensions. The importance of life cycle assessments for railway passenger services has been assessed14, aiming to accurately quantify and reduce their environmental footprint. Additionally, the development of a holistic obstacle detection system, as demonstrated by recent advancements15, further enhances railway safety and sustainability by integrating on-board, trackside, and UAV-based subsystems. Collectively, these studies underscore that improving railways and public transportation is vital for achieving sustainable urban development and addressing the multifaceted challenges of modern transportation systems.
System-wide failure in networked systems is often associated with cascading failure processes16,17,18,19. The chance for those to appear as well as their expected size are what has become as known as systemic risk. Systemic risk and their corresponding failure distributions are often characterized by power-law statistics20 that often result from a networked structure of the underlying system. Fat-tailed delay distributions in public transport networks are one example and have been empirically observed for a long time21,22. Networks of networks add another aspect of systemic risk. For example, the study of the coupling between the European power grid and the Internet grid23 shows that the shutdown of only 10% of the power stations and a cut of 12% of server providers would cause 90% of nodes to fail. Generally, the coupling of networks leads to discontinuous transitions that manifest themselves in massive failures with minimal chances to predict them.
The causes for delays in public transport systems such as national railways can be categorized into exogenous or primary delays, driven by external factors, and endogenous or secondary delays that are created by the interactions between agents in the system22, usually through the scarcity of available resources24. The primary interest in most railway studies has been on identifying risks associated with disruptions happening at the infrastructure level25. In Europe, the efficiency of strategies mostly depends on how countries organize personnel and train in disruptive situations26.
Over the past years, modeling and simulating such systems brought new insights into the robustness of interconnected networks in terms of cascades: in ref. 27, an analytical framework to study cascades of failure in interdependent networks has been developed. In railways, a theoretical model of interactions between the personnel and the rolling stock layer28 has been able to accurately display transitions in the system and predict the collapse of service. These studies show the relevance of network interconnectivity. The interdependency between personnel and rolling stock to understand cascading effects during significant disruptions was explored in ref. 24, emphasizing the necessity of respective information when studying delay cascading. New notions of transportation resilience29 and perturbations in the network topology30 have been introduced from a network perspective. It allows one to deal with disruptions in a new light including network centrality measures. Topological measures of the railway network (network of stations), were applied to quantify the resilience and how prone train stations are to disruptions31. Studies on centrality measures in the context of freight transportation32 and on vulnerability using passenger destinations33 highlighted the importance of the different agents acting on the networks. Predicting delays and disruptions based on one train being the cause for the delay of another is a central problem. Bayesian networks were used for predicting delays34, showing how statistics and the interconnection and influence of the different agents acting on the railway infrastructure can accurately predict the delays happening on a normal working day. Also, models explicitly implementing mechanisms of delay propagation in the network of stations have been proposed: using the similarity with influence spreading35, these phenomena can be quantified using network diffusion via the replication mechanism. to study and predict the evolution of delays in a disruptive situation, like diffusion36 or epidemic spreading models22,37. Moreover, these kinds of systems lend themselves to applications in machine learning or big-data approaches38,39 for predictions on their future status and to spot disruptive transitions in advance. Railways are systems in which a single operation (a train trajectory), which depends on the coordinated presence of different events at the same time (personnel and rolling stock available, free infrastructure), may lead to a sequence of concatenated disruptions40,41.
Recent research42 employs a heterogeneous graph neural network to predict delay evolution, emphasizing a network-wide perspective and improved predictive accuracy. Heuristic-based alternating direction method of multiplier43 optimizes timetable rescheduling during disruptions, enhancing passenger satisfaction and operational efficiency. Sharma44 addresses real-time Railway Traffic Management, focusing on minimizing delays and preserving passenger connections through platform compatibility and variable connection time.
Considerable effort has been put into modeling the propagation of delays in transportation systems where analytical45, agent-based46,47, stochastic48,49,50,51, networks40,52,53, and purely data-driven models54 were deployed. Railway networks have been modeled with agent-based simulations (ABS). They can be performed on different levels of detail. Macroscopic simulations, implementing only the queuing of trains for each available resource (blocks, platforms, rolling stocks, personnel), provide a rough – however intuitive and efficient approximation to delays in the network55,56. In contrast, microscopic simulations incorporate details of how a train moves and each of its interdependencies plays out, allowing for a more detailed simulation. Realism is gained at the expense of a more computational effort and the necessity of more detailed information57,58.
Simulating a national railway scenario is computationally challenging due to the amount of detailed information, such as multiple agents (trains), signals, splits, and primary delays. Computational efficiency is crucial as the number of details increases. For instance, a railway network simulation with 1000 trains, 5000 operational points, 100,000 signals, and 50,000 switches allows for billions of possible scenarios. These involve train conflicts, failures, queues, and delays. Traditional simulation approaches struggle with the associated combinatorial explosion caused by national railway networks, extensive tracks, numerous trains, millions of passengers, and complex scheduling algorithms. Incorporating every detail is limited by the associated data requirements. Up to this day reasonable choices of which details to include and which ones not remain important.
In the railway network shown in Fig. 1 delay spreading can occur through one of two processes. First, two agents compete for the same infrastructure, i.e., tracks (blue layer). The time-ordering of events is important since, e.g., a train can spread delay to its following trains when it is delayed itself. Second, the delay may spread through interactions in the organization of the rolling stocks. If the traction unit of a running train is scheduled to be used by another train service on the same day, the potential delay of the first one may spread to the latter. As described in the Figure and in the following sections, the personnel layer could also potentially impact follow-up services. The two possibilities for interaction, represented by the blue and orange layers in Fig. 1, create a multiplex network that we call the effective impact network. The nodes are train services, links are the ways individual trains can negatively affect each other. Following Fig. 1, if train A has a delay, it will spread to B, and subsequently cascade to C; Train E needs to wait for the traction units of train D, making the delay spread over the rolling stock layer of contacts. The effective impact network for the path from Vienna Central Station to Wiener Neustadt in Austria is shown in Fig. 2.

Three different layers contribute to the spread of a delay. Infrastructure contact (a) infrastructure (tracks or platforms) is occupied, e.g., by another train in transit. The upper train will then spread its delay onto the bottom train. In panel (c), we denote this by an arrow between A and B in the blue (infrastructure) plain. Rolling stock contact (b) A train service has to wait for the arrival of the corresponding traction units being used by another service. The arriving train can spread the delay to the waiting train: in panel (c), train D spreads the delay to E. Personnel contact, not shown, where a train service has to wait for the onboard personnel to arrive. In panel (d), the bottom line represents the time axis. Train services are represented as the other lines. The beginning of a line represents the starting time of the service. A train service can transmit its delay through a proximity contact (light blue) and a rolling stock contact (orange), described in (c). In this picture, trains A and B compete for infrastructure resources (a free track section of line) at time t1, so the status xB(t1) (delay) of train B is updated through Eq. (2): all the contacts that B had in the time interval, δt, are considered, and its delay is calculated accordingly. Trains B and C have a similar interaction at time t3, propagating the delay generated from A. Train D shares its rolling stock with train E at time t2, i.e., train E needs to wait for train D‘s arrival.
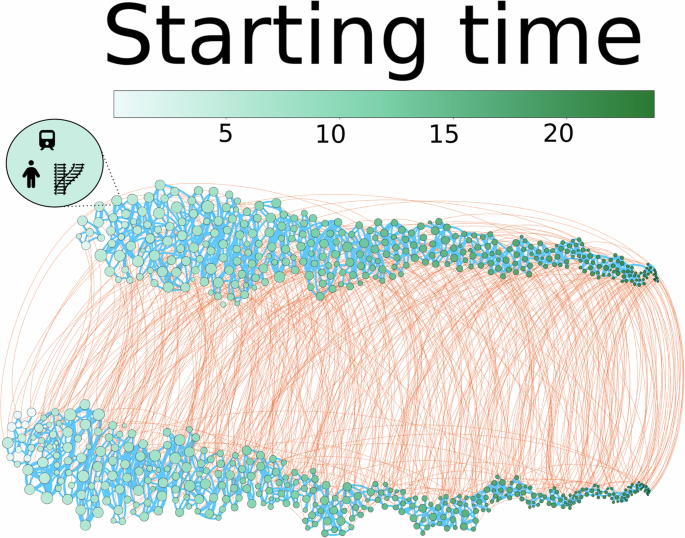
Nodes represent train services that contain three parts: personnel, rolling stock, and the availability of infrastructure (items in the circle). Orange links are interactions from shared rolling stock. Blue links show infrastructure contacts. The time of the day when the service starts flows from left to right, from ca. 4 a.m. to midnight. The infrastructure contacts clearly define two communities that reflect the two travel directions. The diameter of nodes is proportional to the impact of train services in terms of delay “spreadability” in the network. Note that trains operation in the first rush hours bears the highest impact. We consider only the train line between Wiener Neustadt and Vienna Central Station in a typical working day.
The main idea of the present work is to use the effective impact network to compute a systemic risk indicator, the train impact, I, for every train in the system. I is defined (see Methods in Eq. (3)) as the sum of the delays transmitted to other trains at the end of a network diffusion procedure (NDP) that we sketch in Fig. 3. For every train, we start a diffusion process at some internal time t = 0. Initially, all trains start with no delay. We then pick one train and assign a delay of 1 to it. Being that our network can be represented as a directed temporal network (Fig. 1d), the train then transmits its delay to all trains that lie one step downward the effective impact network (t = 1). This procedure repeats until all downward trains are impacted (here at t = 2). The sum of the delay of all trains in the network represents the impact, I, as defined in Eq. (3). In other words, based on this network we design a network centrality measure corresponding to a specific diffusion process that is a realization of the possible cascading processes. We use the trains’ systemic impact to rank the systemic relevance of train services. By modifying the network, e.g., by introducing new train services we can change the impact of trains and thus the “spreadability” of delay in the system. Introducing new train services typically means reducing dependencies of trains and is equivalent to pruning links of the initial effective impact network (see Fig. 3). This approach is applicable broadly, allowing for the examination of delay diffusion between train services at the national level. Our analysis, presented in Supplementary Fig. 5, reveals that the majority of spreading dynamics occur within individual lines. Consequently, each line can be regarded as a distinct community. The temporal directionality of contacts prevents the formation of cohesive clusters within each line. Nonetheless, we have identified certain trains that pose greater risks than others.
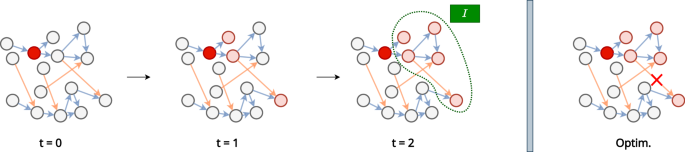
We show the steps for reducing delay spreading in the railway network. For every train, we start a diffusion at t = 0, updating its status (delay) to 1. The train then transmits its delay to all its trains downward the effective impact network (t = 1). At the end of the procedure, once all lower trains are impacted (here at t = 2), the sum of the delay of each train in the network represents the impact, I, as defined in Eq. (3). Through a simple network re-organization (here removal of an orange link), an optimization technique (Optim.) leads to less expected delay in the system.As shown in the right panel, this can be visualised in the network as pruning efficiently the rolling stock layer. In practice, adding a rolling stock mean adding personnel to drive it: for this reason we will refer to “adding a new train service”, and not “adding rolling stock”. Ranking the trains based on their relative impact, we proceed removing the rolling stock edges and recursively re-calculate the impact.
To validate the effectiveness of the results obtained with the NDP we develop a corresponding ABS that captures the delay distribution of the system; see Supplementary Note 1. We can now show that delays in the system can be significantly reduced by only adding a few specific new train services (that amount to deleting links in the effective impact network). The NDP is particularly convenient to test railway management policies without detailed data or computationally exhaustive simulations.
In the following, we primarily focus on the Austrian railway section from Vienna Central Station to Wiener Neustadt, a small town at ~40 km south of Vienna. This section is part of the Südbahn line, one of the most traveled lines in Austria. In the SI, we provide results for the whole of Austria and another selected line (see Supplementary Note 2 and 3, respectively, Supplementary Fig. 2 and Supplementary Fig. 3). In Supplementary Note 4, we provide a glossary of railway terms used.
Results
In Fig. 2 note the multiplex nature of the contacts in the railway network. The size of the nodes is proportional to the train’s impact in initiating delay cascades. The color encodes the trains’ starting time. We observe that the most impactful trains are those running during the first rush hours (larger circles). The two communities of nodes (the upper and lower strains) come from the topology of the infrastructure contacts (blue links) and interact through the rolling stock contacts (orange links). The different types of contacts (see Supplementary Note 5, Supplementary Fig. 4) spread delays at different rates. Even though the delay transmission in the infrastructure layer appears to be more frequent, nodes are affected (get delayed) with less intensity than through the rolling stock layer.
Note that in our analysis, we do not consider the circulation (reassignments) of railway personnel (drivers, conductors, inspectors) due to a lack of corresponding data and that the diffusion method reflects the different spreading strengths in the two layers with two different parameters (see Methods).
In Fig. 4a, we show the ranked distribution of the train impacts with (black line) and without the rolling stock contacts (red dots) for the NDP. The latter case represents the idealized situation where rolling stock would not have any effect on delays. For comparison, we compute an accurate fully detailed ABS, described in the Methods section and sketched in Fig. Supplementary Fig. 1(A) in Supplementary Note 1, as a benchmark. Supplementary Fig. 2(B) in Supplementary Note 1, shows how well the simulation manages to reproduce trains’ delay at destination during a whole month.
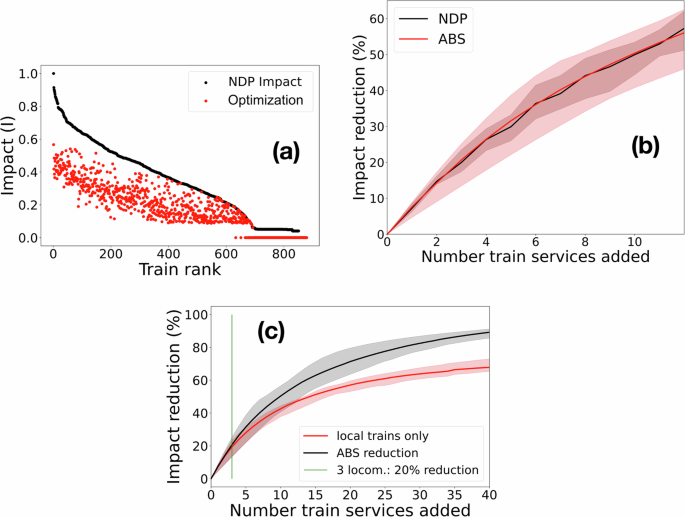
a Ranked train impact, I. The black line represents the results of the NDP with both layers, infrastructure, and rolling stock. Red points consider the infrastructure network only and are ordered according to the rank given by the NDP Impact (black line). b Delay reduction by adding new train services. Average, first, and third quantiles of the relative impact reduction as a result of adding new train services. For the ABS (red) the impact is in terms of total delay transmitted, the NDP is in black. NDP uses a recursive algorithm in the network of contacts to assess which rolling stock would have the highest impact on sharing delay. Based on that, we progressively add more rolling stock to reduce their impact and break some of the black links in Fig. 2. With three more rolling stocks we reduce the impact by about 20% (green vertical line). For the ABS we find that introducing three more units decreases the total delay of the day by 20% (as also found with the diffusion method) while introducing 20 units more reduces delays by about 65%. Lines converge at 100 %. The results are shown for a quarter (from January 1st to March 31st 2019) in the Austrian Südbahn railway line from Vienna Central Station to Wiener Neustadt. c Delay reduction by specifically adding local train services. The ABS (black) covers all the possible train services, which coincides with the green curve in panel (b). The red curve is obtained analogously to the black one but by restricting the procedure to local train services only, i.e., the cheapest and easiest to add. While the black curve eventually reaches 100%, the red one saturates at 70%. Note that with three more rolling stocks we reduce the impact by ~20% (green vertical line).
A corresponding rank distribution of the impact has been produced with the ABS and is shown in Supplementary Note 6, Supplementary Fig. 8. In both cases, NDP and ABS, we observe a substantial reduction of the impact of the most dangerous trains by about a factor of 2.
We continue with case-based scenarios, deliberately introducing primary delays to a small fraction of the most impactful trains to assess their dangerousity and coping for the cascades generated. We use NDP and ABS to asses the impact reduction in a scenario in which the top 2% most impactful trains are the ones generating cascades (influencer trains). In the ABS, we inject a one-hour primary delay on the initial trains; in the NDP we start the diffusion from all of them, assigning a value of 1 to their node status. In the following, we refer to the impact reduction generated by multiple initial trains, as multi-body impact.
Figure 4b shows the delay reduction percentage by gradually adding train services according to their contribution to their multi-body impact. Note that adding train services is equivalent to pruning the rolling stock contacts. For the ABS we interpret the overall transmitted delays as the impact. Adding three train services already reduces the total delay by ≃20%. We obtain similar results in scenarios where the amount of train influencers ranges between 1 and 5%. More than 5% would be far from realistic. The goal of our optimization technique is to improve the systemic delay in a normal working day condition. Under these assumptions, simulating a percentage higher than 5% would describe a highly disrupted, thus very unlikely, situation. Nonetheless, our procedure is effective for any percentage of delays: the bigger the number of delayed trains, the easier it is to improve. The red curve represents this optimization for the ABS. The black line represents the results of the diffusion over our network. The two methods show agreement for the first dozen of added trains. The optimization procedure has been performed over all the possible train services. However, long-distance trains are more difficult and more expensive to be substituted. In Fig. 4c we show the optimization using the ABS in two cases: (i) Optimizing over all possible train services (black line) and (ii) optimizing over only the train services that are the cheapest for the railway companies to add (red line); these are the local trains59 with electric traction units. In this way, we show that we can reduce the overall delay by about the same percentage (20%) by adding three of the cheapest possible train services that reduce the effects of local disturbances. The results are shown for a quarter (from January 1st to March 31st 2019) in the Austrian Südbahn railway line from Vienna Central Station to Wiener Neustadt.
In Fig. 5 we show the change in daily delay distributions (at the final destination) when removing all rolling stock dependencies. We use the scenario where the 2% most impactful trains get an hour of primary delay. The corresponding delay distribution is the black line. When all trains are independent of the rolling stock layer we get the red line. A substantial reduction in severe delays of almost a factor of six is seen. Note that 60% of this reduction is reached for the first 12 steps of the procedure.
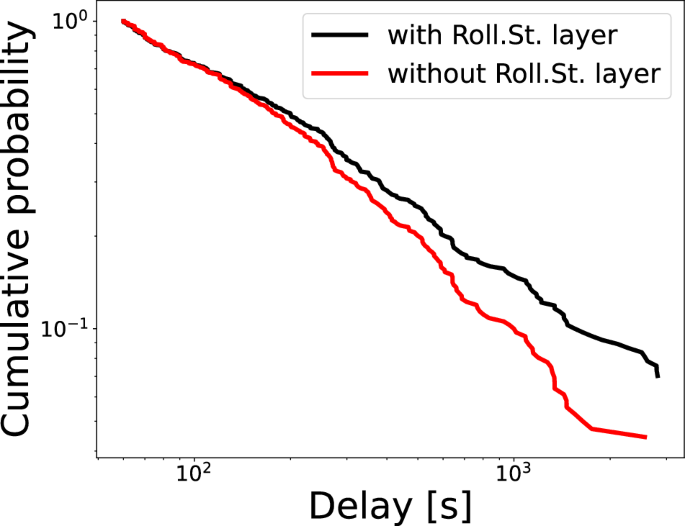
The black line represents the delay distribution of the 2% scenario for the entire month of May 2018. After removing all rolling stock dependencies we observe a substantial reduction in the tail of the distribution (red).
Discussion
We use a novel approach capable of significantly reducing the size of delay cascades in the railway system. We analyzed the topology of the network of train contacts (Fig. 2) by which trains may induce delays on other trains, calculating the impact for each train. We identified rolling stock sharing as the main factor responsible for delay cascades. This happens despite the number of links in the rolling stock layer being way smaller than that of the infrastructure contacts (see Supplementary Note 5 Supplementary Fig. 4). The impact of each train and the densities of the contacts for each layer suggests that to mitigate delay cascades, one should focus on strategies affecting the supply constraint layers (rolling stock or personnel).
If we only consider infrastructure contacts, railways are resilient as soon as the system is far from being overloaded. Effectively managing the organizational layer can help ensure the overall resilience and stability of the railway system, even in the presence of unexpected disruptions. This insight can provide guidance in the details that a railway ABS needs to incorporate in order to correctly simulate delay cascading.
Our Network Diffusion Process (NDP) is effective in ranking trains by their propensity to spread delay, an essential insight to start coping with the highest delays. In practice, if we have two big train influencers, maybe not both of them are dangerous in reality. For example, a topologically very central node never spreads anything because the corresponding train service is always on time. Here we must specify the difference in characterizing the topology of a network or a phenomenon happening on the network. A realization of a random event such as delay arising in the railway network and its consequent spreading is a phenomenon happening on the structure of the contacts. For this reason, we wanted to rely on a more detailed simulation that could validate our results. As a benchmark, we devised an ABS to reproduce the Austrian railway’s daily dynamics.
In a scenario with no delays, i.e., with no conflicts, both the ABS and the NDP measure scale linearly in the number of trains and operational points. When delays are present, the ABS resolves all the conflicts generated, thus adding extra computational time needed to allocate all the extra events. The temporal network diffusion will not explicitly take into account all these conflicts. In this sense, the diffusion technique can be seen as the conflict-static representation of the whole ABS, resulting in a more pragmatic but still effective characterization of the system. Simulating the system when large delays happen, namely when conflicts happen, is a difficult task. A lot of microscopic details are needed to fully simulate the system and obtain useful insights. The network measure has the advantage of not depending on these details, thus it is cheaper in terms of data and needed data accuracy.
Moreover, sensors used to record train trajectories may fail, generating inconsistencies in the acquired data. Fixing data collection bugs, in fact, is an actual field of research60. Leveraging NDP, we have been able to improve the system’s overall performance with a simple strategy consisting of adding a few resources. As an example, we show that this is possible by introducing additional train services, avoiding the interdependencies in crucial events during the day. The diffusion method described in ref. 36 focuses on a network of stations, while our nodes are trains, i.e., the real delay diffusing agents. Our diffusion technique is rather simple, but, as shown with the ABS, captures the essential part of delay cascading. Our impact is only a proxy for the delay, being a topological measure. However, through the ABS we showed that results coincide with a certain precision. For a more detailed description of the precision, we refer to Fig. Supplementary Fig. 9 in Supplementary Note 7. One could incorporate in the analysis train specific parameters for the spreading process. In any case, we observed that having a fixed parameter describing impact spreading in each layer is enough to reproduce the delay spreading in the AB simulation. The simple yet effective way we introduce a policy that reflects a real situation is a value added. Our solution is practical, as it does not require the substitution to occur in real-time. We identify the optimal moments in both space and time where a substitution can, on average, reduce the delay by a certain percentage. Identifying topological issues in the contact network, we can cope for the criticalities that are expected to happen on an average day. Of course, in occasion of a disruptive event at the macro level, other ad hoc strategies have to be developed.
Moreover, our approach is lacking the personnel layer, which could in principle change the shape of trains’ impact distribution. Our procedure maintains its generality. When additional details or layers that influence delay propagation are introduced, the diffusion procedure can be re-executed to obtain updated results. Subsequently, using the ABS, one can assess how accurately the topological spreading over the network reflects a real-world scenario. As highlighted in ref. 61, the inclusion of the rolling stock layer is sufficient to observe and reproduce delay cascades. This indicates that the layers we are considering are essential components of the delay propagation mechanism.
If the diffusion technique, based on the impact, is significant for other national railways is out of scope here. This approach is quite different from diffusive studies on railway networks, being that focuses on train services (and not stations or operational points) as nodes of the network.
We defined an optimization procedure able to reduce the impact on each railway line. Contacts between lines are significantly lower than the ones inside a line (see Supplementary Fig. 5 in Supplementary Note 5), validating the compartmentalization of the national railway. In this way, we are neglecting those contacts, which could in principle be re-introduced as a second-order effect. By ranking trains’ impact we unveiled the fact that some trains are more dangerous for the whole system’s performance, and this is due to the rolling stock layer, accounting for half of the total delay. If we only consider the infrastructure layer, no trains are notably big influencers. This approach ranks trains based on their single-body impact, without taking into account the joint disturbance generated by multiple trains. We performed the same ranking based on the total delay induced in the ABS, as shown in Supplementary Fig. 8 in Supplementary Note 6. Figure 4b demonstrates how we resolve a concrete problem, i.e., reducing the size of the delay cascade in a scenario in which some trains gain an important delay. By adding just three new train services, i.e., by removing three train dependencies, we achieve a 20% reduction in the total delay at the end of the day. The two approaches, NDP and ABS agree on the first and most important steps of the optimization curve. Adding more trains the two methods differ and the NDP overestimates the impact reduction. A possible explanation is that the ABS contains far more details, including the buffers at each station that generally reduce the impact. However, particular combinations of the two parameters in the diffusion simulation can accurately reproduce the impact reduction estimation of the ABS; see Supplementary Note 7 Supplementary Fig. 9. Of course, we have a reduction when a critical situation happens: when each train is on time we would observe no reduction. We performed the same optimization over another line, line 10102 from Vienna to Salzburg, Supplementary Fig. 2 in Supplementary Note 2 and over the whole Austrian railway network Supplementary Fig. 3 in Supplementary Note 3. For this last optimization, we also included the contacts between lines, showing that the second-order contacts do not inhibit our NDP optimization. We observe that on the line with less traffic, the optimization is more effective, reaching almost 60% impact reduction by adding only three train services. For the whole Austrian network, the total reduction amounts to 40%, adding the same percentage of trains with respect to the total, which in this case amounts to 37 trains.
We also restricted the optimization over the local trains, which are the easiest and cheapest to reassign. In this case, we can still reduce the delay by 20% just by adding three train services (Fig. 4c).
Moreover, this procedure reduces the probability of the largest delays by a factor of six, as shown in Fig. 5. This is the distribution we would obtain pruning all the rolling stock layer, so adding hundreds of trains. Nonetheless, 60% of the discrepancy between the two curves is made by adding only 12 trains.
With respect to ref. 28, we simulate a real situation and do not investigate the load of trains at the stations and the collapse of the system with a mean-field approach. We, instead, quantify the spreading ability through the rolling stock layer.
The central piece of this work is to introduce a metric of systemic risk and use it, in a policy-making scenario, to reduce trains’ impact on the whole system’s delay. To achieve this goal, we used a network made of train services. Reducing the impact is not as reducing the total delay, as the impact in our NDP is a topological measure over the contact network. To validate the results, we used a more precise ABS, showing that our procedure reduces the impact over the network as would reduce the total delay in an ABS.
We could study the contacts between the lines and understand which importance they have onto the single-line dynamics. One important tool would be a measure of early warning signals of disruptive transition: a measure dependent on all the layers able to anticipate and control train traffic flows. A helpful insight would be to weigh these procedures with energy consumption, carbon dioxide reduction, and the number of passengers, but these pieces of information are currently missing.
An important feature to add in future studies would be personnel circulation. The complete picture containing all layers could add more depth to the research and topic. Using this insight, it would be possible to generate a new sort of policy, rewiring the multi-layer connections between trains, instead of pruning them. This would result in a long-term rescheduling of trains, instead of adding new ones. This could greatly reduce cascades and total delays on a daily just by re-organizing the system in order to be resilient to delay cascades.
Methods
The subject of analysis is train services. Train service is the collection of services and resources needed for a train to run, e.g., rolling stock, infrastructure, and personnel. In the public daily schedule, train services are indicated by a unique identifier, e.g., “RJ 123” (train class: Rail Jet; train number: 123). We define two types of interactions or contacts between trains: rolling stock contacts and infrastructure contacts. Rolling stock contacts are responsible for the transmission of delay caused by shared rolling stocks (wagons, traction units), e.g., that are not at the right place at the right time when needed. Infrastructure contacts may cause transmission of delays by shared facilities (platforms at stations, sections of lines, and tracks). More precisely, a train that will pass by a block has a direct connection to the next one that will pass by the same block.
Effective impact network
We consider the railway system as a multilayer network with nodes representing train services and links in each layer representing one of the two types of contact. Each line of the Austrian national railway service is split into two main components, i.e., the two opposite directions of the line (Fig. 2). The rolling stock layer bridges these two components that would remain disconnected otherwise.
With these premises, we compute diffusion processes on the multiplex network for all the train services. Dynamical network processes can be of different nature35. The closest to the phenomenon of interest is diffusion via the replication mechanism. It has been used e.g., to simulate influence: through interaction, individuals cause changes in each other’s beliefs or attributes62,63. Performing this action, the influencer does not lose his/her attitude and can influence multiple people simultaneously. Similarly, a train influences another train without losing its delay and keeps its capability to transmit delay. Multiplex networks are employed to model scenarios where the same class of nodes interact in various ways, such as in transport systems. By assigning distinct colors to links of various types, multiplex networks can be visually represented as a colored network in one layer. For example, in Fig. 2, we can see how the nodes (train services) densely interact with infrastructure contacts (blue edges) inside each of the two major components; instead, the two strands are connected by rolling stock contacts (orange edges). In the multiplex formalism, the same node (i) has a replica node (i, α) for each layer α. In this notation, the diffusion equation in a multiplex network is
where xi represents the status or attribute of the node i. The first and second terms on the right-hand side of the equation correspond to intra-layer and inter-layer diffusion, respectively. D[α]wij represents the stregth of the diffusion between nodes i and j in the layer α, N is the number of contacts node i has layer α and M is the number of contacts node i in layer α has with nodes on layer β. In our case, the status of a node is a proxy for the delay.
In this network framework, we can compute the so-called communicability64,65, i.e., the number of reachable nodes from the starting node, through a diffusion process with infinitely many steps. Each train is connected to the network section corresponding to train services running at a later time. From a communicability point of view, each train could in principle reach each other train starting in a following moment in time. Being that the layer of the infrastructure is not a hard constraint in the delay transmission, but more as an influence (see Supplementary Fig. 6), using communicability, e.g., total fractions of nodes reachable by the initial node, is not a right choice. Instead, we directed the analysis in quantifying the intensity of this spreading.
Since we want to address the risky state of train services, the second part of Eq. (1) coincides with ({x}_{i}^{[alpha ]}) and ({D}^{[alpha ]}{w}_{ij}^{[alpha ]}={w}^{[alpha ]}), since the coefficients are only layer dependent. In line with a previous study66 we use max-plus operations to update each node state. The final update equation is:
where j runs over all the contacts agent i had in the time interval [t, t + Δt]. Δt has been kept as fine as possible, so Δt = 1 s for both the simulations. In this way, each status is updated as an event occurs. The status of a train (node) is at each time the same in all layers. In this sense, our network is a multiplex network. Our diffusion measure of delay spreading depends only on the network topology.
We carried out a type of diffusion in which a small amount of delay (e.g., w[roll.st.] ≈ 0.2) gets transmitted through infrastructure contacts while rolling stock contacts transmit a more significant amount (({w}^{[{rm{infrastructure}}]}approx 0.7)). The material constraints play an essential role in the diffusion of delay (see Supplementary Note 5 Supplementary Figs. 6 and 7). We simulated the impact of each train service by initializing the corresponding node with a constant status, i.e., the status of node i in every layer α at the initial time t0 is set to ({x}_{i}^{[alpha ]}({t}_{0})=1), and letting it diffuse on the whole network. All the other trains are initialized to ({x}_{j}^{[alpha ]}({t}_{0})=0). We calculate the train service’s impact by summing all nodes’ states after the diffusion process has finished (evaluating the final contact event at time tf). We calculate the impactI of a train as
where tf is the time of the last event of the contact sequence and j run over all the trains (nodes) in the network. In the case of ABS, we identify the overall transmitted delays as the train’s impact. As shown in Fig. 2, these diffusion processes show a backbone of more impactful trains whose starting time is in the first rush hours. If we only consider infrastructure contacts, we will not observe this effect.
If only the infrastructure layer is considered, most of the first rush hour delays do not propagate to the second rush hour. By adding the less frequent rolling stock contacts, the diffusion on the network will happen faster, quickly covering the whole network. As shown in the Dutch Railways in previous studies24, these findings highlight how the constraints in the available rolling stock materials are essential for the delay spreading phenomenon and must be considered.
Once we quantify the risk of delay spreading associated with all the train services, we perform a recursive algorithm where we optimize the addition of new train services to break the cascade of delays.
Since the diffusion of delays on the infrastructure layer is slower than on the rolling stock layer we shall determine which rolling stock link to break when optimally adding new services to minimize delay cascade sizes.
We generate a scenario in which the high-impact trains gain some important delay. We simulate a diffusion starting from the most dangerous trains. We vary the number of starting trains from 1% to 5% of the entire number of trains (around 1200 trains), observing comparable results.
The optimization works as follows: we initialize the status of the most dangerous trains, for example, around 1−5% of the total number of trains. Each value generates a scenario that follows similar dynamics; in the following, we will refer to the choice of 2%. Then, we quantify the impact of the diffusion simulation on the whole system. Subsequently, we optimally add a train service to reduce this impact maximally. In practice, this means pruning the rolling stock contacts, removing first the most dangerous in terms of impact. Few rolling stock contacts play a central role in the diffusion. Remarkably, the optimisation technique consists of adding rolling stock and personnel (unknown layer in this analysis). For this reason in the plot we will refer to adding train services and not rolling stocks.


Responses