Targeted long-read sequencing enables higher diagnostic yield of ADPKD by accurate PKD1 genetic analysis

Introduction
Autosomal dominant polycystic kidney disease (ADPKD), with an incidence of approximately 0.1–0.25% worldwide, is one of the most common inherited kidney disorders and responsible for 5–10% of end-stage renal disease1,2. Disease-causing variants in PKD1 and PKD2 account for approximately 85% and 15% of ADPKD, respectively3. In general, ADPKD is clinically diagnosed by ultrasonography based on age-related criteria4. However, the diagnosis made by imaging may be uncertain, particularly in young individuals less than 30 years old4. Therefore, molecular genetic testing is required to achieve a definite diagnosis5. The genetic diagnosis of ADPKD can provide significant benefits for patients who seek genetic counseling during assisted reproductive treatments and reduce the possibility of at-risk pregnancies6.
However, the genetic diagnosis of ADPKD has been particularly challenging due to several factors. First, PKD1 is a large gene that contains 46 exons spanning 47.2 kb of genomic DNA5. Second, genetic analysis for PKD1 is complicated by the presence of 39.9-kb duplicated segment that encompasses exons 1–33 and shares 98% sequence similarity to six pseudogenes (PKD1P1 to PKD1P6)7,8. Microgene conversions between PKD1 and its pseudogenes can be caused by the transfer of sequences from high homologous pseudogenes to functional genes, which have been reported to be associated with ADPKD9,10,11. Third, the high GC content of exon 1 in PKD1 makes it difficult to amplify and sequence using standard sequencing methods2. Lastly, a high level of allelic heterogeneity has been observed in disease-causing variants of PKD1 and PKD2, including more than one thousand pathogenic or likely pathogenic single-nucleotide variants (SNVs) and insertions/deletions (indels), and the majority of these variants are exclusive to a single pedigree12. In addition, approximately 2–6% of ADPKD are caused by copy number variants (CNVs), which consist of single to multiple exon deletions or duplications5,13,14,15.
Currently, a few genetic testing methods, such as long-range PCR, short-read sequencing (SRS) and multiplex ligation-dependent probe amplification (MLPA), have been used in the diagnosis of ADPKD16,17,18,19,20. Due to high sequence homology between PKD1 and its pseudogenes, SRS approaches could lead to false positive or false negative genotyping due to the incorrect calling of variants from pseudogenes21,22,23. Although targeted SRS combined with long-range PCR for locus-specific PKD1 provides a robust approach for ADPKD genetic testing, extra input for exon 1 in PKD1 is required to achieve balanced sequencing depth due to GC bias during SRS24. MLPA can only be employed to detect large deletions and duplications in PKD1 and PKD2, which could increase the turnaround time and diagnostic cost15,24. These traditional methods have limitations in accurately detecting all types of variants in PKD1 and PKD2, particularly in the duplicated regions of PDK1. This has led to a significant diagnostic gap in ADPKD genetic testing, with some patients remaining undiagnosed or incompletely diagnosed despite a clear clinical phenotype. At present, the diagnostic rate in ADPKD is approximately 80 to 90%1,20,25,26,27,28. Therefore, it is necessary to improve the diagnosis for ADPKD patients, especially when they are seeking assisted reproductive treatments.
In recent years, single-molecule GC-unbiased long-read sequencing (LRS) has emerged as a promising approach to overcome these challenges, and improved genetic diagnosis for diseases with complicated molecular genetics such as thalassemia29,30, congenital adrenal hyperplasia31,32, spinal muscular atrophy33,34, fragile-X syndrome35, hemophilia A36, and ADPKD27. LRS-based approach generates reads spanning large genomic regions of PKD1 and PKD2, improves detection of structural variants and the resolution of repetitive sequences, and makes incremental diagnostic rate compared to LR-PCR, SRS and MLPA combined approach27.
In this study, we aimed to evaluate the effectiveness of LRS-based approach in improving the genetic diagnosis of ADPKD, particularly for patients who had remained undiagnosed or incompletely diagnosed after conventional SRS testing.
Results
Improvement of diagnostic yield in PKD1 and PKD2 by LRS
A total of 40 clinically diagnosed ADPKD patients without full genetic characterization by SRS were retrospectively enrolled in this study (Fig. 1). The cohort included 28 male and 12 female patients, with a mean age of 25.8 ± 5.5 years. Targeted LRS for PKD1 and PKD2 genetic analysis were performed for all 40 patients. LRS identified 9 P/LP and 17 VUS SNVs/indels in PKD1, as well as 9 P/LP CNVs in PKD1 (Fig. 1, Table 1). Compared to SRS panel-based diagnostic workflow, LRS approach identified pathogenic or likely pathogenic PKD1 variants in ten more patients, which increased the genetic diagnosis rate from 20.0% (8/40) to 45.0% (18/40) and the variant detection rate from 62.5% (25/40) to 87.5% (35/40) among previously undiagnosed cases. This represents a significant improvement in diagnostic yield for this challenging subset of patients. Among all the cases, LRS could presumably increase the genetic diagnosis rate from 89.7% (280/312) to 92.8% (290/312) and the variant detection rate from 95.2% (297/312) to 98.4% (307/312).

*The variant PKD1:c.12048C>T in KPK035 was classified as VUS at the time of enrollment and was upgraded to pathogenic with added evidence in this study.
LRS detections for PKD1 and PKD2 SNVs/indels
Eight patients were found to have pathogenic or likely pathogenic SNVs/indels in PKD1 using targeted LRS approach. These eight variants included four microgene conversions between PKD1 and its pseudogenes, three indels, and one deep intronic variant (Table 1). All eight variants were confirmed by Sanger sequencing (Supplementary Figs. 1 and 2).
Among the four patients with microgene conversions, two patients harbored the same frameshift variant PKD1:c.160_166dup, which was a duplication of 7 nucleotides in exon 1 and existed in four pseudogenes (PKD1P1/3/5/6) (Fig. 2A). There was no detected SRS reads to support the variant in these samples (Fig. 2A). Patient KPK003 had a missense variant PKD1:c.2180T>C in exon 11, and this variant also located in five pseudogenes (PKD1P1/2/3/4/5) (Fig. 2B). The splice site variant PKD1:c.8161+1G>A, identified in patient KPK004, was affecting intron 22 and located in three pseudogenes (PKD1P1/3/4) (Fig. 2C). The SRS reads of these two variants were below the 20% detection threshold, which could be due to the alignment of these large segments to their pseudogenes (Fig. 2B, C). Visual inspection of the SRS bam files supported the existence of these two variants.
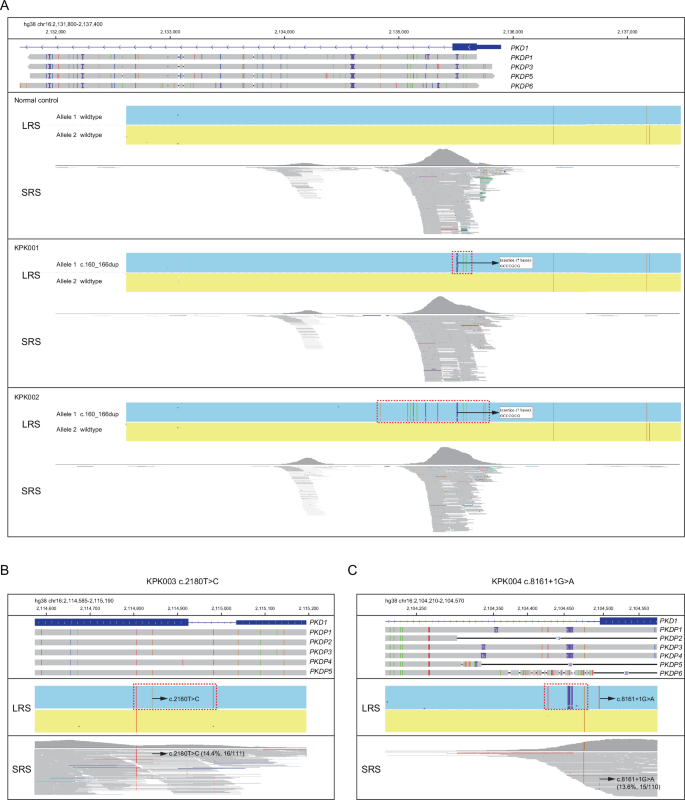
A–C IGV plots of LRS CCS reads and SRS reads showing PKD1:c.160_166dup (A), PKD1:c.2180T>C (B), and PKD1:c.8161+1G>A (C). Pseudogenes were aligned to PKD1 and those homologous to the displayed region were shown in the IGV plots. The dotted boxes highlighted regions with microgene conversion.
LRS also detected two small deletions of PKD1:c.-49_+43del and PKD1:c.2985+2_2985+4del, and one small duplication of PKD1:c.10709_10760dup in three individual samples (Fig. 3A–C). These three variants were missed by traditional SRS due to limited read length or low coverage in specific regions. Of note, LRS also identified a benign 34-bp duplication of PKD1:c.11713-30_11713-63dup in sample KPK007 (Fig. 3C). Further analysis showed that this region had a variable number of tandem repeat and occurred in 92.5% (37/40) of the samples (Supplementary Fig. 2D).

A–C IGV plots of LRS CCS reads and SRS reads showing PKD1:c.-49_43del (A), PKD1:c.2985+2_2985+4del (B), and PKD1:c.10709_10760dup (C). D IGV plots of LRS CCS reads and SRS reads showing two deep intronic variants, PKD1:c.1607-76C>T and PKD1:c.2908-107G>A. E Amplification of cDNA showing the existence of an alternative transcript caused by the variant PKD1:c.2908-107G>A. F Diagram showing the transcription of 111-bp pseudoexon led to inframe insertion of 37 amino acids caused by the variant PKD1:c.2908-107G>A. G The pedigree, phenotypes and genotypes of the family of KPK008 with the variant PKD1:c.2908-107G>A. H, I IGV plots of CCS reads showing the phasing the three variants in KPK009 (H) and KPK010 (I).
In addition, LRS identified two deep intronic variants, PKD1:c.1607-76C>T in patient KPK036 and PKD1:c.2908-107G>A in patient KPK008 (Fig. 3D). The SRS coverage of the PKD1:c.2908-107G>A region in patient KPK008 was only 15x (Fig. 3D), which hampered the calling of the variant. RT-PCR sequencing proved that PKD1:c.1607-76C>T did not affect the splicing and was a likely benign variant (Supplementary Fig. 2G). However, RT-PCR analysis revealed that PKD1:c.2908-107G>A created a new splice acceptor site, leading to the inclusion of a 111-nucleotide pseudoexon. This aberrant splicing event results in an inframe insertion of 37 amino acids and premature termination codon (Fig. 3E, F). Moreover, pedigree analysis of 15 family members from three generations showed PKD1:c.2908-107G>A was likely pathogenic because the variant was co-segregated with ADPKD phenotype within the family (Fig. 3G).
Both LRS and SRS identified the variant PKD1:c.12048C>T in patient KPK035 (Table 1). Although this was synonymous variant, RT-PCR analysis showed the variant affected splicing by creating a new exonic splice enhancer site. This led to a 92-bp deletion transcript and resulted in a frameshift (Supplementary Fig. 3A, B). In addition, this variant was also co-segregated with ADPKD phenotype through pedigree analysis (Supplementary Fig. 3C). Thus, PKD1:c.12048C>T was reclassified as a pathogenic variant by considering the newly added evidence.
LRS can perform the phasing analysis for SNVs/indels. In patient KPK009, the variants of PKD1:c.10984C>T and c.11712+81_11713-100del were found to be located on one allele, while variant c.12408G>T was located on the other allele (Fig. 3H). LRS also determined variants PKD1:c.8949-14C>G, c.9193G>A and c.9789G>T were in cis-configuration in patient KPK010 (Fig. 3I), which has been reported in another ADPKD patient27. Considering the effect of hypomorphic variants in PKD1 gene, the compound heterozygous variants generally cause more severe manifestations37,38. Therefore, phasing analysis can enrich the mutational spectrum of ADPKD genes and serve as a reference for future patients.
LRS detections for large deletions and duplications in PKD1
Six large deletions in PKD1 were identified by SRS and confirmed by MLPA (Table 1, Supplementary Fig. 4A–F). Besides these six deletions (Fig. 4A–C), LRS identified two more deletions in two samples (Fig. 4D, E), which were also confirmed by MLPA (Supplementary Fig. 4G, H). Moreover, LRS was able to precisely determine the breakpoints of these eight large deletions in CNVs.

A–E IGV plots of CCS reads showing the deletions in KPK013, KPK014, and KPK015 (A), KPK016 and KPK017 (B), KPK018 (C), KPK011 (D), and KPK012 (E). The purple and blue boxes represented two alleles, and the purple alleles contained the deletions.
SRS and MLPA can detect the duplication of exons 43 and 44 in PKD1 (Fig. 5A). However, the exact sequence and inserted position of these duplications cannot be determined by traditional sequencing methods. LRS demonstrated that the duplication was a 578-bp sequence (hg38 chr16:2,090,688-2,091,265) encompassing partial intron 42, exon 43, intron 43, and partial exon 44 (Fig. 5B, C). The breakpoint of duplication was validated by Sanger sequencing (Fig. 5D). RT-PCR analysis showed that the duplication led to an alternative transcript with duplication of exon 43 and thus an inframe insertion of 97 amino acids with skipping the duplicated partial exon 44 (Fig. 5C, E, F). Therefore, LRS can directly detect large duplications in PKD1 at single-nucleotide resolution. In addition, this duplication was found to co-segregate with ADPKD phenotype in a three-generation pedigree (Fig. 5G).

A MLPA showing the duplication of probes targeting exons 43 and 44 of PKD1 in KPK019. B IGV plots of CCS reads showing the 578-bp duplication (chr16:2,090,688-2,091,265) encompassing partial intron 42, exon 43, intron 43 and partial exon 44 in KPK019. C Diagram showing the duplication arrangement. The arrows indicated the design of primers of cDNA analysis. D Sanger sequencing validated the breakpoints of duplication identified by LRS. E Amplification of cDNA showing the existence of an alternative transcript caused by the 578-bp duplication. F Sanger sequencing of the cDNA showing the duplicated transcription of exon 43, and the partially duplicated exon 44 was skipped. G The pedigree, phenotypes and genotypes of the family of KPK019 with the 578-bp duplication.
Discussion
For the past eight years, our assisted reproductive center has utilized SRS panel for genetic testing of 312 ADPKD patients. Compared to SRS panel, targeted LRS additionally identified eight P/LP SNVs/indels and two P/LP CNVs in PKD1, as well as determined single-nucleotide information for all the CNVs. Our study demonstrated the significant advantages of using long-read sequencing for the genetic diagnosis of ADPKD, particularly in cases where conventional SRS approaches have failed to provide a definitive diagnosis. The ability of LRS to span large genomic regions and resolve complex structural variations has allowed us to identify a spectrum of variants that were previously undetectable or difficult to characterize. The improved diagnostic yield of LRS for ADPKD patients is particularly important for assisted reproductive treatments since genetic diagnosis is required for those who seek preimplantation genetic testing for monogenetic diseases (PGT-M) to lower the pregnancy risk.
The identification of microgene conversions between PKD1 and its pseudogenes is particularly noteworthy to utilize LRS approach. These events, which involve the transfer of genetic information from pseudogenes to the functional PKD1 gene, can be easily missed by SRS technologies due to the high sequence similarity between PKD1 and its pseudogenes7. In the past, microgene conversions were generally detected by short PCR followed by Sanger sequencing, which could lead to drop-out of variants with microgene conversions. In this study, LRS was used to identify four microgene conversions ranging from 200 to 1000 bp that were missed by SRS. Our results highlighted the importance of considering such mechanisms in the pathogenesis of ADPKD and underscored the requirement for sequencing technologies that can accurately distinguish between the functional gene and its pseudogenes.
Although various bioinformatics pipelines have been developed to call SNVs/indels from SRS data, accurate detection of indels over 50 bp is still very challenging27,39,40. Many partially mapped reads of these large indels can be lost in unmatched fragments27,39,40. In this cohort study, SRS panel failed to detect two intermediate sizes of indels including PKD1:c.-49_43del and PKD1:c.10709_10760dup. Surprisingly, SRS also failed to detect a 3-bp deletion PKD1:c.2985+2_c.2985+4del. Manual inspection on the original SRS data suggested the presence of 3-bp deletion variant. However, the sequencing depth was only 19x in this specific area, and 20x sequencing depth is generally required to make a call in the bioinformatics pipeline, which is a common issue for large SRS panels. In SRS, the quality control for average sequencing depth is usually acceptable, but it does not guarantee the sequencing depth in each specific locus. The targeted LRS assay utilized full-length reads of each amplicon to do variant calling, therefore all the regions within the coverage can be successfully analyzed with ≥30x coverage.
In recent years, more and more disease-causing deep intronic variants have been discovered due to the rapid development of sequencing technologies41,42. Such variants can be easily overlooked by exon-focused sequencing approaches but may have significant implications for disease pathogenesis43. In this study, LRS identified two novel deep intronic variants PKD1:c.1607-76C>T and PKD1:c.2908-107G>A that were undetectable in SRS panel. RT-PCR analysis showed that PKD1:c.1607-76C>T did not affect the splicing, but PKD1:c.2908-107G>A led to the inclusion of a 111-nucleotide pseudoexon with an inframe insertion of 37 amino acids. Pedigree analysis proved PKD1:c.2908-107G>A was co-segregated with ADPKD phenotype and was a likely pathogenic variant. The identification of the c.2908-107G>A variant and its effect on splicing illustrated the potential of LRS to expand our understanding of the mutational spectrum in ADPKD.
Since the majority of PKD1 and PKD2 variants are exclusive to single families, novel and VUS variants can be identified in a cohort of ADPKD patients25,26,27. Precise genetic diagnosis is required for PGT-M to select embryos without disease-causing variants, therefore functional and pedigree analysis are critical to accumulate evidence to determine the pathogenicity of each variant according to the AMCG guidelines. Here, we found that the synonymous variant PKD1:c.12048C>T caused a 62-bp deletion transcript and thus frameshift of translation by RT-PCR. In combination of co-segregation analysis, the pathogenicity of this variant was upgraded from VUS to pathogenic. Moreover, LRS can determine the cis and trans-configuration of variants within the same PCR amplicon without the need for pedigree analysis.
Besides SNVs/indels, SRS has been gradually and widely used for CNV analysis44,45. In our study, LRS identified two more PKD1 CNVs compared to SRS, including one deletion encompassing exon 44 to 46 and another deletion encompassing exon 1 to upstream regions. This highlighted the superior sensitivity of LRS for CNV detection in complex genomic regions. The improved detection of CNVs by LRS addressed a significant limitation of SRS-based approaches. SRS typically relies on read depth analysis to infer CNVs, which can be challenging in regions with pseudogenes or repetitive sequences46. In addition, the precise determination of breakpoints by LRS offered valuable insights into the molecular mechanisms underlying these variants, which is crucial for understanding genotype-phenotype correlations and may have implications for predicting disease severity47.
The improved diagnostic yield achieved by LRS in our study (25% of previously undiagnosed cases and 3.2% of all cases) has significant clinical implications. Precise genetic counseling to patients and their families can allow for informed decision-making regarding family planning and genetic testing of at-risk relatives48. Furthermore, preimplantation genetic testing for couples undergoing assisted reproduction can potentially reduce the transmission of ADPKD to future generations49. The major limitation of SMRT LRS technology is the high cost for instrument and sequencing50. However, with the development of more cost-effective benchtop instruments to decrease the overall sequencing costs, LRS technology would have better clinical feasibility in the near future.
Future applications of LRS technology should focus on several directions. First, integrating LRS into routine clinical genetic testing for ADPKD, including the development of standardized protocols and bioinformatics pipelines optimized for PKD1 and PKD2 analysis. Second, investigating the utility of LRS in other genetically complex disorders, particularly those involving large genes, pseudogenes, or repetitive regions. Third, developing improved methods for functional characterization of novel variants identified by LRS, including high-throughput assays for assessing the impact of deep intronic or regulatory variants.
Our study demonstrated that targeted long-read sequencing enabled a higher diagnostic yield for ADPKD through accurate and precise genetic analysis of SNVs, indels, and CNVs in PKD1 and PKD2. This approach has significant implications for improving genetic diagnosis, particularly in cases where conventional sequencing methods have been inconclusive. As LRS technologies continue to evolve and become more accessible, their integration into routine clinical practice has the potential to improve genetic counseling and offer preimplantation genetic testing for more ADPKD patients.
Methods
Study participants
From January 2016 to December 2023, 312 patients with clinical diagnosis of ADPKD have undergone genetic testing at our assisted reproductive center using a targeted SRS panel, which included thousands of kidney disease-related genes such as PKD1, PKD2, PKHD1 and HNF1B. The pathogenicity of SNV/indels was classified according to the American College of Medical Genetics and Genomics guidelines51. From this cohort, a total of 272 patients were genetically diagnosed with pathogenic (P) or likely pathogenic (LP) SNVs/indels, including 239 cases with variants in PKD1, 30 cases with variants in PKD2, and 3 cases with variants in HNF1B (Fig. 1). The remaining 40 patients were either genetically undiagnosed or diagnosed without single-nucleotide resolution at the time of enrollment in our study, which included 18 cases with variants of uncertain significance (VUS) in PKD1, 7 cases with PKD1 CNVs, and 15 cases with no identified variants (Fig. 1). Genomic DNA from these 40 patients were sent to Berry Genomics Corporation for genetic analysis of PKD1 and PKD2 with a targeted LRS approach (Fig. 6). This study adhered to the Declaration of Helsinki and was approved by the institutional review board of Center for Reproductive Medicine at Shandong University. Informed written consent was obtained from all the participants.

A PCR design for PKD1 and alignment of six pseudogenes (PKD1P1-P6) to PKD1. The PKD1P1–P6 were individually aligned to PKD1 to show the sequence difference, as indicated by vertical horizontal lines. The green, red, blue, orange, and purple vertical lines represented A, T, C, G, and insertions, respectively. The horizontal lines represented deletions. B PCR design for PKD2. GF forward gap primer, GR reverse gap primer.
ADPKD genetic diagnosis by SRS
Genomic DNA from peripheral blood was extracted using the Blood DNA extraction kits (ZEESAN, China). Targeted SRS, with IDT xGen Exome Research Panel (Integrated DNA Technologies, USA), was performed using xGen SRS Hybridization Capture (Integrated DNA Technologies, USA) and sequencing was performed on the NovaSeq 6000 platform (Illumina, USA). High-quality sequencing reads were selected and aligned to the reference genome hg19 using the BWA algorithm with default settings52. SNVs and indels were called by GATK53. Copy-number variations (CNVs) were determined as previously described54. For samples with SNVs/indels identified by SRS, Sanger sequencing was performed to confirm the variants. For samples with CNVs in PKD1 and PKD2 identified by SRS, MLPA analysis was performed to confirm the CNVs (MRC-Holland, the Netherlands) using probemix P351 and P352 PKD1–PKD2.
ADPKD genetic diagnosis by LRS
Targeted LRS for PKD1 and PKD2 genetic analysis was performed similarly as previously described27. Genomic DNA was subjected to multiplex LR-PCR in 50-μL reactions containing 10–100 ng of genomic DNA, 1 x PCR buffer for KOD FX Neo, 0.4 mM of each dNTP, 1 μM of primer mixture and 1 μL of KOD FX Neo (Toyobo, Japan). PCR cycling conditions were 94 °C for 5 min (1 cycle), 98 °C for 15 s and 68 °C for 12 min (32 cycles) and 68 °C for 10 min (1 cycle). The PacBio single-molecule real-time dumbbell (SMRTbell) libraries were prepared by a one-step end-repair and ligation reaction to add barcoded adapters, followed by digestion with exonucleases to remove failed ligated DNA. The uniquely barcoded libraries were purified, quantified and then pooled with equal mass. SMRTbell sequencing library was prepared using the Sequel II Binding Kit 3.2 (Pacific Biosciences, USA) and sequenced under circular consensus sequencing (CCS) mode with Sequel IIe platform (Pacific Biosciences, USA) for 30 h. After sequencing, the raw subreads were converted to high-fidelity CCS reads, debarcoded and aligned to reference genome build hg38 in the SMRT Link analysis software suite (version 10.1.0.119588, Pacific Biosciences, USA). The average yield of CCS reads per run was approximately two million. Up to 96 LRS libraries for ADPKD were pooled for sequencing in one run, and the average CCS read number was 20,000. The aligned CCS reads were then subjected to an in-house developed bioinformatics pipeline to identify SNVs/indels, deletions and duplications (Fig. 6A, B)27. The hg38-aligned CCS reads were then filtered to obtain reads with primer sequences used in the panel by blasting to remove misaligned reads55. For the study participants, the average coverage of PKD1 was 1221x (range: 138–3920x), and the average coverage of PKD2 was 922x (range: 83–5378x). For CCS reads with full-length fragments A-L, SNVs and indels of PKD1/2 were called by FreeBayes1.3.4 with read depth ≥30 (Biomatters, Inc., San Diego, CA). For other CCS reads, kernel density estimation method was applied to identify peaks of reads with deletions or duplications. The exact breakpoints of deletions or duplications were determined by pysam and displayed in the Integrative Genomics Viewer (IGV)56. The CCS reads of representative variants were displayed in the Integrative Genomics Viewer (IGV). The pathogenicity of variants identified by LRS was classified according to the American College of Medical Genetics and Genomics guidelines51.
Validation of variants additionally detected by LRS
Sanger sequencing was performed to validate discordant SNVs/indels between LRS and SRS, with primers listed in Supplementary Table 1. Moreover, MLPA was utilized to confirm the CNVs additionally identified by LRS.
Identification of splicing junctions by RT-PCR sequencing
For participants with variants that could potentially disrupt mRNA splicing, total RNA was extracted from peripheral blood using RNAiso Plus (Takara, Japan). cDNA was synthesized using PrimeScript™ II 1st Strand cDNA Synthesis Kit (Takara, Japan) according to the manufacturer’s instructions. PCR amplification was performed using primers flanking the putative splicing junctions, and products were analyzed by Sanger sequencing to identify the exact junction sites (Supplementary Table 1).

Responses