Targeting USP8 causes synthetic lethality through degradation of FGFR2 in ARID1A-deficient ovarian clear cell carcinoma

Introduction
ARID1A (AT-rich interacting domain-containing protein 1 A) is a subunit of the SWI/SNF chromatin remodeling complex1, which alters chromatin structure in an ATP-dependent manner to regulate the binding of DNA-binding proteins such as transcription factors; as such, it plays a major role in transcription, replication, and repair2. It is thought that the loss of ARID1A suppresses transcription of various genes, leading to overactivation of oncogenes and suppression of tumor suppressor genes3,4,5. Thus, the ARID1A gene is considered a tumor suppressor gene.
Various types of cancer are deficient in ARID1A, including gynecological cancers, such as the sub-type of ovarian cancer (clear cell carcinoma), and gastrointestinal cancers, such as stomach cancer, bile duct cancer, and pancreatic cancer4. Ovarian clear cell carcinoma (OCCC) differs from high-grade serous ovarian carcinoma, which constitutes the majority of ovarian cancer subtypes, in that it has a low response rate to standard chemotherapy, including platinum-based agents, and is known for its resistance to treatment6,7. OCCC is more common in East Asia but rare in Western countries8. Because of this disparity, it has not been included in large-scale clinical trials for ovarian cancer, leading to insufficient development of new treatments.
ARID1A deficiency is not lethal but is lethal when coexistent with other gene deficiencies, a phenomenon known as “synthetic lethality,” an area being explored in therapeutic development. Our research group discovered that ARID1A-deficient OCCC cells have low intracellular glutathione levels, which protects against oxidative stress. Previously, we found that inhibiting the action of glutathione with the clinical trial drug APR-246 led to an excess of reactive oxygen species, thereby inducing synthetic lethality4,9. Furthermore, other research groups reported that inhibiting EZH2 (Enhancer of zest homolog 2), a histone methyltransferase, increased expression of PIK3IP1, which suppresses the PI3K/AKT pathway in ARID1A-deficient cells, thereby inhibiting cell proliferation10. ARID1A deficiency results in an incomplete DNA damage response, making cells sensitive to PARP (Poly ADP-ribose polymerase) inhibitors, which play a crucial role in DNA repair11. ARID1A-deficient cells undergo apoptosis when ATR (ataxia telangiectasia and Rad3-related) is inhibited due to inhibition of the DNA damage response12. ARID1A deficiency increases transcription of AURKA (Aurora kinase A), thereby promoting cell proliferation; indeed, AURKA inhibitors show synthetic lethality in ARID1A-deficient colorectal cancer cells13. Thus, ARID1A-deficient cancer cells have various dependencies and vulnerabilities, and finding their weaknesses is expected to lead to discovering new therapeutic targets. Although these inhibitors are still at the clinical trial stage, they are expected to be used for clinical applications in the future.
Deubiquitinating enzymes (DUBs) cleave ubiquitin proteins, or ubiquitin-like proteins such as SUMO and NEDD8, from their substrate proteins. There are approximately 100 types of DUBs in humans14. These enzymes are crucial in negatively regulating cellular responses mediated by ubiquitination. They do this by controlling processes such as protein degradation and activation of signal transduction. DUBs also induce cancer and neurological disorders, making them attractive targets for drug discovery. One deubiquitinating enzyme, USP8 (Ubiquitin-specific protease 8), is a key enzyme in cell growth regulation and cancer progression. Specifically, it regulates the stability of critical receptor tyrosine kinases such as EGFR (Epidermal Growth Factor Receptor), thereby inhibiting excessive signal transduction15,16. Dysfunction of USP8 is associated with the development of malignancies; thus, USP8 has garnered attention as a novel therapeutic target17. For example, inhibiting USP8 has antitumor effects against breast cancer, non-small cell lung cancer, and malignant melanoma17,18,19.
This study aimed to identify synthetic lethality targets upon which ARID1A-deficient OCCC cells are highly dependent. By analyzing a database of dependency factors and limiting the analysis to ovarian cancer cell lines only (from over 1000 cancer cell lines), we identified the deubiquitinating enzyme USP8 as a synthetic lethality target for ARID1A-deficient cancers. We then evaluated its therapeutic potential.
Results
Identification of USP8 as a synthetic lethal target in ARID1A-deficient OCCC
To identify synthetic lethal targets in ARID1A-deficient OCCC cells, we utilized the DepMap portal database (https://depmap.org/portal/achilles/), which has cataloged dependency factors in over 1000 cancer cell lines. We selected ARID1A-proficient and ARID1A-deficient ovarian cancer cell lines based on their genetic mutations and cancer type information. Furthermore, we examined the growth dependency of 17,309 genes based on the gene inhibition-dependency information for each cell line. Using the DepMap database, we calculated the dependency index by determining the difference between the dependency scores for ARID1A-deficient ovarian cancer cells and those for ARID1A-proficient ovarian cancer cell lines (Fig. 1A). The criterion for selecting candidate synthetic lethal targets was a dependency index of ≤0.3. This procedure identified four candidate genes as synthetic lethal targets: USP8, ARID1B, EGLN1, and EEF1A1 (Fig. 1A, B). To revalidate the synthetic lethality of the candidate genes, we used siRNA to knockdown these four genes in ARID1A-proficient RMG-I OCCC cells and ARID1A-deficient OVISE OCCC cells (Fig. 1C). USP8 knockdown decreased the viability in ARID1A-deficient cells but did not affect that of ARID1A-proficient cells (Fig. 1C). In other words, USP8 was reconfirmed as a synthetic lethal gene in ARID1A-deficient OCCC cells; however, we could not reconfirm synthetic lethality for the other candidate genes (Fig. 1C). We ascertained that these results are not because of a lack of efficient knockdown of some of these genes (Supplementary Fig. 1A–D). In addition, we constructed a cell line panel derived from OCCC cell lines to further validate the result in multiple cell lines (Fig. 1D). We investigated multiple cell lines to verify the synthetic lethality of USP8 suppression in numerous cell lines. We knocked down USP8 in ARID1A-proficient (RMG-I, ES-2) and ARID1A-deficient (RMG-V, OVTOKO, OVISE) cell lines using siRNA. Immunoblotting confirmed that siRNA-mediated knockdown of USP8 decreased protein expression levels across all cell lines (Fig. 1E). USP8 knockdown had no significant impact on the viability of ARID1A-proficient ES-2 and RMG-I cells (Fig. 1F); there was a marked decrease in the viability of ARID1A-deficient RMG-V, OVTOKO, and OVISE cells (Fig. 1F). Validation using multiple siRNAs targeting different sequences within USP8 also confirmed that ARID1A-deficient RMG-V cells exhibited decreased viability upon USP8 knockdown (Supplementary Fig. 1E, F). These findings suggest that USP8 is a synthetic lethal target in ARID1A-deficient OCCC.

A The dependency index was calculated from the dependency gene database, and candidate synthetic lethal target genes were identified in ARID1A-deficient cells. B Dependency Scores for candidate genes in ARID1A-proficient and ARID1A-deficient cells. C Heatmap showing the viability of ARID1A-proficient RMG-I cells and ARID1A-deficient OVISE cells after siRNA-mediated knockdown of candidate genes. Cells were transfected for 48 h with the indicated siRNAs, reseeded, and then transfected repeatedly with the indicated siRNAs for 48 h. The cells were then reseeded and incubated for 7 days. D Immunoblot analysis to detect expression of ARID1A, USP8, and β-actin in lysates of OCCC cell lines. E Immunoblot analysis to detect USP8, ARID1A, and β-actin expression in OCCC cell lines transfected with or without siRNAs for USP8. F Viability of OCCC cells upon siRNA-mediated knockdown of USP8. Cells were transfected for 48 h with the indicated siRNAs, reseeded, and then transfected repeatedly with the indicated siRNAs for 48 h. The cells were then reseeded and incubated for 7 days. Data are presented as the mean ± SEM (n = 5 independent samples). G, H Viability (G) and IC50 values (H) were calculated from the viability of ARID1A-proficient and ARID1A-deficient OCCC cells treated with the USP8 inhibitor DUB-IN-2. Cells were treated with inhibitors for 6 days, and IC50 values were calculated from the cell viability results. Data are presented as the mean ± SEM (n = 3 independent samples). For all experiments, p values were determined by an unpaired two-tailed Student’s t-test. *p < 0.05, **p < 0.01, ***p < 0.001.
Next, we evaluated the efficacy of the USP8 inhibitor (DUB-IN-2) in ARID1A-deficient OCCC. Sensitivity to USP8 inhibitors was higher in ARID1A-deficient cells (RMG-V, OVTOKO, OVISE) than in ARID1A-proficient cell lines (ES-2 and RMG-I) (Fig. 1G). The IC50 values of the USP8 inhibitor in the ARID1A-deficient cell group (RMG-V, OVTOKO, OVISE) were significantly lower than that in the ARID1A-proficient cell group (ES-2 and RMG-I) (Fig. 1H). This suggests that the USP8 inhibitor exhibits selectivity for ARID1A-deficient OCCC. We then performed similar validations using promising clinical trial candidate drugs that also show selectivity for ARID1A-deficient cancers, including an EZH2 inhibitor (Tazemetostat)10, an EZH1/2 inhibitor (Valemetostat)10, PARP inhibitors (Olaparib, Talazoparib)11, an ATR inhibitor (Berzosertib)12, and an AURKA inhibitor (Alisertib)13 (Supplementary Fig. 1G–L). While all ARID1A-deficient OCCC cell lines tended to be sensitive to all of these inhibitors (Supplementary Fig. 1G–L), they were susceptible to the USP8 inhibitor (Fig. 1G, H). In addition, USP8 inhibitor sensitivity was enhanced when ARID1A knockdown was combined with a USP8 inhibitor in the ARID1A-proficient RMG-I cell line (Supplementary Fig. 1M, N). These results suggest that the USP8 inhibitor is a more promising therapeutic agent for ARID1A-deficient OCCC than existing clinical trial drugs.
Figure 1D shows that USP8 protein expression tended to be lower in ARID1A-deficient cells than in ARID1A-proficient cells; however, when we examined the expression of USP8 mRNA in ARID1A-proficient cells and ARID1A-deficient cells, we found no difference (Supplementary Fig. 1O). Next, we used the proteasome inhibitor MG132, the protein synthesis inhibitor cycloheximide (CHX), and the lysosome inhibitor Lys05 to investigate whether ARID1A deficiency is related to the stabilization or synthesis of USP8 protein. USP8 protein levels showed little change upon treatment with MG132 or CHX (Supplementary Fig. 1P, Q). Treatment with Lys05 in ARID1A-proficient RMG-I cells did not affect USP8 expression levels (Supplementary Fig. 1R). On the other hand, treatment with Lys05 was found to increase USP8 expression levels in ARID1A-deficient RMG-V and OVTOKO cell lines (Supplementary Fig. 1R). These results suggest that the tendency for USP8 expression levels to be low in ARID1A-deficient cells is due to the enhancement of the lysosomal pathway. Therefore, low expression of USP8 in ARID1A-deficient OCCC cells may be a point of vulnerability.
Suppressing USP8 in the ARID1A-deficient OCCC xenograft model exerts antitumor effects
The Tet-on system was used to establish doxycycline-inducible USP8 knockdown cells that express shUSP8 and GFP (Green Fluorescent Protein) endogenously when exposed to doxycycline. Thus, drug-inducible USP8 suppression was engineered into ARID1A-proficient RMG-I cells and ARID1A-deficient OVISE cells (Supplementary Fig. 2A). Suppression of USP8 expression had almost no impact on the viability of ARID1A-proficient cells, as indicated by the percentage of GFP-positive cells (Fig. 2A). By contrast, ARID1A-deficient cells exhibited reduced viability and sustained growth inhibition (Fig. 2B). To investigate the antitumor effects in a mouse xenograft model, we transplanted ARID1A-deficient OVISE cells with (shUSP8) or without (shNT) doxycycline-inducible suppression of USP8 subcutaneously into immunodeficient mice and examined the antitumor effects. There was no antitumor effect in the shNT model (Fig. 2C, D, Supplementary Fig. 2B); however, there was a marked antitumor effect in the shUSP8 model (Fig. 2E, F, Supplementary Fig. 2B). Therefore, USP8 is also a synthetic lethal target in ARID1A-deficient OCCC in vivo.
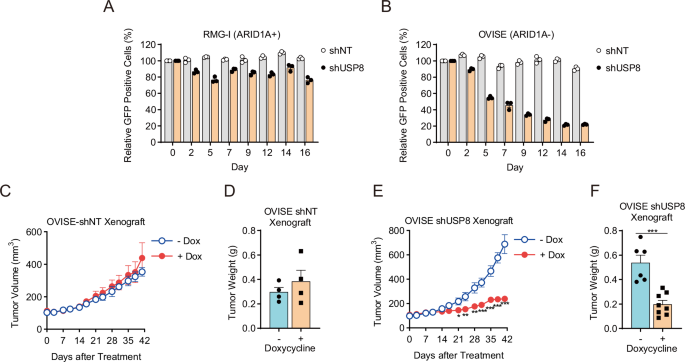
A, B Viability of ARID1A-proficient RMG-I-shNT and RMG-I-shUSP8 cells (A) and ARID1A-deficient OVISE-shNT and OVISE-shUSP8 (B) cells treated with 1 μg/mL Dox. Cells were treated with 1 μg/mL Dox for 48 h, and GFP-positive cells were detected (Day 0). Then, every 2–3 days, the cells were reseeded and treated with 1 μg/mL Dox, and GFP-positive cells were detected again. The percentage of GFP-positive cells relative to that on Day 0 was calculated to measure cell viability. Data are presented as the mean ± SEM (n = 3 independent samples). C, D Tumor volume (C) and tumor weight (D) of xenografts derived from ARID1A-deficient OVISE-shNT cells isolated from mice treated without or with Dox. Data are presented as the mean ± SEM: -Dox (n = 4 biologically independent mice per group), +Dox (n = 4 biologically independent mice per group). E, F Volume (E) and weight (F) of tumor xenografts derived from ARID1A-deficient OVISE-shUSP8 cells harvested from mice treated without or with Dox. Data are presented as the mean ± SEM: -Dox (n = 6 biologically independent mice per group), +Dox (n = 8 biologically independent mice per group).
Suppression of USP8 in ARID1A-deficient OCCC cells induces apoptosis
Next, we used flow cytometry to investigate the impact of USP8 suppression on the cell cycle of ARID1A-deficient OCCC. Knockdown of USP8 by siRNA increased the ARID1A-deficient RMG-V cells in the sub-G1 phase, with no detectable change in ARID1A-proficient RMG-I cells (Fig. 3A–C). Treatment with the USP8 inhibitor (DUB-IN-2) increased the percentage of ARID1A-deficient RMG-V and OVTOKO cells in the sub-G1 phase but not that of ARID1A-proficient RMG-I cells (Fig. 3D–G). Furthermore, both siRNA-mediated USP8 suppression and the USP8 inhibitor increased the percentage of Annexin V-positive ARID1A-deficient OCCC cells (Fig. 3H, I). Additional apoptosis biomarkers, including cleaved caspase 3/7, NOXA, and BIM, were also elevated by the USP8 inhibitor (Supplementary Fig. S3A–C). These data suggest that synthetic lethality induced by suppressing USP8 in ARID1A-deficient OCCC cells is mediated by triggering apoptosis.
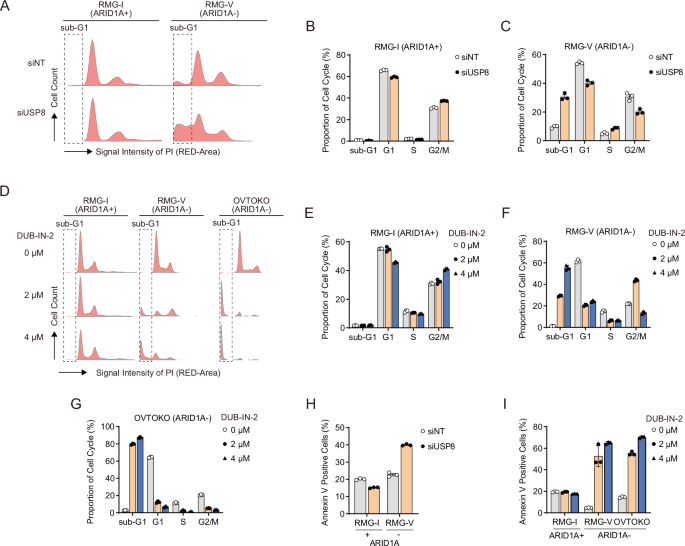
A Cell cycle distribution of ARID1A-proficient RMG-I cells and ARID1A-deficient RMG-V cells subjected to siRNA-mediated knockdown of USP8 for 96 h. B, C Cell cycle profile of ARID1A-proficient RMG-I cells (B) and ARID1A-deficient RMG-V cells (C) subjected to siRNA-mediated USP8 knockdown for 96 h. Data are presented as the mean ± SD (n = 3 independent samples). D Cell cycle distribution of ARID1A-proficient RMG-I cells and ARID1A-deficient RMG-V and OVTOKO cells treated for 24 h with the USP8 inhibitor DUB-IN-2. E–G Cell cycle profile of ARID1A-proficient RMG-I cells (E) and ARID1A-deficient RMG-V cells F and OVTOKO cells G treated for 24 h with DUB-IN-2. Data are presented as the mean ± SD (n = 3 independent samples). H Percentage of Annexin V-positive ARID1A-proficient RMG-I cells and ARID1A-deficient RMG-V cells after siRNA-mediated knockdown of USP8 for 96 h. Data are presented as the mean ± SD (n = 3 independent samples). I Percentage of Annexin V-positive ARID1A-proficient RMG-I cells and ARID1A-deficient RMG-V and OVTOKO cells after treatment for 24 h with the USP8 inhibitor DUB-IN-2. Data are presented as the mean ± SD (n = 3 independent samples).
Suppression of USP8 in ARID1A-deficient OCCC cells leads to the degradation of FGFR2
As a deubiquitinating enzyme, USP8 contributes to protein stabilization by deubiquitinating its target proteins16. However, when USP8 is suppressed, degradation of target proteins is thought to occur via ubiquitination. To identify proteins that undergo proteolysis upon suppressing USP8, we used an antibody array capable of detecting the ubiquitination level of 49 ubiquitin-related proteins (Fig. 4A, B). Treatment of ARID1A-deficient RMG-V cells with the USP8 inhibitor (DUB-IN-2) induced ubiquitination of seven proteins: ER alpha, COX2, p21, FBX15, EGFR, HSP90, and FGFR2 (Fig. 4A, B). To evaluate whether proteolysis of these proteins is induced by suppression of USP8, we examined changes in the expression of these proteins in ARID1A-proficient and ARID1A-deficient cells treated with a USP8 inhibitor (Fig. 4C, Supplementary Fig. 4A). No significant impact on the expression of FGFR2 and EGFR proteins was observed in ARID1A-proficient RMG-I cells (Fig. 4C); however, the USP8 inhibitor induced a dose-dependent decrease in the expression of FGFR2 and EGFR in ARID1A-deficient RMG-V and OVTOKO cells, with the reduction in FGFR2 being particularly pronounced (Fig. 4C). Expression levels of p21, HSP90, COX2, FBX15, and ER alpha did not fall significantly in either ARID1A-proficient or ARID1A-deficient cells exposed to the USP8 inhibitor (Supplementary Fig. 4A). Additionally, siRNA-mediated knockdown of USP8 did not impact the expression of FGFR2 and EGFR levels in ARID1A-proficient RMG-I cells (Fig. 4D). FGFR2 protein expression fell upon USP8 knockdown in ARID1A-deficient RMG-V cells, but that of EGFR protein did not (Fig. 4D). FGFR2 and EGFR protein expression decreased upon USP8 knockdown in ARID1A-deficient OVTOKO cells (Fig. 4D). These results suggest that suppressing USP8 in ARID1A-deficient cell lines enhances the degradation of FGFR2 but not EGFR.
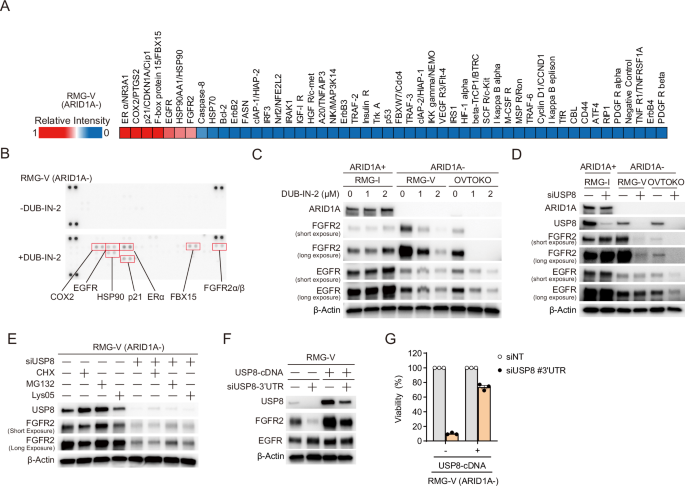
A Heatmap showing the signal intensity of ubiquitinated proteins (relative to that of an ERα protein) in ARID1A-deficient RMG-V cells treated for 6 h with 2 μM DUB-IN-2 (a USP8 inhibitor). B Immunoblot analysis to detect ubiquitinated proteins in protein microarrays derived from ARID1A-deficient RMG-V cells treated for 6 h with 2 μM DUB-IN-2. C Immunoblot analysis to detect ARID1A, EGFR, FGFR2, and β-actin in lysates of ARID1A-proficient RMG-I cells and ARID1A-deficient RMG-V and OVTOKO cells treated for 6 h with 2 μM DUB-IN-2. D Immunoblot analysis to detect ARID1A, USP8, EGFR, FGFR2, and β-actin in lysates from ARID1A-proficient RMG-I cells and ARID1A-deficient RMG-V and OVTOKO cells subjected to siRNA-mediated knockdown of USP8 for 96 h. E Immunoblot analysis to detect USP8, FGFR2, and β-actin in lysates from ARID1A-deficient RMG-V cells subjected to siRNA-mediated knockdown of USP8 and protein synthesis inhibitor, proteasome inhibitor, and lysosome inhibitor. Cells were transfected for 48 h with the siRNAs for USP8, reseeded for 24 h, and then treated with CHX, MG132, or Lys05 for 4 h. F Immunoblot analysis to detect USP8, FGFR2, EGFR, and β-actin in lysates from ARID1A-deficient RMG-V mock cells and RMG-V + USP8 cells subjected to siRNA-mediated knockdown of USP8 for 96 h. G Viability of ARID1A-deficient RMG-V mock cells and RMG-V + USP8 cells subjected to siRNA-mediated knockdown of USP8. Cells were transfected for 48 h with the indicated siRNAs, reseeded, and then transfected repeatedly with the indicated siRNAs for 48 h. The cells were then reseeded again and incubated for 7 days. Data are presented as the mean ± SEM (n = 3 independent samples).
In the initial screening in Fig. 1A, FGFR2 was not identified as a synthetic lethal target candidate. When FGFR2 was suppressed in ARID1A-proficient cells RMG-I and ARID1A-deficient cells RMG-V and OVTOKO (Supplementary Fig. 4B), cell proliferation was suppressed not only in ARID1A-deficient cells but also in ARID1A-proficient cells (Supplementary Fig. 4C), indicating that synthetic lethality was not shown. On the other hand, when USP8 is suppressed, the protein expression of FGFR2 is not affected in ARID1A-proficient cells. Still, the protein expression of FGFR2 is decreased in ARID1A-deficient cells (Fig. 4D), which is considered necessary for demonstrating synthetic lethality.
Pre- and post-transcriptional effects were examined to investigate whether FGFR2 was a target for proteolysis in depletion upon USP8. There was no marked difference in FGFR2 expression between ARID1A-proficient cells and ARID1A-deficient cells (Supplementary Fig. 4D). First, the knockdown of USP8 did not significantly affect mRNA expression levels (Supplementary Fig. 4E). On the other hand, when USP8 was knocked down and then treated with the protein synthesis inhibitor CHX, the expression level of the FGFR2 protein slightly decreased (Fig. 4E, Lane 5 and 6). It is suggested that FGFR2 promotes proteolysis by suppressing USP8. Therefore, we examined whether the proteasome or lysosomal system mediates the proteolysis of FGFR2. When USP8 was suppressed, protein levels of FGFR2 increased slightly with treatment with the proteasome inhibitor MG132 (Fig. 4E, Lanes 5 and 7), and with treatment with the lysosomal inhibitor, Lys05 showed little effect (Fig. 4E, Lanes 5 and 8). These results suggest that FGFR2 undergoes proteolysis via the proteasome in depletion upon USP8.
Next, we conducted a rescue experiment of the USP8 gene to investigate whether the phenomenon of FGFR2 protein due to USP8 knockdown is a USP8-dependent effect. The siRNAs targeting the USP8 gene in the 3’ region (siUSP8-3’UTR) do not target the ectopically expressed USP8 (USP8-cDNA) as the USP8-cDNA does not include the 3’ area. The ectopically expressed USP8 in the ARID1A-deficient RMG-V cell line increased the amount of FGFR2, with little change in EGFR (Fig. 4F, lanes 1 and 3). In addition, the knockdown of endogenous USP8 suppressed the expression of FGFR2 (Fig. 4F, lanes 1 and 2), whereas ectopically expressed USP8 increased the amount of FGFR2 (Fig. 4F, lanes 2 and 4). Knockdown of endogenous USP8 reduced the viability of ARID1A-deficient cells, but lethality was avoided by ectopically expressed USP8 (Fig. 4G). FGFR2 signaling plays a role in cell survival and proliferation and can also drive tumor progression20. These data suggest that suppressing USP8 in ARID1A-deficient cell lines triggers the degradation of FGFR2, thereby inducing synthetic lethality.
In ARID1A-deficient cells, USP8 expression tended to be low (Fig. 1D). Therefore, we examined whether the expression level of USP8 affects survival. Overexpression of USP8 in the ARID1A-deficient cell line RMG-V did not affect cell proliferation (Supplementary Fig. 4F). Thus, low expression of USP8 in ARID1A-deficient cells does not affect cell survival, but low expression of USP8 may be the cause of vulnerability in ARID1A-deficient cells, as it tends to reflect the effects of USP8 suppression.
Suppressing USP8 in ARID1A-deficient OCCC cells attenuates the STAT3 signaling
Next, we investigated the mechanism of synthetic lethality by FGFR2 degradation through USP8 suppression in ARID1A-deficient cancers. First, a group of genes whose expression fluctuates due to a deficiency of ARID1A was extracted by comprehensive gene expression analysis using RNA sequencing. Furthermore, GSEA (Gene Set Enrichment Analysis) identified the molecular pathways associated with these genes (Fig. 5A), suggesting that the molecular pathways, such as cell proliferation, are aberrant in ARID1A-deficient cells. Among these molecular pathways, the IL6/JAK/STAT3 pathway, which has been reported as a downstream pathway of FGFR221,22, was identified (Fig. 5B). Therefore, we examined the effect of USP8 suppression on the phosphorylation of STAT3 (Tyr705), an indicator of activation in the IL6/JAK/STAT3 pathway. USP8 knockdown did not affect STAT3 phosphorylation in ARID1A-proficient RMG-I cells but attenuated STAT3 phosphorylation in ARID1A-deficient RMG-V and OVTOKO cells (Fig. 5C). Similar results were observed with treatment with the USP8 inhibitor DUB-IN-2 (Fig. 5D). It is suggested that inhibition of USP8 leads to suppressing the STAT3 pathway.
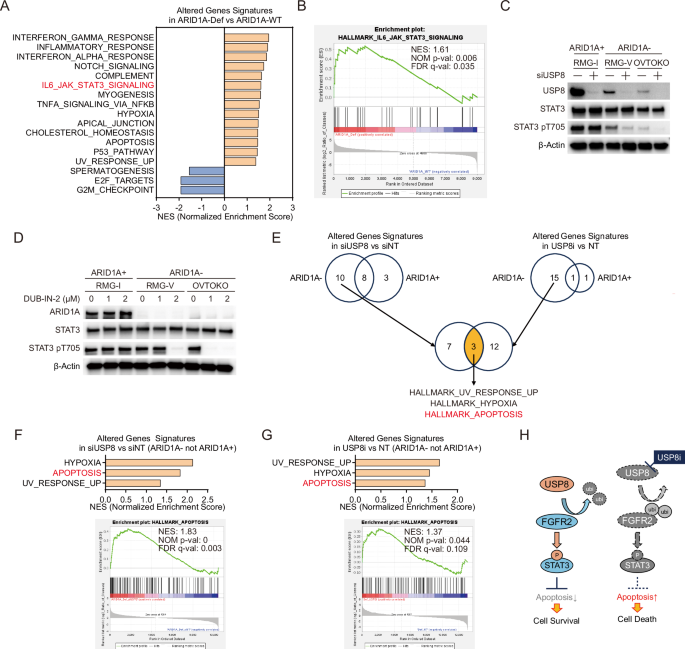
A Significantly enriched biological signaling signatures were identified only in ARID1A-deficient OCCC cells. Significantly enriched biological signaling signatures associated with gene sets altered in the ARID1A-deficient OCCC cell lines group (RMG-V and OVTOKO) compared to the ARID1A-proficient OCCC cell lines group (RMG-I and ES-2) were identified from the Molecular Signatures Database Hallmark Gene Set collection by Gene Set Enrichment Analysis (GSEA). Gene sets with an FDR (False Discovery Rate) q value < 0.25 and a Normal p-value < 0.05 were significantly enriched. P values were determined by an unpaired two-tailed Student’s t-test. Seventeen extracted signatures were detected. Normalized enrichment scores (NES) for significantly enriched biological signaling signatures were shown. B Enrichment plots for the IL6-JAK-STAT3 in the ARID1A-deficient OCCC cell lines group compared to the ARID1A-proficient OCCC cell lines group. C Immunoblot analysis to detect USP8, STAT3, phospho-STAT3 (pT705), and β-actin in lysates from ARID1A-proficient RMG-I cells, and from ARID1A-deficient RMG-V and OVTOKO cells subjected to siRNA-mediated knockdown of USP8 for 96 h. D Immunoblot analysis to detect ARID1A, STAT3, phospho-STAT3 (pT705), and β-actin in lysates from ARID1A-proficient RMG-I cells, and from ARID1A-deficient RMG-V and OVTOKO cells treated for 6 h with the USP8 inhibitor DUB-IN-2. E Significantly enriched biological signaling signatures were identified only in ARID1A-deficient OCCC cells upon USP8 suppression. Significantly enriched biological signaling signatures associated with gene sets altered in ARID1A-proficient OCCC cell lines and ARID1A-deficient OCCC cell lines group after knockdown of USP8 for 96 h or after treatment with 2 μM USP8 inhibitor DUB-IN-2 for 6 h were identified from the Molecular Signatures Database Hallmark Gene Set collection by GSEA. Gene sets with an FDR (False Discovery Rate) q value < 0.25 and a Normal p-value < 0.05 were significantly enriched. P values were determined by an unpaired two-tailed Student’s t-test. Ten extracted signatures were detected only in the ARID1A-deficient cell lines group upon USP8 knockdown. Fifteen extracted signatures were detected only in the ARID1A-deficient cell lines group upon USP8 inhibitor treatment. Three common signatures were identified in these signatures. F Normalized enrichment scores (NES) for significantly enriched biological signaling signatures upon knockdown of USP8 are shown. An enrichment plot for the HALLMARK_APOPTOSIS in ARID1A-deficient OCCC cell lines group upon knockdown of USP8 is shown. G Normalized enrichment scores (NES) for significantly enriched biological signaling signatures upon treatment with the USP8 inhibitor are shown. An enrichment plot for the HALLMARK_APOPTOSIS in ARID1A-deficient OCCC cell lines group upon treatment with the USP8 inhibitor is shown. H Model of the mechanism of action of USP8 inhibitors in ARID1A-deficient OCCC cells. USP8 stabilizes the FGFR2 protein by deubiquitination, thereby suppressing apoptosis via the downstream STAT3 signaling pathway; however, inhibiting USP8 increases ubiquitination of FGFR2, resulting in proteolysis of FGFR2 via the proteasome, attenuated downstream STAT3 signaling and, ultimately, apoptosis-mediated cell death.
On the other hand, we hypothesized that USP8 might also be involved in the deubiquitination of the IL6R. This membrane receptor acts upstream of STAT3 because USP8 regulates the deubiquitination of the membrane receptor FGFR2. Therefore, we investigated the effect of USP8 suppression on IL6R protein levels in ARID1A-deficient cells. Knockdown of USP8 (Supplementary Fig. 5A) or treatment with the USP8 inhibitor (Supplementary Fig. 5B) did not affect IL6R expression levels in ARID1A-deficient cells.
To investigate the molecular pathways affected by USP8 suppression, we next performed RNA sequencing to comprehensively examine changes in gene expression induced by siRNA-mediated knockdown or DUB-IN-2 treated inhibition of USP8 in ARID1A-deficient and ARID1A-proficient cells. First, we extracted genes differentially expressed in ARID1A-deficient cells (ARID1A-) and ARID1A-proficient cells (ARID1A+) upon USP8 knockdown or inhibition. GSEA was conducted to identify 10 or 15 molecular pathways associated with these differentially expressed genes and identified molecular pathways affected specifically in ARID1A-deficient cells upon USP8 knockdown or inhibition, respectively (Fig. 5E, Supplementary Fig. 5C–F). Furthermore, it was narrowed down to three common molecular pathways (HALLMARK_HYPOXIA, HALLMARK_APOPTOSIS, HALLMARK_UV_RESPONSE_UP) among these molecular pathways (Fig. 5E–G, Supplementary Fig. 5G, H). In Fig. 3, we showed that USP8 inhibition induces apoptosis in ARID1A-deficient cells; this was supported by GSEA, which indicated that genes differentially expressed upon USP8 suppression in ARID1A-deficient cells were indeed associated with the HALLMARK_APOPTOSIS pathway (Fig. 5E–G, Supplementary Fig. 5G, H). In addition, 35 and 26 genes were extracted as core enrichment genes in the HALLMARK_APOPTOSIS pathway associated with a group of genes that varied by USP8 knockdown and USP8 inhibition, respectively (Supplementary Fig. 5I). Among these genes, 10 common genes were identified (Supplementary Fig. 5I). Among these genes, BMP2, which is involved in the induction of apoptosis23, was not affected by USP8 suppression in ARID1A-proficient RMG-I cells, but its expression was increased in ARID1A-deficient RMG-V and OVTOKO cells (Supplementary Fig. 5J). On the other hand, pathways downstream of FGFR2 are mediated by the STAT3 signaling pathway21,22. Thus, our results suggest that inhibiting USP8 in ARID1A-deficient cells induces degradation of FGFR2, which in turn suppresses downstream STAT3 signaling and triggers apoptosis (Fig. 5H).
Discussion
Advances in genome editing technology and advanced sequencing techniques have enabled large-scale genetic-dependency screening. Furthermore, the move towards open access to research data is helping to promote the development of new cancer therapies24,25. In this study, we utilized data from the DepMap portal, which has cataloged dependency factors for over 1,000 cancer cell lines, to identify the deubiquitinating enzyme gene USP8 as a synthetic lethal gene in ARID1A-deficient OCCC cells. A unique aspect of our analytical approach is that instead of analyzing cell lines derived from various cancer types, we focused specifically on ovarian cancer. This targeted analysis allowed us to identify USP8 as a promising synthetic lethal gene for ARID1A-deficient OCCC cells.
One of the crucial roles of USP8 is to promote deubiquityination, thereby regulating the stabilization and activation of proteins16. USP8 plays a role in preventing excessive activation of intracellular signals by regulating the stability of key receptor tyrosine kinases such as EGFR17,26. In this study, we found that inhibiting USP8 reduced the expression of the EGFR protein in an ARID1A-deficient OCCC cell line. Furthermore, FGFR2, another receptor tyrosine kinase distinct from EGFR, was identified as a deubiquitination target of USP8. Other reports have not suggested that FGFR2 is inhibited upon suppressing USP8; however, in the OCCC model used in this study, FGFR2 was identified as a deubiquitination target of USP8. Whether this phenomenon occurs in other cancer types is unclear, but it may represent an essential pathway in OCCC. Indeed, FGFR2 expression is associated with prognosis in OCCC, and FGFR2 inhibitors suppress the growth of OCCC cells27,28. These findings suggest that in ARID1A-deficient OCCC, downregulation of FGFR2 protein expression via USP8 inhibition could potentially suppress cell proliferation. In addition, the degradation of FGFR2 by inhibition of USP8 was suggested to be induced by increased ubiquitination. FGFR2 has been reported to be ubiquitinated by K751 [https://www.phosphosite.org]29. Therefore, when USP8 is present, ubiquitination in FGFR2-K751 may be suppressed so that the protein of FGFR2 is stabilized. However, when USP8 is suppressed, the ubiquitination of FGFR2-K751 may be enhanced, and the decrease of FGFR2 protein associated with the induction of proteasome-mediated degradation is improved, which may be the cause of the induction of synthetic lethality.
Downstream pathways of FGFR2 include the RAS-MAPK pathway, the PI3K-Akt pathway, and the IL6-JAK-STAT3 pathway, all involved in cell proliferation21,22,30,31,32. In this study, we found that inhibiting USP8 suppresses phosphorylation of STAT3-Y705 in ARID1A-deficient OCCC. The IL6-JAK-STAT3 pathway is activated in response to signals mediated by cytokines and growth factors such as IL633; however, IL6 receptor, upstream of STAT3 signaling, was degraded upon USP8 inhibition. Phosphorylated STAT3 translocates to the nucleus, where it induces the expression of anti-apoptotic factors and inhibits apoptosis34. The results of this study suggest that inhibiting USP8 promotes the degradation of FGFR2 via the proteasome, leading to suppression of STAT3 signaling in ARID1A-deficient OCCCs and subsequent induction of apoptosis.
Since approximately half of OCCCs carry ARID1A-deficient mutations, synthetic lethal therapy using the USP8 inhibitors identified in this study could become a crucial personalized treatment approach. The standard treatment for ovarian cancer typically involves the combined administration of platinum-based drugs and taxane drugs; however, side effects include nephrotoxicity and myelosuppression, which pose significant problems35,36. New therapies that utilize synthetic lethality differ from traditional cytotoxic treatments because they are less likely to affect normal cells, potentially reducing side effects37. We validated our findings that USP8 inhibitors may have a higher selectivity for ARID1A-deficient cancers than previously promising drugs in clinical trials. Since there have been few reports of clinical trials using deubiquitinating enzyme inhibitors, including USP8 inhibitors, for solid tumors, it remains unclear what side effects these inhibitors might exhibit when administered to humans. These uncertainties present a significant challenge. DUB-IN-2, the USP8 inhibitor used in this study, is a reagent-level compound. In the future, developing compounds with higher specificity and selectivity for USP8 could enhance therapeutic efficacy.
Inhibition of USP8 did not affect FGFR2 expression levels in ARID1A-proficient OCCC cells; however, a decrease in FGFR2 expression was observed in ARID1A-deficient OCCC. Why does promoting FGFR2 degradation through USP8 inhibition show selectivity for ARID1A-deficient OCCC? The expression level of USP8 protein tended to be lower in ARID1A-deficient cells than in ARID1A-proficient cells; however, expression of USP8 mRNA did not necessarily show the same tendency. This suggests that reduced expression of USP8 protein in ARID1A-deficient cells is not due to transcriptional repression. Therefore, it is possible that ARID1A deficiency promotes the degradation of the USP8 protein or that ARID1A itself enhances the synthesis of the USP8 protein. It is suggested that ARID1A deficiency enhances degradation of USP8 via lysosome but not proteasome or inhibition of protein synthesis. The reduced expression of USP8 protein in ARID1A-deficient OCCC may represent a vulnerability of ARID1A-deficient OCCC cells. Further inhibition of USP8 may more readily promote the degradation of FGFR2 via the proteasome. This study shows that inhibition of USP8 specifically causes FGFR2 proteolysis through the proteasome system in ARID1A-deficient cells. Furthermore, we found that the IL6/JAK/STAT3 pathway, one of the downstream pathways of FGFR2, is associated with genes whose expression specifically fluctuates in ARID1A-deficient cells. In addition, inhibition of USP8 suppressed the STAT3 pathway, specifically in ARID1A-deficient cells. These results suggest that ARID1A-deficient cells are dependent on the STAT3 pathway. Then, suppression of USP8 explicitly promotes the degradation of FGFR2 in ARID1A-deficient cells, and the STAT3 pathway, which is its downstream pathway, was suppressed, resulting in synthetic lethality by induction of apoptosis.
ARID1A-deficient cancers include a significant number of gastric cancers, biliary tract cancers, and pancreatic cancers6. Effective treatments for these types of cancer have not been developed, and synthetic lethal therapy using USP8 inhibitors could potentially be applicable. This approach should be investigated in future studies. Additionally, if its effectiveness is demonstrated, this therapy could be expanded to cancers with a high frequency of deficiency in genes that are part of the SWI/SNF chromatin remodeling complex (i.e., beyond ARID1A).
Methods
Materials
Compounds were purchased from Cayman (Alisertib, #13602; Bortezomib, #10008822), MedChemExpress (DUB-IN-2, HY-50737A; Talazoparib, HY-16106), Selleck (tazemetostat, S7128; valemetostat, S8926; olaparib, S1060; doxycycline (Dox), S5159; MG132, S2619; Lys05, S8369), and SIGMA (Cycloheximide, C7698). The ON-TARGETplus SMARTPool siRNAs specific for each target gene were purchased from Dharmacon (Supplementary Table 1).
Cell lines
Cells were maintained at 37 °C in a humidified incubator containing 5% CO2. The culture medium comprised DMEM/F-12 (Wako, 048-29785) supplemented with 10% fetal bovine serum (Gibco/Life Technologies), 10% GlutaMAX Supplement (Gibco, 41550021), and 100 U/mL penicillin/100 μg/mL streptomycin (Wako, 168-23191). The RMG-I (JCRB0172, JCRB), ES-2 (CRL-1978, ATCC), RMG-V (JCRB1729, JCRB), OVTOKO (JCRB1048, JCRB), OVISE (JCRB1043, JCRB) cell lines were obtained from the American Type Culture Collection (ATCC) or the Japanese Collection of Research Bioresources (JCRB) Cell Bank. The ES-2 cells were authenticated in 2020 using the PowerPlex 16 STR System (Promega). Although the other cell lines are not authenticated, these were used for functional experiments after less than 2 months of passaging post-receipt. All cell lines tested negative for mycoplasma by MycoAlert (Lonza, LT07-318).
Generation of lentiviruses and virus-infected cells
The cDNA-expressing lentiviral vectors (CMV-USP8-GFP-Bsd (OHS5898-224627058), Dharmacon), shRNA-expressing pSMART-inducible lentiviral vectors (TRE-shNT-mCMV-GFP-Puro (VSC11651); TRE-shUSP8-mCMV-GFP-Puro (V3SH11255-01EG9101), Dharmacon), and packaging plasmids (psPAX2 (#12260), pMD2.G (#12259), Addgene) were used for constitutive lentiviral expression of shRNA or cDNAs. To generate viruses, 293LTV cells were transfected with lentiviral plasmids and packaging plasmids using Lipofectamine 3000 (Thermo Fisher Scientific, L3000015). After 16–24 h, the medium was replaced with a fresh growth medium, and cells were incubated for 48 h. Lentivirus-containing supernatants were harvested and concentrated by centrifugation using a Lenti-X Concentrator (Takara, 631232). To establish cells infected with viral constructs, cells were transduced with lentivirus suspension containing 8 μg/mL polybrene (Nacalai Tesque, 12996-81) and then incubated for 24 h. The growth medium was then replaced with a fresh medium. After 24–48 h, the cells were incubated for a further 3–7 days in a growth medium containing 2 μg/mL puromycin (Wako, 160-23151) or 20 μg/mL blasticidin (Wako, 029-18701). To establish RMG-I-shNT, RMG-I-shUSP8, RMG-V-shNT, and RMG-V-shUSP8 cells, ARID1A-proficient RMG-I and ARID1A-deficient RMG-V cell lines were transduced with lentiviruses derived from the TRE-shNT-mCMV-GFP-Puro or TRE-shUSP8-mCMV-GFP-Puro- vectors. After selection with puromycin, resistant RMG-I-shNT, RMG-I-shUSP8, RMG-V-shNT, and RMG-V-shUSP8 cells were isolated. To establish RMG-V + USP8 cells, ARID1A-deficient RMG-V cells were transduced with lentiviruses derived from the CMV-USP8-GFP-Bsd lentivirus vector. After selecting blasticidin-resistant cells, a clone of RMG-V cells expressing the USP8 protein was isolated.
RNAi dependency screening
Data regarding context-specific enrichment of all dependencies in the DEMETER2 Data v6 were downloaded from depmap.org. For RNAi datasets, ovarian cancer cell lines were isolated and classified as ARID1A-WT (wild-type: 21 cell lines) or ARID1A-Def (deficient: 10 cell lines). 17,309 genes were analyzed for each group, excluding genes with five or more cell lines that could not be analyzed. Average dependency scores enriched in ARID1A-WT and ARID1A-Def ovarian cancer cell lines were calculated. Next, the dependency index was calculated as [(average of dependency scores of ARID1A-Def) – (average of dependency scores of ARID1A-WT)] and used to assess differences in the distribution of dependency scores between ARID1A-deficient ovarian cancer cell lines and ARID1A-proficient ovarian cell lines. The following genes with dependency indices of ≤-0.3 were identified: USP8, ARID1B, EGLN1, and EEF1A1.
Cell viability assay
To measure cell viability, cells were trypsinized, counted, and reseeded in 96-well plates at a density of 500 cells per well. After 2, 5, and 7 days, cell viability was measured in the CellTiter-Glo Luminescent Cell Viability Assay (Promega, G7571). To measure cell viability after siRNA transfection, cells were trypsinized, counted, and reseeded in 24-well plates at a density of 1–2 × 10⁵ cells per well. Next, the cells were transfected with siRNAs (50 nM) using Lipofectamine RNAiMAX (Thermo Fisher Scientific, 13778150). After 48 h, the cells were trypsinized, reseeded in 24-well plates, and transfected repeatedly with siRNAs (50 nM) using Lipofectamine RNAiMAX. Cells were trypsinized after 48 h, counted, and reseeded in 96-well plates at a density of 500 cells per well. After 7 days, cell viability was examined by measuring cellular ATP levels in a CellTiter-Glo Luminescent Cell Viability Assay (Promega, G7571). To measure cell viability after treatment with an inhibitor, cells were trypsinized, counted, and reseeded in 96-well plates at a density of 500 cells per well. After 24 h, the cells were treated with the indicated concentrations of inhibitors. After 6 days, cell viability was measured in the CellTiter-Glo Luminescent Cell Viability Assay (Promega, G7571). To measure cell viability after doxycycline treatment, shNT or shUSP8 cells were trypsinized, counted, and reseeded in 12-well plates at a density of 2–4 × 10⁵ cells per well. Next, the cells were treated for 72 h with 1 μg/mL doxycycline (Selleck, S5159), trypsinized, and the percentage of GFP-positive cells at Day 0 was assessed. Fluorescence was analyzed using a Guava easyCyte HT cytometer (Millipore). Residual cells were reseeded in 12-well plates and treated repeatedly with 1 μg/mL doxycycline. Cell viability was determined every 2–3 days by measuring the percentage of GFP-positive cells relative to that of GFP-positive cells in the Day 0 samples.
Quantitation of mRNA
To measure basal mRNA levels, 2 × 10⁴ cells were plated into 96-well plates and incubated for 24 h. For drug-treated cells, 2 × 10⁴ cells were plated into 96-well plates and incubated for 24 h. The medium was then replaced with the medium containing (or not) DUB-IN-2 and incubated for 24 h. To establish siRNA-transfected cells, 2 × 10⁴ cells were plated into 96-well plates, transfected with siRNAs (50 nM) using Lipofectamine RNAiMAX (Thermo Fisher Scientific; 13778150), and incubated for 48 h. First, mRNA was extracted from all cell lines, and cDNA was synthesized using the SuperPrep II Cell Lysis & RT Kit for qPCR (TOYOBO; SCQ-401). Aliquots of cDNA were subjected to quantitative PCR using the THUNDERBIRD Probe qPCR Mix (TOYOBO; QPS101) and TaqMan Gene Expression Assays (Thermo Fisher Scientific). The following gene-specific primer/probe sets were used for the TaqMan Gene Expression Assays: USP8 (Hs00987108_m1), PMAIP1 (NOXA) (Hs00560402_m1), BCL2L11 (BIM) (Hs00708019_s1), BMP2 (Hs00154192_m1) FGFR2 (Hs01552918_m1) and GAPDH (Hs99999905_m1) (Thermo Fisher Scientific). PCR was performed using an ABI StepOnePlus Real-Time PCR System (Applied Biosystems) under the following conditions: denaturation at 95 °C for 15 s, followed by annealing and extension at 60 °C for 30 s (40 cycles). For each sample, the mRNA level of target genes was normalized to that of GAPDH. The target/GAPDH ratios were then normalized against those in control samples using the 2−ΔΔCt method.
Western blot analysis
To measure basal protein levels, 5 × 10⁵ cells were plated into 6-well plates and incubated for 24 h. For drug-treated cells, 5 × 10⁵ cells were plated into 6-well plates and incubated for 24 h. The medium was then replaced with the medium containing (or not) 2 μM DUB-IN-2 and incubated for 6 h. To establish siRNA-transfected cells, 5 × 10⁵ cells were plated into 6-well plates and transfected with siRNAs (50 nM) using Lipofectamine RNAiMAX (Thermo Fisher Scientific; 13778150). After 48 h, the cells were trypsinized, reseeded in 6-well plates, and transfected repeatedly with siRNAs (50 nM) using Lipofectamine RNAiMAX. To extract proteins from whole cells, 5 × 10⁵ cells were harvested, washed with PBS, and lysed at 95 °C for 5 min with 150 μL of 1× SDS sample buffer. Chromatin was sonicated on ice (20 cycles of 15-second pulses; high setting; 15 sec between pulses) using a Bioruptor (M&S Instruments). To extract phosphorylated proteins from whole cells, 5 × 10⁵ cells were harvested, washed with PBS, lysed in 150 μL of RIPA buffer [50 mM Tris-HCl (pH 7.6), 150 mM NaCl, 1% Nonidet P40 Substitute, 0.5% Sodium Deoxycholate, and 0.1% SDS] supplemented with a proteinase inhibitor cocktail and a phosphatase inhibitor cocktail (Active Motif), incubated for 30 min on ice, and centrifuged at 4 °C for 10 min at 15,000 rpm. The soluble fractions of whole-cell lysates were mixed with 50 μL of 3 × SDS sample buffer, and protein concentrations were measured using the Pierce 660 nm Protein Assay Reagent (Thermo Fisher Scientific, 22660) and the Ionic Detergent Compatibility Reagent for Pierce™ 660 nm Protein Assay Reagent (Thermo Fisher Scientific, 22663). Next, 15 μg of protein was analyzed by immunoblotting. Briefly, proteins were separated by SDS-PAGE, transferred to PVDF membranes, and immunoblotted with the indicated antibodies. β-actin was used as a loading control. Membranes were blocked for 1 h at 25 °C with PVDF Blocking Reagent for Can Get Signal (TOYOBO, NYPBR01) and then probed for 1 h at 25 °C with Can Get Signal Solution 1 (TOYOBO, NKB-201) containing primary antibodies. After washing with TBS containing 0.1% Tween 20, the membranes were incubated for 30 min at 25 °C with TBS containing 0.1% Tween 20, 1% BSA, and horseradish peroxidase-conjugated anti-mouse (CST, 7076) or anti-rabbit (CST, 7074) secondary antibodies before visualization using Western Lightning ECL Pro (Perkin Elmer, NEL120001EA). Chemiluminescence signals were measured using a FUSION Chemiluminescence Imaging System (M&S Instruments). Antibodies specific for the following proteins were used for immunoblotting: USP8 (1:1000, CST, 11832), ARID1A (1:1000, CST, 12354S), FGFR2 (1:1000, CST, 23328S), EGFR (1:1000, CST, 4267), p21 Waf1/Cip1 (1:1000, CST, 29475), HSP90 (1:1000, Proteintech, 13171-1-AP), COX2 (1:1000, Proteintech, 66351-1-Ig), FBX15 (1:1000, Proteintech, 13024-1-AP), ERα (ESR1) (1:1000, CST, 13258), STAT3 (1:1000, CST, 9139), STAT3 pY705 (1:1000, CST, 9145), and β-actin (1:2000, CST, 4970 or 5125).
Animal ethics statement
Mouse experiments were approved by the National Cancer Center (NCC) Animal Ethical Committee under certificate protocol number T19-013-M06, respectively, and were performed in accordance with the Act on Welfare and Management of Animals. The experiments were carried out according to the Standards for Care and Keeping and Reducing Pain in Laboratory Animals. Mice were checked for clinical indications, tumor size, and body weight as specified in the experimental licenses. This study did not involve wild animals. This study did not involve samples collected from the field. 5 to 6-week-old female BALB/c-nu/nu mice (CLEA) were used in this study. All animals were maintained at sterile conditions with an ambient temperature of 20 °C to 26 °C, humidity of 30-70% (on average 50%), and a light/dark cycle of 12 hours. Sample sizes were determined based on the expected variance of the experiment and the technical limitations. Sample sizes for in vivo experiments of 4–8 tumors per group were used to have appropriate statistical power based on previous experience. Xenotransplantation is difficult, as transfers to other cages with unfamiliar male mice often result in fights and unnecessary injuries. In the pilot study, female mice were used because they are cost-effective and can be easily randomized to cages. Mice were sacrificed before reaching the approved humane endpoints of either a tumor size limit of 2000 mm3 or body weight loss of 20% or whenever they showed apparent clinical signs of pain. The maximum tumor size/burden was never exceeded in the studies.
Mouse xenograft model
Cells were counted and resuspended in a 1:1 mixture of PBS/Matrigel (Corning, 354234) (100 μL: 100 μL) on ice. Thereafter, cells (OVISE-shNT and OVISE-shUSP8 [1 × 10⁶ cells/mouse]) were injected into the 6-week-old female BALB/c-nu/nu mice flanks. Once the tumors were palpable (about 21 days after implantation), mice were divided randomly into two groups and fed either a diet containing Dox (625 ppm) or a control diet. In other experiments, tumor growth was measured every few days using calipers. The volume of implanted tumors was calculated using the formula V = L × W2/2, where V is the volume (mm3), L is the largest diameter (mm), and W is the smallest diameter (mm). At the end of the experiment, mice were sacrificed by cervical dislocation as a method of euthanasia.
Cell cycle analysis and the Annexin V/propidium iodide (PI) staining assay
For drug-treated cells, 1 × 10⁵ cells were plated into 24-well plates, incubated for 24 h, and treated with or without DUB-IN-2 for 3 days. For siRNA-transfected cells, 2 × 10⁵ cells were plated into 12-well plates and then transfected with siRNAs (50 nM) using Lipofectamine RNAiMAX (Thermo Fisher Scientific; 13778150). After 48 h, 5 × 10⁵ cells were trypsinized, reseeded in 12-well plates, and then transfected repeatedly for 48 h with siRNAs (50 nM) using Lipofectamine RNAiMAX. The cell pellets were washed with PBS suspended and fixed in cold 70% ethanol for cell cycle analysis and then incubated for 30 min at 4 °C. The fixed cells were centrifuged in a swing rotor, and the cell pellets were incubated in the dark for 10 min at 25 °C with 10 μg/mL PI and 100 µg/mL RNAase A (Nippon Gene, 318-06391). The Annexin V–FITC/PI Apoptosis Detection Kit (Roche, 11858777001) was used to detect Annexin V-positive cells. Briefly, the cell pellets were washed with PBS, suspended in 1× binding buffer, and then incubated in the dark for 10 min at 25 °C with Annexin V–FITC and PI. Fluorescence was analyzed on a Guava easyCyte HT cytometer (Millipore). The gating of live cells was based on SCC and FSC area parameters. Annexin V–FITC positive fractions were detected by assessing the percentage of cells whose signal intensity was higher than that of cells abundant in non-treated samples. The percentage of Annexin V-positive cells was calculated using GuavaSoft software (v. 2.7).
Detection of cleaved caspase 3/7
Cleaved caspase 3/7-based apoptosis was detected using the Caspase-Glo 3/7 Assay (Promega, G8091). To measure levels of apoptosis after treatment with DUB-IN-2, cells were trypsinized and counted and then reseeded in 96-well plates at a density of 1 × 10⁴ cells/well before drug exposure at the indicated concentrations. After 24 h, luminescence was measured using a Nivo plate reader (Perkin Elmer). Cell viability was also measured using the CellTiter-Glo Luminescent Cell Viability Assay (Promega, G7571). Cleaved caspase 3/7 signals were normalized to cell viability. Signal ratios in treated samples were normalized against those in untreated samples.
Ubiquitination profiling using an antibody array
Cells were trypsinized, counted, and reseeded in a 10-cm dish at a density of 4 × 10⁶ and then incubated for 24 h. The cells were treated for 6 h without or with 2 μM DUB-IN-2. Finally, the cells were harvested and washed with PBS. Antibody array analysis used the Proteome Profiler Human Ubiquitin Array Kit (R&D Systems; ARY027). Chemiluminescence was measured using a FUSION Chemiluminescence Imaging System (M&S Instruments). Signal intensity was measured using Image J 1.54 g Software38. The signal intensity ratio is relative to the signal intensity of ERα (the Highest signal spot) in cells treated with DUB-IN-2 was calculated.
RNA-seq analysis
To examine siRNA-transfected cells, 5 × 10⁵ cells cultured in 6-well plates were transfected with siRNAs (50 nM) using Lipofectamine RNAiMAX (Thermo Fisher Scientific; 13778150) for 48 h. Next, the cells were trypsinized, reseeded in 6-well plates, and transfected repeatedly for 48 h with siRNAs (50 nM) using Lipofectamine RNAiMAX. To examine drug-treated cells, 5 × 10⁵ cells were plated into 6-well plates and incubated for 24 h. The medium was then replaced with the medium containing (or not) 2 μM DUB-IN-2 and incubated for 6 h. These cells were washed with PBS, and RNA was isolated using the RNeasy Mini Kit (Qiagen). Library preparation for RNA-seq samples was performed in the Rhelixa using the Poly(A) mRNA Magnetic Isolation Module (New England Biolabs) and the NEBNext Ultra II Directional RNA Library Prep Kit for Illumina (New England Biolabs). Sequencing was performed on an Illumina Novaseq 6000, with 150 bp paired-end reads for RNA-seq.
Gene set enrichment analysis (GSEA)
FeatureCounts version 2.0.639 was used to count mapped reads for GSEA 4.3.240. The expression dataset was analyzed using the Molecular Signatures Database (MSigDB)40. GSEA identified significant gene sets at the top or bottom of the ranked gene sets that were differentially expressed between the compared gene sets. The present study used the MSigDB hallmark gene sets. Gene sets with an FDR (False Discovery Rate) q value < 0.25 and a Normal p-value < 0.05 were significantly enriched.
Statistical analysis
Statistical analyses were performed using Microsoft Excel or GraphPad Prism 8. As the figure legends indicate, data are expressed as mean ± SD or mean ± SEM. The sample size (n) is indicated in the figure legends and represents the number of biological or technical replicates. Statistical significance was evaluated using a two-tailed Student’s t-test. Statistically significant differences are indicated by asterisks as follows: *p < 0.05, **p < 0.01, and ***p < 0.001.
Responses